Bear Flag Stocks: Master the Bear Flag Setup for bear flag stocks
Definition And Anatomy Of The Bear Flag Pattern
In technical analysis, a bear flag pattern signals that a sharp downtrend is merely pausing before it resumes. Traders spot this formation to find high-probability entry points for short positions. It’s a visual clue that sellers still hold the reins.
Understanding The Bear Flag Through Analogy
Imagine you’re speeding down a mountain road when you pull off briefly to catch your breath. You haven’t changed direction—you’re just gathering momentum for the next descent. In markets, a bear flag acts the same way: a brief, shallow rally before the next leg downward.
Components Of A Bear Flag Pattern
Once you know what to look for, the bear flag breaks down into two clear structures:
- Flagpole: The initial, steep drop in price on high volume, showing sellers are in control.
- Flag: A short, upward-sloping channel on low volume, reflecting a weak counter-trend rally that usually fizzles out.
Why The Bear Flag Matters
A bear flag paints a picture of market psychology. The tall flagpole is sellers stamping their authority, while the subdued flag tells you buyers lack real conviction. When price finally breaks below the flag’s lower trendline on rising volume, it confirms sellers are back in the driver’s seat.
This pattern is the mirror image of its bullish counterpart. If you’d like to see how trends pause before pushing higher, check out our comprehensive guide on trading bull flag chart patterns. The principles of trend continuation are almost identical.
Bear Flag Pattern At A Glance
Below is a quick reference to the core components and what they imply in the market. Keep this table handy when you’re scanning charts for potential setups.
| Component | Description | Market Implication |
|---|---|---|
| Prevailing Trend | A clear, established downtrend must be in place. | Signals continuation, not reversal. |
| Flagpole | A sharp, nearly vertical price drop on high volume. | Confirms strong selling momentum. |
| Flag | A brief consolidation with a slight upward tilt. | Indicates a weak, short-lived rally. |
| Volume | Spikes during the flagpole, then tapers off in the flag. | Confirms the pause is temporary rather than a reversal. |
| Breakdown | Price falls below the flag’s support line on volume surge. | Validates that the downtrend is resuming. |
Use this snapshot as your starting point. When the real-time chart aligns with these elements, you’re looking at a textbook bear flag setup.
Identifying a High-Probability Bear Flag Setup
Anyone can spot a pattern that looks like a bear flag. That's the easy part. The real skill is knowing the difference between a weak, flimsy signal and a high-probability setup that has professional traders circling.
Let's be clear: not all bearish pauses are created equal. A true, high-quality bear flag has a very specific DNA. It’s the market’s way of showing you that sellers are just reloading before the next aggressive push lower.
Think of it like a detective gathering evidence at a crime scene. A single clue rarely solves the case. You need multiple, confirming pieces of evidence to build a strong conviction. For traders hunting bear flags, those clues come from price action, time, and, most importantly, volume.
The Anatomy of a Powerful Setup
First, you need a flagpole. And it has to be a monster—a sharp, almost vertical drop in price. This isn't a stock gently drifting down; it's a brutal, impulsive move that screams overwhelming selling pressure. A weak, choppy decline just doesn't have the same conviction. It's a non-starter.
Next comes the flag. After that violent drop, the price should consolidate in a tight, orderly channel. This channel will often drift slightly upward, fighting against the primary downtrend. If you see a messy, volatile consolidation, that’s a sign of indecision. What you want is a tight, narrow flag—it tells you this is just a brief pause, a moment for sellers to catch their breath.
The Decisive Role of Volume
Volume is the ultimate truth-teller in the market. It exposes the conviction behind every price move, and it's absolutely critical for validating a bear flag. The volume profile during the pattern's formation tells a story, and you need to know how to read it.
A high-probability setup follows a clear sequence:
- High Volume on the Flagpole: That initial, brutal price drop must happen on a massive surge in trading volume. This is your proof that the selling pressure is real and backed by big money.
- Declining Volume in the Flag: As the consolidation channel forms, volume needs to dry up. This is the smoking gun. It shows that the little counter-trend rally has no real buying interest behind it. Buyers aren’t stepping in, and the upward drift is just weak short-covering.
A low-volume consolidation following a high-volume sell-off is the market telegraphing its next move. The lack of buying interest during this pause makes the subsequent breakdown far more likely.
This specific volume behavior is what gives the pattern its statistical edge. Research consistently shows that the bear flag's reliability is supercharged by this distinct profile. The consolidation on fading volume signals that buying pressure is exhausted, right before a sharp volume spike arrives on the downside breakout.
In fact, studies of these patterns show that downtrends featuring bear flags average a 50-day duration and see declines of 17-18% both before and after the flag forms. That’s a powerful statistic. You can discover more insights on how these statistics reinforce the pattern's validity by exploring detailed analyses of historical consolidations.
Building Your Identification Checklist
To avoid the common trap of mistaking a potential bottom for a bear flag, seasoned traders live by a strict, rule-based checklist. It’s a systematic approach that strips emotion from the decision and forces you to focus only on the A+ setups.
Here’s a simple decision-making flowchart to help you visualize the process.
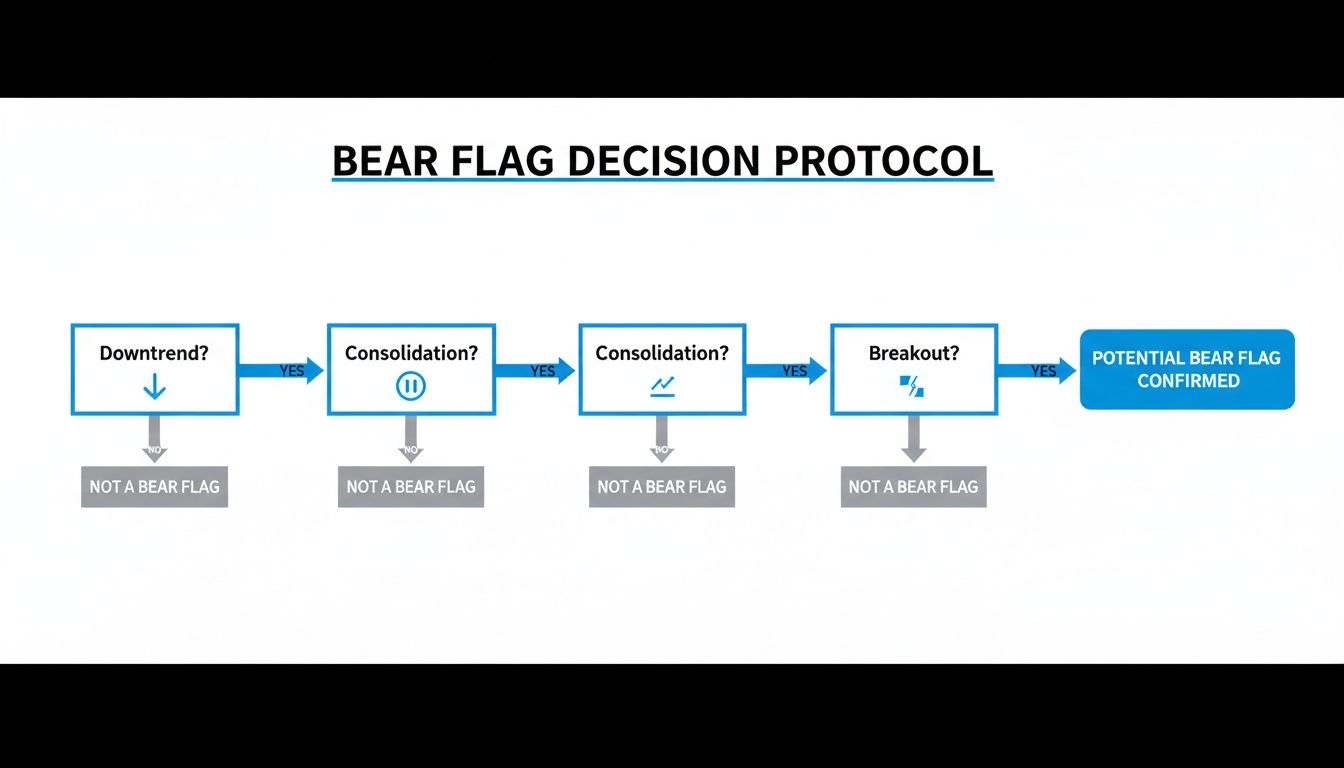
This visual guide makes it plain: each step is non-negotiable. You must confirm the downtrend, identify the specific type of consolidation, and wait for the breakout.
Finally, remember that context is everything. A bear flag forming below a key moving average, like the 50-day SMA, adds another powerful layer of confirmation. It shows the pattern is aligning with the broader bearish market structure. When multiple technical signals all point to the same conclusion, the probability of a successful trade skyrockets. Stick to these strict criteria, and you'll learn to filter out the noise and focus only on the bear flags that offer a genuine statistical edge.
The Statistical Edge of a Bear Flag
Spotting a pattern on a chart is just the first step. The real question is, does it actually work? This is where professional traders separate themselves from the crowd—by moving from gut feelings to data-driven decisions. So, what do the numbers say about the good old bear flag?
When you trade a bear flag, you’re not just chasing a shape. You're playing the odds. You're capitalizing on a statistical tendency that has proven itself over and over again. The pattern's true strength is its consistency, giving you a quantifiable edge when the setup is clean.
Think of it like a professional poker player. They don't win every hand, but they know which hands give them the best odds over the long haul. The bear flag is one of those premium hands in a downtrending market. Let’s look at why.
What the Performance Data Shows
There’s no magic bullet in trading. No pattern works 100% of the time, and anyone who tells you otherwise is selling something. The goal is to find setups with a positive expectancy—patterns that, across hundreds of trades, make you more than they lose.
The bear flag consistently delivers on this front, especially when it forms within a powerful, established downtrend. Its structure is a classic sign of sellers taking a quick breather before the next push lower. Buyers try to step in, but they're exhausted, and the path of least resistance is clearly down.
The real power of the bear flag isn't just its shape, but its statistical footprint. It's a pattern that has been tested across thousands of market cycles, consistently showing that a pause in a downtrend is more likely to resolve lower.
One of the most thorough studies on chart patterns backs this up with hard numbers. After analyzing over 15,000 patterns, the research showed that bear flags in declining markets are incredibly robust. On average, stocks dropped another 17% after breaking down from the flag. Crucially, 61% of these patterns hit their measured price targets. You can see the compelling findings and methodology for yourself to really appreciate the depth of the analysis.
How Bear Flags Stack Up Against Other Patterns
To truly appreciate the reliability of the bear flag, it helps to see how it compares to other common patterns. Not all formations are created equal, and knowing their relative strengths is key to knowing where to place your bets.
While patterns like triangles or head and shoulders have their place, the bear flag stands out for its clarity and performance when you're trading with the trend. Here's a quick look at how it measures up.
Bear Flag Performance Metrics vs Other Patterns
The table below gives you a high-level comparison of how bear flags perform against other common technical patterns. This isn't about saying one is "better" than another in all situations, but it highlights why trend-followers love the bear flag.
| Chart Pattern | Overall Accuracy | Average Performance | Failure Rate |
|---|---|---|---|
| Bear Flag | High (in downtrends) | ~17% average decline | Low (in downtrends) |
| Head & Shoulders | High (reversal) | Varies by asset | Moderate |
| Descending Triangle | Moderate-High | ~14% average decline | Moderate |
| Symmetrical Triangle | Lower (neutral bias) | Varies, less reliable | High |
The data makes it pretty clear: if your goal is to short a stock that's already weak, the bear flag offers one of the most dependable signals you can find. Its low failure rate in bearish markets, combined with a significant average price move, gives you the statistical foundation you need to build a professional trading strategy.
How Bear Flag Stocks Behave in Real Markets
Theory is one thing, but watching a pattern play out in a live market is where a trader's education really begins. Moving from clean textbook diagrams to the chaotic, real-world charts is where you see how the psychology of fear and greed actually drives these formations. It’s one thing to memorize the rules; it's another to see them executed under pressure.
This is where we connect the dots. We'll look at how bear flag stocks have actually behaved, pulling examples from major market downturns to show how these simple patterns offered powerful clues for those who knew what to look for.

Case Study 1: The 2008 Financial Crisis
The 2008 meltdown was a textbook environment for bearish continuation patterns. As the market cascaded lower, fear was the only thing on the menu. This created the perfect setup for sharp sell-offs followed by weak, uninspired bounces—the very definition of a bear flag.
The SPDR S&P 500 ETF (SPY), which mirrors the broader market, gave us a classic example. After a brutal drop in September 2008, SPY went into a brief consolidation. Volume completely dried up on that attempted rally, signaling that buyers had zero appetite to fight the overwhelming downtrend. The breakdown that followed led to one of the most vicious legs of the entire financial crisis.
This exact pattern repeated on countless individual stocks during that time. Traders who spotted this structure were able to get positioned for the next wave down instead of getting suckered into what looked like a potential bottom.
Case Study 2: The 2022 Bear Market
Fast forward to the 2022 bear market, and we find another fertile ground for these patterns. As the Federal Reserve jacked up interest rates to fight inflation, the high-flying growth and tech stocks got absolutely hammered.
Think about one of those tech darlings that had enjoyed a massive run-up in the years prior. As the market turned, it suffered a nasty initial sell-off—that's our flagpole. What followed was a few weeks of sideways-to-upward drift on noticeably lighter volume. Hopeful investors called it a bottom, but seasoned traders saw the classic signs:
- The Flagpole: A sharp, high-volume dive as institutions started dumping their shares.
- The Flag: A low-volume drift as retail traders tried to "buy the dip," but with no big money backing them up.
- The Breakdown: A clean break below the flag’s support on a surge of volume, confirming the downtrend was back on.
This sequence played out over and over, proving just how timeless the bear flag is. It thrives in an environment where fear dominates and every little rally is seen as a chance to sell, not to buy.
The recurrence of bear flags during major economic downturns is not a coincidence. These patterns are a direct reflection of market psychology, where periods of panic selling are followed by brief, unconvincing pauses before the selling continues.
History is littered with these examples. During the 2008-09 crisis, SPY formed a classic bear flag in the middle of a mind-boggling 54% plunge. You could find similar setups during the 1973-74 downturn, and in 2022, a bear flag on the EUR/USD chart preceded a breakdown to new lows, showing the pattern works across all asset classes. You can learn more about how these patterns repeat by analyzing historical stock trading patterns.
Key Takeaways from Real-World Examples
Looking back at these charts teaches us a few critical lessons about trading bear flags. This pattern isn't just a shape on a screen; it’s a story about the battle between buyers and sellers.
1. Context is King: Bear flags are most reliable when they appear inside a clear, established downtrend. A similar-looking pattern in a choppy, sideways market just doesn't have the same punch.
2. Volume Confirms the Narrative: In every solid example, the volume signature tells the story. You need to see a high-volume flagpole followed by a low-volume flag—that part is non-negotiable. The eventual breakdown also needs a spike in volume to prove it’s the real deal.
3. Psychology Drives the Price: The "flag" part of the pattern is a trap. It preys on the hope of bottom-fishers and dip-buyers. When that little rally fails and the price breaks down, it forces all those hopeful buyers to sell, creating a cascade that fuels the next move lower.
By studying these real-world examples, you start training your eyes to see the structure underneath the daily noise. You begin to recognize the anatomy of a trend and pinpoint the critical spots where it's likely to continue. This is how you move from being a reactive trader to a proactive one—the kind who anticipates the next move based on proven, repeatable market behavior.
Automating Your Hunt for Bear Flag Stocks
Let's be honest: manually flipping through hundreds of charts every day is a surefire way to burn out. In today's markets, you either keep up or get left behind. Professional traders don't hunt for patterns one by one; they build systems that bring the best opportunities directly to them. This is where a good stock scanner becomes your most valuable employee.
By teaching a machine the visual rules of a bear flag, you create a system that tirelessly scours the market for you. This does more than just save you hours of grunt work. It forces discipline by making you stick to your trading rules right from the start and strips the emotion out of your initial search.
Translating Rules into Scanner Criteria
The goal here is simple: convert the visual pattern into cold, hard numbers your software can understand. We can take the core components we’ve already discussed—the flagpole, the flag, and the volume—and translate them into a language that a platform like ChartsWatcher speaks. A truly effective scan for bear flag stocks is built on a few key pillars.
Here’s a simple, foundational set of criteria to get you started:
- The Flagpole Filter: First, you need to find stocks that have taken a nosedive recently. A great place to start is scanning for stocks that are down -15% or more over the last 10 to 20 trading sessions.
- The Consolidation Filter: Next, we need that low-volatility pause. Look for stocks trading within a tight range, something like a 5% price range, for the last 5 to 10 sessions. This finds the sideways drift.
- The Volume Filter: This is the confirmation piece. The scan must specify that volume during the consolidation (the flag) is way down compared to the volume during the big drop (the flagpole). A filter like "5-day average volume is 50% less than the 20-day average volume" works perfectly.
This isn't just a filter for "stocks that went down." It's a multi-layered hunt for the specific signature of a bear flag getting ready to break.
Building Your Custom Dashboard in ChartsWatcher
A powerful scanner is only half the battle. How you organize the results is just as crucial. In ChartsWatcher, you can build a dedicated dashboard designed to spot and track potential bear flag stocks in real time.
The dashboard above gives you an idea of how to set up your workspace. You can have your scan results, live charts, and key news all synced up. This layout lets you see a setup flag, click to instantly confirm the pattern on a chart, and check for any news catalysts—all from a single screen.
This setup transforms your workflow from a tedious manual slog to a sharp, systematic process of finding opportunities. By automating the discovery phase, you free up your mental energy to focus on what actually makes you money: analyzing the highest-quality setups. To go even deeper, check out our guide on how to automate a trading strategy for a complete blueprint.
A well-built scanner doesn't replace the trader; it empowers them. Automation handles the repetitive, time-consuming work of finding potential setups, freeing you up to focus on what truly matters—execution, risk management, and in-depth analysis of the best candidates.
And your automation efforts don't have to stop there. A simple, free way to keep a pulse on market chatter is by setting up Google Alerts. You can create alerts for terms like "bear flag" or for specific stocks on your watchlist. It's a great complementary tool for monitoring sentiment and news flow, adding another layer of context to your chart work.
A Professional Framework for Trading Bear Flags
Spotting a promising bear flag is one thing. Actually making money from it is another game entirely. Professional traders know that execution—how you enter, manage risk, and take profits—is what separates consistent winners from those relying on luck. A solid framework removes the emotional guesswork, turning a simple chart pattern into a repeatable, high-probability strategy.

Think of this like a pilot's pre-flight checklist. It's a non-negotiable routine that ensures every critical component is in place before you risk a single dollar. This system gives you clear rules for your entry, stop-loss, and targets, so when the setup appears, you can act decisively.
Pinpointing Your Entry Trigger
The classic entry trigger is a decisive candle close below the flag's lower trendline. I emphasize close for a reason. Waiting for the candle to finish, rather than jumping in on an intraday dip, is your best defense against "fakeouts"—those nasty dips that snap right back up. A solid close confirms the sellers are in control.
But that's only half the story. The trigger is only valid if it’s backed by a significant increase in volume. A breakout on weak, pathetic volume is a huge red flag; it screams a lack of conviction. Heavy volume, on the other hand, tells you the big institutions are selling, giving the move the fuel it needs.
Establishing a Logical Stop-Loss
Your stop-loss is your escape hatch. It defines your maximum pain point and tells you precisely when your trade idea is busted. For a bear flag, the most logical place for it is just above the highest point of the flag's consolidation channel.
Placing it here does two critical things:
- It gives the trade some wiggle room, so you don't get shaken out by random market noise.
- More importantly, a move above this level completely invalidates the pattern. It's a clear signal that buyers have wrestled back control and the bearish story is over.
A well-placed stop-loss isn't just a defensive move; it's a strategic decision. It’s the price level where the story you were trading—the story of a bearish continuation—no longer makes sense.
Setting Data-Driven Profit Targets
Guessing where to take profits is a recipe for disaster. Instead, we use a simple, objective technique called the measured move.
Here's how it works:
- Measure the Flagpole: Calculate the price distance of that initial, sharp drop that formed the flagpole.
- Project from the Breakout: Take that same distance and subtract it from the point where the price broke below the flag.
This gives you a logical, data-driven target based on the pattern's own volatility. It’s not magic, but it provides a disciplined goal to aim for. Another option is to target a major historical support level, where you’d expect buyers to show up in force.
Ultimately, a robust trading plan combines these pieces with smart risk management. Before you even think about entering, make sure your potential reward is a healthy multiple of your risk. A risk-to-reward ratio of at least 1:2 is a professional standard. This structured approach is what gives you the discipline needed for long-term success.
Common Questions About Bear Flag Stocks
Even after you've got the basic strategy down, some lingering questions about the finer points of bear flags always pop up. It's totally normal. Let's tackle some of the most common ones I hear from traders to help sharpen your eye for these setups.
How Long Should a Bear Flag Consolidation Last?
There's no magic number, but you're typically looking at a consolidation that lasts anywhere from a few days to a few weeks. If you're watching the daily chart, this usually translates to a range of about 5 to 20 candles.
If the flag starts dragging on for much longer than that, its reliability starts to fade. A long, drawn-out sideways grind can be a sign that the bears are losing steam, and the market might be trying to carve out a bottom instead of continuing the downtrend.
What Is the Difference Between a Bear Flag and a Bearish Pennant?
Great question. They're both bearish continuation patterns, but they look a little different on the chart. A classic bear flag carves out a neat, rectangular channel that drifts slightly upward. A bearish pennant, on the other hand, looks more like a small, symmetrical triangle, with the price squeezing into a tighter and tighter point.
From a statistical standpoint, their performance is nearly identical. Research shows they produce very similar average price declines after breaking down. However, the classic bear flag tends to hit its price target a little more reliably.
Can a Bear Flag Pattern Fail?
Absolutely. And you should expect them to. No chart pattern works 100% of the time, and knowing the warning signs of a dud is just as important as knowing the entry signal.
The biggest red flag is an upside breakout. If the price breaks above the top of the flag's channel, especially on a surge of volume, it’s a clear signal that buyers have stepped in and overpowered the sellers. The continuation trade is off the table.
Another warning sign is a breakdown on anemic volume. If the price trickles below the flag's support without any real conviction from sellers, it's prone to a quick snap-back rally. This is precisely why a disciplined stop-loss placed just above the flag's high is non-negotiable.
Ready to stop hunting for setups and start finding them systematically? ChartsWatcher gives you the advanced scanning tools and real-time data you need to find the best bear flag stocks before they break. Build your custom dashboard and automate your trading strategy today.
