A Trader's Guide to Trading Risk Control
Let's be blunt: trading risk control is the non-negotiable business plan that separates the pros from the gamblers. It’s not about being right every time. It’s a disciplined framework for managing what happens when you’re wrong, ensuring one bad trade doesn't blow up your entire account.
The Unspoken Key to Profitable Trading
Most aspiring traders obsess over finding that perfect entry signal. They spend months, even years, hunting for a holy grail strategy with a 70% or 80% win rate.
Here's a secret from my years in the trenches: long-term profitability has very little to do with how often you win. It has everything to do with how you manage your capital when you inevitably lose. Real, sustainable trading careers are built on a solid foundation of risk control.
This isn't just theory—it's the gritty, day-to-day process of protecting your account from catastrophic losses. It’s a systematic approach to deciding exactly how much skin you'll have in the game on any single trade and, crucially, defining your exit point before you even click "buy."
The Three Pillars of Risk Control
At its core, a solid risk management plan stands on three simple but essential pillars. Getting these right will shift your focus from chasing winners to preserving capital, which is the real secret to staying in this game.
- Smart Position Sizing: This isn't about a gut feeling. It’s about calculating how many shares or contracts to trade based on a pre-defined risk percentage of your total account.
- Strategic Stop-Loss Orders: A stop-loss is your pre-planned escape hatch for a losing trade. Think of it not as a failure, but as an essential tool for cutting your losses short and living to fight another day.
- True Portfolio Diversification: This means more than just owning a bunch of different tech stocks. It's about spreading your risk across assets that don't move in lockstep, insulating your portfolio from a single market shock.
Let’s make this real. Imagine Trader A has a killer 70% win rate but gets cocky and risks 20% of their account on each trade. Meanwhile, Trader B has a modest 50% win rate but is disciplined, never risking more than 1% per trade.
After just a few consecutive losses, Trader A is completely wiped out. Trader B, on the other hand, weathers the same losing streak, protects their capital, and is ready for the next opportunity. Who do you think lasts in this business?
The goal of a successful trader is to make the best trades. Money is secondary. The key is to focus on the process, and the profits will follow as a natural byproduct of excellent execution and disciplined risk management.
History is littered with stark warnings about ignoring risk. One of the most famous examples is Black Monday, October 19, 1987. The Dow Jones Industrial Average tanked by an almost unbelievable 22.6% in a single day. This event showed that even major markets can go haywire, and it led directly to the creation of circuit breakers—a powerful reminder of why robust risk controls are non-negotiable.
The screenshot below from a ChartsWatcher dashboard shows how a personalized layout helps you monitor multiple assets and alerts at once.
This kind of centralized view is invaluable. It lets you instantly see your total exposure across your portfolio, making it far easier to stick to your risk control plan. And while this guide is focused on trading, exploring general risk management principles from other fields can give you an even broader perspective on control strategies.
Calculating Your Position Size Like a Pro
Forget guessing how many shares to buy. Forget throwing a random dollar amount at a trade and hoping for the best. That’s like walking through a minefield blindfolded—sooner or later, you're going to step on the wrong trade and do catastrophic damage to your account.
Professional traders don’t guess. They operate on a foundation of mathematical precision, and the absolute cornerstone of their risk control is position sizing.
Why Fixed Share Sizes Will Blew Up Your Account
The most common mistake I see new traders make is using a fixed share size or a fixed dollar amount for every trade. They'll decide to always buy 100 shares of any stock, or maybe risk $500 per trade, no matter what. This is a recipe for disaster.
Why? Because risking $500 on a volatile penny stock with a wide stop-loss is a completely different universe than risking $500 on a stable blue-chip with a tight stop. The actual risk exposure is worlds apart, leading to unpredictable swings in your P&L that you can't control.
The Professional Approach: The Percentage Risk Model
The solution is the percentage-risk model, often called the "1% rule" or "2% rule." It’s a simple but incredibly powerful concept: you decide on a small, fixed percentage of your total trading capital that you are willing to lose on any single trade.
For example, if you have a $25,000 account and stick to a 1% risk rule, the absolute maximum you can lose on one trade is $250. This percentage stays the same, but the dollar value naturally adjusts as your account grows or shrinks. This creates a consistent, mathematical framework that protects you from yourself.
This method forces you to put capital preservation first. Your primary job isn't to find winners; it's to protect your account so you can stay in the game long enough to find winners.
This chart drives the point home. It shows how a trader with a lower win rate but solid risk management can easily outperform someone with a high win rate who is reckless with their capital.
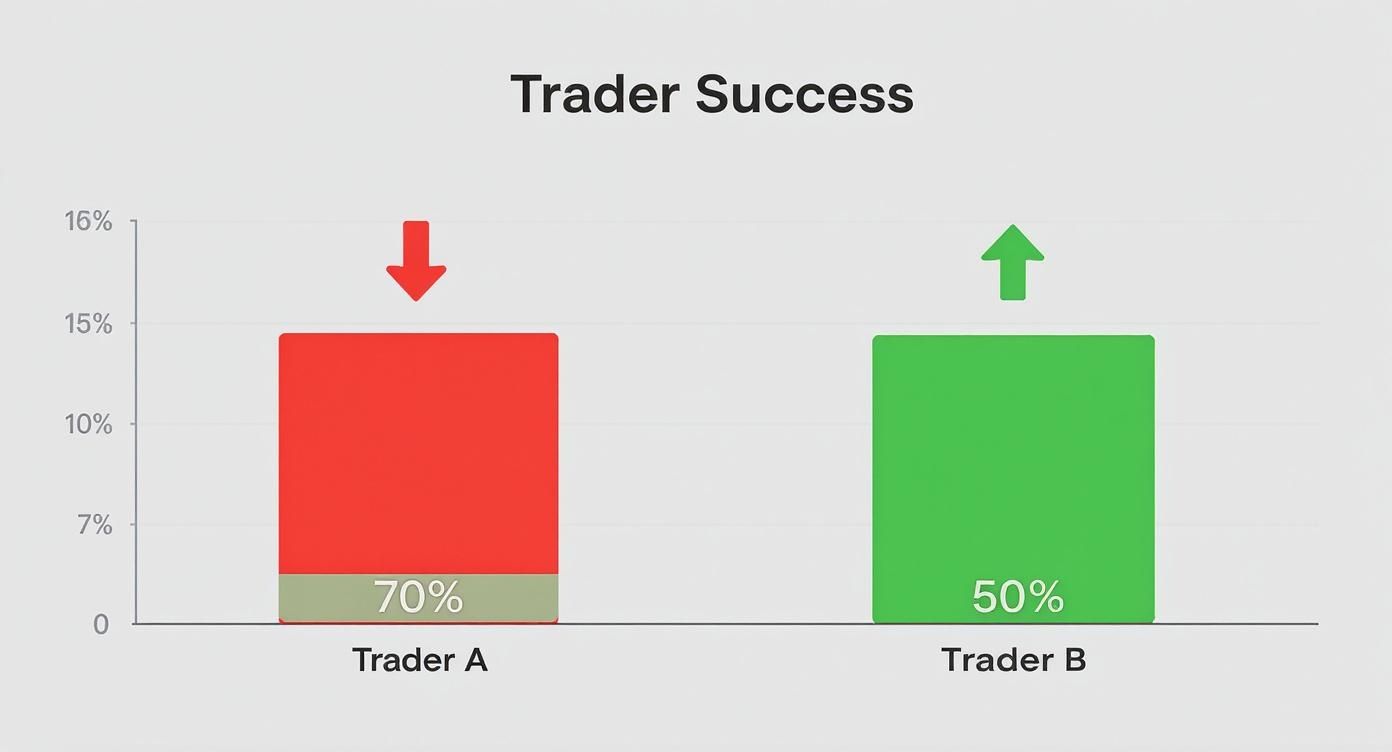
As you can see, disciplined risk management—not just a high win rate—is the true engine of long-term profitability.
How Risk Per Trade Impacts Account Volatility
To see just how quickly small risk percentages can spiral out of control during a losing streak, let's look at the math. This table shows the damage a 10-trade losing streak would do to a $10,000 account at different risk levels.
| Risk Per Trade | Account Value After 10 Losses | Total Drawdown | Gain Needed to Recover |
|---|---|---|---|
| 1% | $9,043.82 | 9.56% | 10.57% |
| 2% | $8,170.73 | 18.29% | 22.39% |
| 5% | $5,987.37 | 40.13% | 67.02% |
| 10% | $3,486.78 | 65.13% | 186.84% |
Notice how the "Gain Needed to Recover" skyrockets. Risking 5% or 10% per trade seems manageable on paper, but a string of losses—which is inevitable for every trader—can put you in a hole that’s nearly impossible to climb out of. Sticking to a 1-2% risk model keeps drawdowns manageable and recovery realistic.
The Calculation in Action
The key to making this work is to determine your stop-loss before you even think about hitting the buy button. Your stop-loss isn't just an exit point; it's a critical variable in your position sizing formula.
The formula is pretty simple:
Position Size = (Total Account Value x Risk Percentage) / (Entry Price - Stop-Loss Price)
Let's walk through a real-world example.
- Total Account Value: $25,000
- Risk Percentage: 1% (so, your max loss is $250)
- Asset: Stock XYZ
- Planned Entry Price: $50.00
- Planned Stop-Loss Price: $48.50
First, you figure out the risk per share: $50.00 - $48.50 = $1.50. This is how much you'll lose on each share if the trade moves against you and hits your stop.
Next, you divide your maximum dollar risk by that per-share risk: $250 / $1.50 = 166.66. You'd round this down to 166 shares.
By buying 166 shares, you've guaranteed that if your stop-loss gets hit, your total loss will be contained to approximately $250 (166 shares * $1.50 loss/share = $249). You’ve perfectly aligned your trade with your 1% risk rule.
Pro Tip: Always define your stop-loss based on technical analysis—like putting it just below a key support level or using an indicator like ATR. Don't move your stop just to be able to buy more shares. The market structure should dictate your stop, and your stop dictates your size. Never the other way around.
Doing this math manually for every single trade is tedious and, when markets are moving fast, you're bound to make a mistake. This is where good tools come in. If you want to dive deeper into streamlining this, you can learn how to master your trades with a position size calculator, which can automate these crucial calculations.
Using a platform like the ChartsWatcher dashboard lets you build these calculations right into your workflow. You can set your risk parameters once, and the tool instantly tells you the correct position size for any setup. This automation turns a critical but manual task into a seamless part of your routine—a massive step in professionalizing your trading.
Setting Stop-Loss Orders That Actually Work
A stop-loss isn't just a random price you pick out of thin air; it’s a calculated, strategic decision. Moving beyond placing stops based on fear or an arbitrary dollar amount is a huge step in your trading journey. An intelligent stop-loss transforms from a simple safety net into an active part of your trading edge.
Your stop-loss should be based on market logic, not emotion. It represents the point where your original trade idea is proven invalid. Placing it too close risks getting stopped out by normal market noise, while placing it too far away exposes your account to unacceptable losses.
Let's dive into three powerful methods for placing stops that give your trades a real chance to succeed while still protecting your capital.
Using Volatility to Your Advantage
One of the best ways to determine a logical stop-loss is by measuring an asset's recent volatility. The Average True Range (ATR) indicator is perfect for this. The ATR measures the average price movement over a specific period, giving you a data-driven way to set a stop that respects the asset's natural "breathing room."
For example, if a stock's daily ATR is $2.50, placing a stop-loss just $0.50 below your entry price is asking for trouble. The stock could easily move against you by that much during normal daily fluctuations before heading in your intended direction.
A common technique is to set your stop-loss at 2x the current ATR value below your entry for a long trade (or above for a short). This method adapts to the market; in volatile conditions, your stop will be wider, and in quieter markets, it will be tighter. It removes guesswork and bases your risk on the market's current behavior.
Respecting Market Structure
Another robust method for trading risk control is placing your stop based on market structure. This means identifying key technical levels on the chart and placing your stop on the other side of them.
- For long positions: Find a clear support level—like a previous swing low, a key moving average, or a horizontal price zone—and set your stop slightly below it. If the price breaks that support, your trade thesis is likely wrong.
- For short positions: Do the opposite. Look for a clear resistance level—such as a prior swing high or a descending trendline—and place your stop just above it. A break of that resistance signals that the bears have lost control.
The logic here is sound: you are forcing the market to break a significant structural level to prove your trade idea wrong. This is a far more defensible approach than using a random percentage or fixed dollar amount. For a deeper look, check out our practical guide on how to set stop-losses for more examples.
Implementing Time-Based Stops
Not all stops need to be based on price. For certain strategies, especially short-term ones like day trading, a time-based stop can be incredibly effective. This is a rule that says, "If this trade isn't profitable by a certain time, I'm out."
Imagine you enter a trade based on a morning breakout pattern. Your strategy anticipates a quick, sharp move in your favor. If an hour passes and the price has just been chopping sideways, the initial momentum catalyst has clearly faded.
A time-based stop acknowledges that your capital has an opportunity cost. If a trade isn't performing as expected within a reasonable timeframe, it's often better to exit—even at a small loss or breakeven—and redeploy that capital to a better opportunity.
This approach requires discipline but is essential for strategies that rely on momentum. Without a time stop, you risk tying up capital in a dead trade that slowly bleeds your account.
Automating Your Stop-Loss Monitoring
Staring at your screen all day waiting for a stop-loss level to be hit is stressful and inefficient. This is where automation becomes a game-changer for your trading risk control.
Using a tool like the ChartsWatcher alert system lets you set precise price-level notifications. Instead of constantly watching the chart, you can set an alert just above your stop-loss price.
If the price approaches your invalidation point, you get an instant notification via email or a pop-up. This allows you to reassess the trade calmly without being glued to the screen. It frees up your mental energy to focus on finding new opportunities rather than micromanaging existing positions.
Building a Diversified and Resilient Portfolio
Getting your trading risk under control goes way beyond just one trade at a time. While sharp position sizing and smart stop-losses are your first line of defense, building a truly resilient portfolio comes down to one thing: diversification.
And no, owning ten different tech stocks isn't it. That's just concentrating your risk in a single basket. Real diversification means spreading your capital across assets that don’t all move in the same direction at once. It's all about managing correlation.

If all your assets are in perfect sync, one bad market shock can send your entire account value tumbling. By blending assets that behave differently, you construct a portfolio that can actually weather the unexpected storms.
It All Comes Down to Correlation
Correlation is just a fancy word for how two assets move in relation to each other. It’s measured on a simple scale from -1 to +1:
- +1 (Perfect Positive Correlation): These assets are joined at the hip. When one goes up, so does the other.
- 0 (No Correlation): The movements are totally random and unrelated. Think stocks vs. fine art prices.
- -1 (Perfect Negative Correlation): They’re complete opposites. When one zigs, the other zags.
The goal here is to combine assets with low or, ideally, negative correlation. This way, a brutal downturn in one corner of your portfolio won't necessarily drag everything else down with it.
Think back to the 2008 financial crisis. Anyone heavily loaded up on equities and real estate got crushed because those assets became highly correlated during the meltdown. But traders who also held gold or government bonds fared much better because those assets acted as safe havens and moved differently.
A diversified portfolio is like a ship with multiple watertight compartments. If one section springs a leak, the others keep the whole vessel afloat. A concentrated portfolio has no compartments—one bad hit sinks everything.
Building Your Multi-Asset Mix
To get this right, you have to think beyond a single market. A well-constructed portfolio is a cocktail of assets from completely different worlds, creating a far more stable foundation.
Asset Classes to Consider for Diversification
- Equities: Stocks from different sectors (tech, healthcare, energy) and geographies (U.S., Europe, emerging markets).
- Commodities: Hard assets like gold, silver, and oil. These often have a low correlation with the broader stock market.
- Fixed Income: Government or corporate bonds can provide a steady anchor when stock markets get choppy.
- Cryptocurrencies: Assets like Bitcoin have historically shown low correlation to traditional markets, though they come with their own brand of high volatility.
- Real Estate: Getting exposure through REITs (Real Estate Investment Trusts) can add another non-correlated layer.
Professionals in market risk management take this to another level with tools like Value at Risk (VaR), stress testing, and scenario analysis. A typical VaR calculation, for example, might tell a trading desk there's a 5% chance their portfolio will lose more than $1 million in a single day. This gives them a hard number to manage against. You can get a deeper dive into how institutions measure and manage market risk to see how the pros do it.
Using Technology for a Bird's-Eye View
Let's be real—trying to manually track correlations and exposure across stocks, crypto, and commodities is a recipe for disaster. It's nearly impossible. This is where a good dashboard becomes your most valuable tool.
Platforms like ChartsWatcher let you pull everything into one unified view. You can set up windows to monitor your stocks, crypto balances, and commodity futures side-by-side. Seeing it all at a glance allows you to spot unintended concentrations before they become a five-alarm fire.
This holistic view is your best defense against "black swan" events—those rare, out-of-the-blue market shocks that can wipe out anyone who isn't prepared. By building a truly diversified portfolio and using the right tools to keep an eye on it, you’re not just managing risk. You're building a financial fortress designed to survive and thrive, no matter what the market throws at you.
Using Backtesting for Data-Driven Risk Decisions
Making risk decisions based on a gut feeling or what the market did yesterday is a rookie mistake and a surefire way to bleed your account dry. To get serious about your trading risk control, you have to stop guessing and start making decisions based on cold, hard data.
This is where backtesting comes in. It’s the process of running your trading strategy against historical price data, and it's an absolutely essential tool in any serious trader's arsenal.
Backtesting isn’t about predicting the future with a crystal ball. It’s about understanding how your strategy behaved in the past. By simulating how your rules would have performed over months or even years of historical data, you uncover its statistical DNA—its strengths, its weaknesses, and most importantly, its breaking points.
This data-driven approach pulls emotion right out of the equation. When you know, for example, that your strategy has historically survived a 20% drawdown, you can set your risk per trade to ensure you survive the next one. That knowledge gives you the confidence to stick with your plan during the inevitable losing streaks, because you have the numbers to prove it works.
Key Metrics to Analyze in Backtesting
When you run a backtest, you’re going to get hit with a flood of data. It's easy to get lost in the noise or just fixate on the total profit number. For real risk management, you need to zoom in on the specific metrics that reveal your strategy's true risk profile.
-
Maximum Drawdown: This is probably the single most critical risk metric. It tells you the largest peak-to-trough drop your account would have suffered. If your strategy's historical max drawdown was 35%, are you really prepared to watch your account value drop by that much? If the answer is no, you have to reduce your risk per trade.
-
Profit Factor: This is simply your total gross profit divided by your total gross loss. A profit factor of 2.0 means that for every $1 of risk, your strategy historically made $2 in profit. Anything below 1.0 means you've got a losing strategy on your hands.
-
Average Win and Average Loss: Knowing these numbers helps you set realistic profit targets and stop-losses. If your average win is $300 and your average loss is $100, you have a powerful positive expectancy and can get by with a lower win rate.
-
Consecutive Losses: This metric tells you the longest losing streak the strategy hit during the backtest. If you see a string of 12 straight losses in the data, it mentally prepares you for when it happens in live trading—and trust me, it will.
Backtesting gives you concrete numbers to build your trading risk control around. For instance, a study of a simple moving average crossover strategy revealed a compound annual growth rate (CAGR) of 8.5%, a maximum drawdown of 15%, and a win/loss ratio of 1.8. These metrics are vital; a low drawdown points to a resilient strategy, while a solid win/loss ratio suggests consistent performance. You can find more insights on leveraging historical data on bookmap.com.
Turning Backtest Data into Actionable Rules
Once you have this historical data, it becomes the bedrock of your live trading plan. It's no longer about what you feel is the right amount of risk; it's about what the data shows your strategy can survive.
Let's walk through a practical example. Imagine you backtest a swing trading strategy on the SPY over the last 10 years, and your results show a maximum drawdown of 25%. That number is your historical pain point. Your job now is to structure your risk so that a similar drawdown in the future doesn't knock you out of the game.
If your personal risk tolerance is only a 20% drawdown, you simply can't trade with the same position size that produced the historical 25% drawdown. You’d need to dial back your position size proportionally to bring that expected drawdown in line with what you can handle.
Your backtest results are your strategy's resume. It tells you exactly how it has behaved under pressure. Ignore that history at your own peril. Use it to set realistic expectations and build a risk framework that can withstand the worst it has ever seen.
The Role of Technology in Effective Backtesting
Let's be honest, manually backtesting a strategy is a soul-crushing task, not to mention it's incredibly prone to human error. Thankfully, modern trading platforms have made this process accessible to everyone.
Tools like the backtesting feature inside ChartsWatcher let you define your entry and exit rules and then unleash them on years of historical data in minutes. This is no longer a luxury; it's an essential capability for any serious trader.
It allows you to quickly test new ideas, fine-tune existing strategies, and—most importantly—gain a deep, data-backed understanding of the risks you're taking with every single trade. Without it, you're just flying blind.
Common Questions About Trading Risk Control
Even with a solid plan, questions always pop up when you start putting risk control into practice. Let’s tackle some of the most common hurdles I see traders face. This isn't theory—it's about direct, actionable answers to help you refine your approach and trade with more confidence.
How Should I Adjust Risk on a Profitable Trade?
Once a trade goes green, your job shifts from managing risk to protecting profit. Until you lock in those gains, it's just paper profit.
A great first move is to slide your stop-loss up to your entry price (breakeven) once the trade has moved a decent amount in your favor. Many traders do this when the position hits a 1:1 risk-to-reward ratio. This simple action takes all the risk off the table. Your worst-case scenario is no longer a loss; it’s just giving back some unrealized gains.
If you’re trying to catch a bigger trend, a trailing stop is your best friend. Instead of staying put, it automatically follows the price as it moves in your favor, locking in more and more profit. You can set it to trail by a fixed percentage or get more sophisticated by basing it on a market volatility indicator like the Average True Range (ATR). This gives the trade room to breathe but still protects your bottom line.
Is the 1 Percent Risk Rule Too Conservative?
This one comes up a lot, especially from traders with smaller accounts. If you’re working with less than $10,000, the 1% rule can feel agonizingly slow. Risking just $50 on a $5,000 account might not feel like you’re making any real progress.
Because of this, some traders bump their risk up to 2% or even 3% per trade to generate more meaningful growth.
But you have to be honest about the trade-off. Doubling your risk from 1% to 2% does more than double the psychological sting of a loss. The real enemy here isn’t the specific percentage; it's "risk creep"—that dangerous habit of making emotional exceptions for trades that feel like a "sure thing."
A consistently applied 2% risk rule is infinitely better than a 1% rule that you abandon whenever you get overconfident. Discipline is the key, regardless of the specific percentage you choose.
The most important thing is to pick a number you can live with and stick to it religiously, through winning streaks and losing streaks.
What Is the Difference Between a Strategy and Risk Control?
This is a critical distinction that trips up a surprising number of traders.
Think of it like planning a cross-country road trip.
-
Your trading strategy is the map. It tells you when to get on the highway (your entry signal) and which direction you're headed. For example, "Buy when the price breaks above the 50-day moving average."
-
Your trading risk control plan is the car's safety system. It dictates how much gas (capital) you'll put in for the trip and sets your emergency exit—the point where you pull over no matter what (your stop-loss).
You can have the best map in the world, but if you drive recklessly without a seatbelt, you’re still heading for a disaster. A brilliant strategy is totally worthless if one bad trade can wipe you out. They are two separate, equally vital parts of a complete trading plan. One tells you where to go; the other makes sure you survive the journey.
Take the guesswork out of your trading and build a professional-grade risk management workflow. With ChartsWatcher, you can create custom dashboards to monitor your entire portfolio, set precise alerts for your stop-loss levels, and backtest your strategies with real data. Stop reacting and start trading with a plan. Start your free trial of ChartsWatcher today.
