A Trader's Guide to the Stock Wedge Pattern
Think of a stock wedge pattern as the market taking a deep breath. It's like a coiled spring, where the battle between buyers and sellers reaches a temporary stalemate. You'll see the price action get squeezed between two converging trendlines, signaling that a big, explosive move is just around the corner.
This pattern is a visual story of momentum fading and pressure building right before the dam breaks.
What Is a Stock Wedge Pattern
At its heart, a wedge pattern tells a story through price action. It shows a period of consolidation where volatility dries up and the trading range gets tighter and tighter. Imagine a tug-of-war where both teams are getting tired; the rope barely moves, but you can feel the tension mounting until one side finally gives out, leading to a sudden, powerful yank.
That tightening you see on the chart is formed by two trendlines that are both heading in the same direction—either both pointing up or both pointing down. Crucially, they're angled differently, guaranteeing they'll eventually cross. This convergence is what separates a wedge from other patterns like triangles or channels.
The Psychology Behind the Squeeze
The formation of a wedge reveals a fascinating psychological battle in the market. As the pattern takes shape, you'll almost always see trading volume start to dry up. This drop in volume is a massive clue—it suggests that both buyers and sellers are losing conviction as the price gets backed into a corner.
But this period of indecision can't go on forever. Those converging trendlines act like a pressure cooker, storing up potential energy for the next big move. Sooner or later, the price is forced to break out of this consolidation. That breakout is often explosive and comes with a huge spike in volume, confirming that a new trend has started or an old one is ready to resume.
The wedge pattern is essentially a roadmap of market exhaustion. It shows the point where a prevailing trend is running out of steam, creating a pause that often resolves in the opposite direction.
The Two Primary Types of Wedges
To really get a handle on the stock wedge pattern, you need to know its two distinct forms. Each has its own personality and typically leads to a different outcome. Getting these down is fundamental to trading this setup.
- The Rising Wedge: This pattern is formed by a series of higher highs and even higher lows, creating two trendlines that both slant upward. It looks bullish on the surface, but don't be fooled. A rising wedge is considered a bearish pattern. It’s a classic sign that buying pressure is fizzling out and a downward reversal is probably on the menu.
- The Falling Wedge: On the flip side, this pattern shows up as a series of lower lows and lower highs, resulting in two downward-slanting trendlines. The falling wedge is a bullish pattern, hinting that sellers are losing their grip and an upward breakout is on the horizon.
By learning to spot these two formations, you can start anticipating major price moves before they happen, giving you a serious edge in your technical analysis.
Rising Wedges vs Falling Wedges
While they might look like cousins, rising and falling wedges are more like polar opposites. Both patterns show price getting squeezed between two converging trendlines, but they tell completely different stories about what’s happening under the market’s hood.
Think of them as two distinct characters in a play. One signals that a rally is getting tired and ready to collapse, while the other suggests that sellers are finally running out of gas at the bottom. Getting to know the unique personality of each stock wedge pattern is the key to not getting faked out by the next big move.
The Rising Wedge: A Bear in Bull's Clothing
The rising wedge is a classic bearish reversal pattern, and it’s a sneaky one. At first glance, it looks bullish—the price is making higher highs and higher lows, after all. But the devil is in the details, specifically the slope of the trendlines. The lower trendline (support) is steeper than the upper one (resistance), creating a pattern that angles up while getting tighter and tighter.
This structure paints a clear picture: buyers are still pushing, but they're losing momentum. Each new high is a struggle, and the gains are getting smaller. It’s like a mountain climber getting closer to the summit, but their steps are becoming shorter and more labored as exhaustion sets in. This waning momentum, often confirmed by declining volume, is a huge red flag that the uptrend is built on a shaky foundation.
We cover this formation in much more detail in our guide on trading the rising wedge pattern for maximum profit.
A rising wedge is a warning shot. Despite the upward grind, the buying pressure underneath is fading. The narrowing range tells you a resolution is coming, and more often than not, it’s a sharp break to the downside.
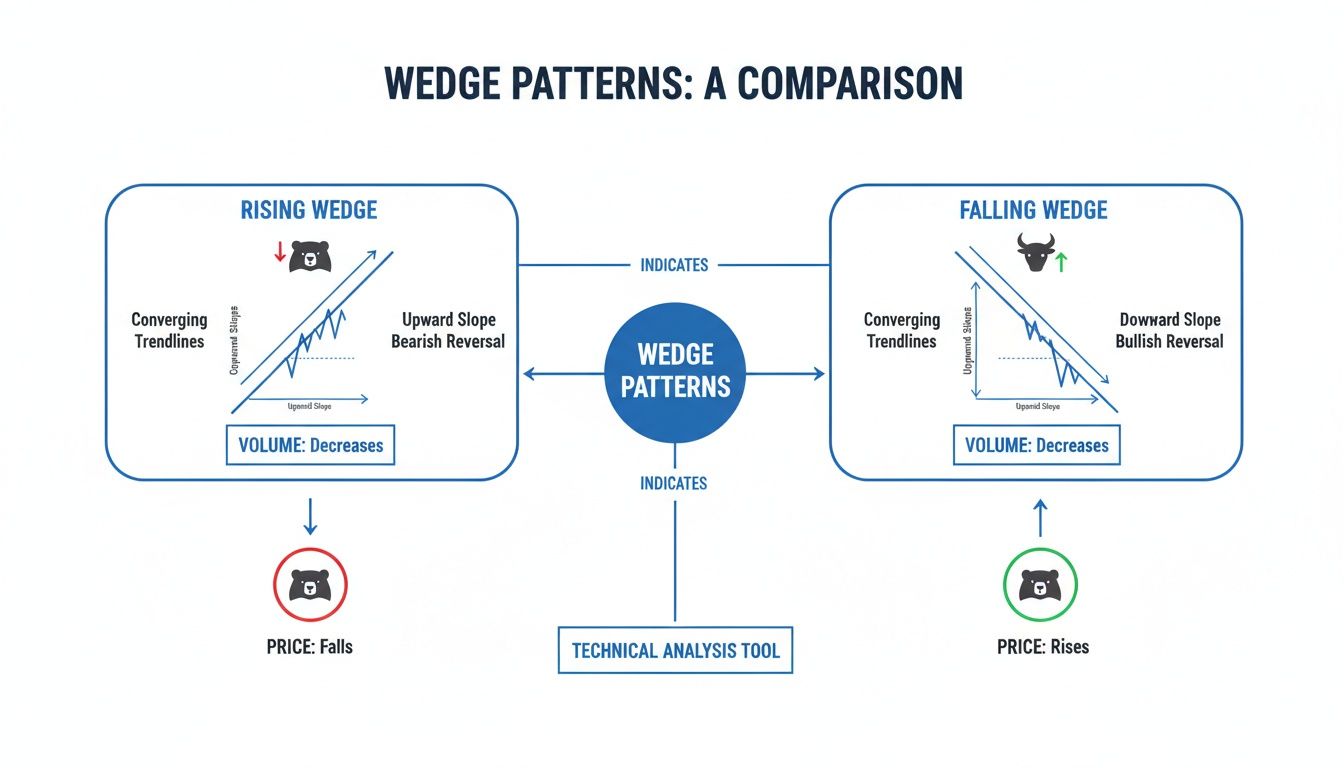
This visual shows the anatomy of both patterns, highlighting their distinct slopes and the most common breakout directions.
You can see how the rising wedge squeezes upwards before it typically breaks down, while the falling wedge coils downwards before springing higher.
Rising Wedge vs Falling Wedge Key Differences
To quickly tell these two powerful patterns apart, it helps to see their core characteristics side-by-side. This table breaks down what defines each formation, so you can spot them on a chart and know exactly what story the market is telling you.
| Characteristic | Rising Wedge | Falling Wedge |
|---|---|---|
| Typical Formation | After an uptrend | After a downtrend |
| Price Action | Higher highs and higher lows | Lower highs and lower lows |
| Trendline Slope | Both trendlines slope up | Both trendlines slope down |
| Defining Feature | Support line is steeper than resistance | Resistance line is steeper than support |
| Market Sentiment | Waning buying momentum | Waning selling pressure |
| Typical Breakout | Bearish (downside) | Bullish (upside) |
| Pattern Type | Bearish Reversal | Bullish Reversal |
Understanding these distinctions is crucial. One pattern is a sign of exhaustion at the top, while the other signals a potential bottom is forming. Mistaking one for the other can be a costly trading error.
The Falling Wedge: A Bull Waiting to Charge
The falling wedge is the complete opposite of its bearish counterpart and is a powerful bullish reversal pattern. It shows up when a stock is making lower lows and lower highs, with both trendlines pointing down. The critical difference is that here, the upper trendline (resistance) is steeper than the lower one (support).
This pattern tells a story of sellers losing their grip. They are still in control, but each new push lower is weaker than the last. The selling pressure is drying up. As the sellers get tired, opportunistic buyers begin to step in and quietly accumulate shares, sensing a bargain.
This slow transfer of power from sellers to buyers builds tension. Eventually, that tension is released in a breakout above the upper resistance line, often on a surge of volume. This is the market’s way of confirming that the buyers have officially taken over and a new uptrend is likely getting started.
Real-World Example: The VFH Rising Wedge
History is filled with textbook examples of these patterns playing out. Take the Vanguard Financials ETF (VFH) in late 2022 and early 2023. It carved out a perfect rising wedge over five months, grinding higher from $88.83 to $90.87 while the underlying momentum was clearly fizzling out.
This setup was especially potent because rising wedges have a historical 81% success rate for bearish breakouts during bear markets. And true to form, the pattern eventually broke down and plunged to its target near $74.09 just a month later. That was an 18.5% drop that handsomely rewarded traders who recognized the signs of buyer exhaustion.
How to Identify Wedge Patterns Like a Pro
Going from textbook theory to the trading floor, spotting a high-probability stock wedge pattern takes more than just seeing two lines get closer together. Experienced traders hunt for a specific set of clues that validate the pattern. It's a lot like being a detective; you need to gather enough evidence before you can build a solid case.
Think of it like this: anyone can look at the sky and see a cloud, but a meteorologist sees pressure systems, temperature gradients, and moisture levels that tell a much deeper story. We're going to help you develop that same level of insight for reading charts. There are four critical confirmation factors you need to nail down: the converging trendlines, the volume signature, the pattern's duration, and the steepness of its slope.
Drawing the Converging Trendlines
First things first, you have to get the basics right: drawing the two trendlines that form the wedge. These lines are the skeleton of the pattern. If you get them wrong, the whole analysis falls apart.
To start, you need to identify at least two reaction highs and two reaction lows. For a falling wedge, you'll connect the series of lower highs and lower lows. For a rising wedge, you'll connect the series of higher highs and higher lows.
- Resistance Line: This connects at least two swing highs. In a falling wedge, this top line will have a steeper downward angle than the bottom line.
- Support Line: This connects at least two swing lows. In a rising wedge, this bottom line will have a steeper upward angle than the top line.
The crucial detail here is that both lines must be moving in the same general direction—either both are angled up, or both are angled down. If one is rising and the other is falling, you're looking at a different beast entirely, most likely a triangle pattern.
This chart gives a great side-by-side breakdown of both patterns, making it easy to see their distinct shapes and what they typically lead to.
As you can see, the rising wedge coils upward before a likely bearish break, while the falling wedge grinds downward before a potential bullish rally.
Volume: The Ultimate Truth Serum
If the trendlines are the skeleton, then volume is the pattern's heartbeat. It is, without a doubt, the most important confirmation signal you have—think of it as a lie detector for price action. A textbook wedge pattern should almost always show diminishing volume as the price action squeezes toward the apex.
This drying up of volume is absolutely critical. It tells you that the side currently in control (sellers in a falling wedge, buyers in a rising wedge) is losing steam. Conviction is fading, indecision is creeping in, and pressure is building under the surface.
A breakout on low volume is a massive red flag. A legitimate, powerful breakout should explode with a significant spike in volume. This confirms that conviction has returned and the market is throwing its weight behind the new direction.
It's like the roar of a crowd at a sports game. As the pattern forms, the crowd gets quieter and quieter. The breakout should be met with a sudden, deafening roar, confirming the move is for real.
Pattern Duration and Slope Steepness
Finally, you need to consider the pattern’s timeline and its overall shape. The duration and slope add important context and can seriously impact how reliable the signal is.
- Duration: Wedges can form on any timeframe, from 5-minute charts to weekly charts. As a general rule, patterns that take longer to form—several weeks or months—tend to lead to much bigger and more reliable price moves. A wedge that forms in just a few hours is far more vulnerable to getting washed out by random market noise.
- Slope: The angle of the wedge also tells a story. A very steep, tightly-wound wedge often hints at a more explosive breakout. On the other hand, a shallow, lazy-looking wedge might fizzle out or result in a less dramatic move. The steepness often reflects just how intense the battle between buyers and sellers really is.
By combining these four elements—accurate trendlines, declining volume, proper duration, and a clear slope—you stop just seeing a pattern. You start to understand the story the market is telling, which lets you identify high-probability trading setups with a whole lot more confidence.
Building a Winning Wedge Pattern Trading Strategy
Spotting a wedge pattern on a chart is like an X on a treasure map. It shows you where the gold might be, but it’s useless without a plan to actually get there. A solid trading strategy isn't just about seeing the pattern; it's about having a non-negotiable set of rules for how you'll get in, how you'll protect yourself, and when you'll take your profits.
This is what separates professional trading from a guessing game. Let's build a complete plan around the three pillars of any successful trade: the entry, the stop-loss, and the profit target. Without these, you're just gambling.
Pinpointing Your Entry Trigger
The moment a stock breaks out of a wedge is where all the action is. It's the point of maximum opportunity, but also a moment of serious risk. Your entry trigger is the specific event that tells you, "Okay, it's time to get in." Traders typically lean on one of two approaches here.
The first is the aggressive entry. You jump into the trade the second the price pushes through the pattern's trendline. For a falling wedge, that means hitting the buy button the instant the price pierces the upper resistance line. This can get you the best possible price if the breakout is the real deal and takes off like a rocket.
The downside? You run a much higher risk of getting caught in a "false breakout"—a nasty head-fake where the price pokes through the line only to get stuffed right back inside the pattern. It can turn a great-looking setup into a quick loss.
The second option is the conservative entry. Here, you patiently wait for the breakout candle to close outside the pattern. This simple act of waiting provides powerful confirmation that there's real conviction behind the move, dramatically cutting your odds of being faked out. Sure, you might get in at a slightly higher price, but your trade now has a much higher probability of working out.
Setting a Protective Stop-Loss
No strategy is worth a dime without an ironclad exit plan for when things go south. Your stop-loss is your safety net, the one thing that protects your trading account from a catastrophic hit. For wedge patterns, thankfully, placing it is pretty logical.
The rule is simple: place your stop-loss just outside the pattern on the opposite side of the breakout.
- For a falling wedge (bullish breakout): Set your stop just below the lower support trendline. Another good spot is just under the most recent swing low made inside the wedge.
- For a rising wedge (bearish breakout): Set your stop just above the upper resistance trendline, or a tick above the most recent swing high within the pattern.
This placement makes perfect sense. If the price reverses and breaks back inside the pattern, your trade idea is clearly wrong. Your stop-loss gets you out with a small, manageable loss, and you live to trade another day. Never, ever trade a wedge without one.
Defining Your Profit Targets
Knowing when to take your money and run is just as crucial as knowing when to get in. Too many traders watch a winning trade turn into a loser because they got greedy. The wedge pattern gives us a beautifully simple, built-in method for setting a logical price target.
The most common technique is called the measurement method. All you do is measure the height of the wedge at its widest point—from the very first swing high down to the first swing low that formed the pattern.
Once you have that value, you project it from your breakout point.
- Measure the Height: Calculate the price difference between the highest peak and the lowest trough at the start of the wedge.
- Project from the Breakout: Take that height and add it to the price where the stock broke out. This gives you a clear, objective price target.
For example, say a falling wedge starts with a high of $110 and a low of $100. Its height is $10. If the stock breaks out of the pattern at $105, your first profit target would be $115 ($105 + $10). This gives you a data-driven exit plan, so you can lock in profits systematically instead of emotionally.
Real-World Examples of Successful Wedge Trades
Rules and theory are a great start, but there’s no substitute for seeing a stock wedge pattern play out on a live chart. This is where the lessons really sink in. By breaking down historical trades, we can move from abstract ideas to concrete, actionable insights. Watching these patterns unfold on widely-followed stocks lets us see the principles of volume, breakouts, and profit targets in action.
Think of these examples as mini case studies. They provide a practical blueprint for what a high-probability setup actually looks like in the wild. Let’s walk through a couple of classic wedge formations that telegraphed major market moves.
The S&P 500 Falling Wedge Reversal
Major indices like the S&P 500 are perfect for studying chart patterns because they reflect the collective psychology of millions of traders. A powerful example popped up when the index formed a textbook falling wedge after a nasty corrective downturn. The price action carved out a clear series of lower highs and lower lows, but you could see the selling pressure getting weaker with each new bottom.
The two downward-sloping trendlines started to converge, squeezing the price into an increasingly tight range. And here's the critical clue: trading volume dried up throughout the pattern's formation, signaling that the sellers were running out of steam.
When the breakout finally came, it was explosive.
- The Signal: The index decisively broke above the upper resistance trendline.
- The Confirmation: That breakout candle was powered by a massive surge in volume, confirming that buyers had forcefully taken control.
- The Result: This breakout didn't just end the correction; it kicked off a powerful new uptrend that ran for months.
This trade is a perfect illustration of how a falling wedge can act as a major bottoming signal, offering a prime opportunity to get in at the very beginning of a new bull leg.
Statistical Strength of the Falling Wedge
That S&P 500 example wasn’t just a lucky one-off; it’s backed by some serious historical data. Let's say you're scanning with ChartsWatcher and spot a falling wedge on the S&P 500—you're not just looking at a pattern, you're looking at a statistical powerhouse. Multi-year studies show that falling wedges boast a 74% success rate for bullish breakouts in bull markets, turning a scary-looking downtrend into a fantastic reversal opportunity. Even better, historical data shows an 82% bullish exit rate overall. Price targets are hit 63% to 88% of the time, meaning traders who nail these setups often see the full projected move play out. You can dig into more stats and master profitable trading strategies on ChartsWatcher.com.
Analyzing a Rising Wedge Breakdown in Tech
Now, let's flip the script. A popular, high-flying tech stock recently topped out after a multi-month uptrend by forming a large rising wedge. The stock kept grinding higher, but the gains were getting smaller and felt labored. You could see that the lower support trendline was much steeper than the upper resistance line—a dead giveaway that while the price was rising, the underlying momentum was fading fast.
Just like with the falling wedge, volume was the key. As the stock pushed toward the wedge's apex, volume steadily declined, showing a real lack of conviction from buyers at those lofty prices.
The breakdown from a rising wedge is often swift and unforgiving. The pattern acts like a trap for complacent bulls who ignore the warning signs of waning momentum.
When the price finally snapped below the lower support trendline, the drop was immediate and sharp. Traders who went short based on the pattern were rewarded as the price plummeted back toward the level where the wedge began, hitting the measured-move profit target perfectly. This is a classic case of how a stock wedge pattern can warn you of an impending reversal long before the rest of the market catches on.
Finding Wedge Patterns Automatically with a Screener
Let's be honest: manually flipping through hundreds of charts looking for the perfect stock wedge pattern is a recipe for eye strain and missed opportunities. The market moves fast. By the time you spot a promising setup, that perfect entry point might already be in the rearview mirror.
This is where a good stock screener changes the game entirely. Instead of hunting for a needle in a haystack, you're telling a powerful tool exactly what to look for, turning a frustrating task into an efficient, targeted process. It lets you focus your energy on analyzing high-probability setups instead of just searching for them.
Why You Should Automate Your Scans
Trying to find a specific pattern by hand is like wandering through a massive library without a catalog. A screener acts as your digital librarian, instantly bringing you every chart that meets your exact criteria.
Here’s how it transforms your workflow:
- Speed: It scans the entire market in seconds. A human trader would need hours, if not days, to do the same.
- Objectivity: A screener is purely logical. It follows your rules without emotion or bias, getting rid of the temptation to "see" a pattern that isn't really there.
- Consistency: It applies your criteria the same way to every single stock, making sure no potential trade slips through the cracks.
By automating the discovery process, you free up a huge amount of time and mental energy. This lets you zero in on what really matters—executing your strategy. For a deeper dive into crafting effective scans, check out our guide on the breakout stock screener.
Setting Up Your Wedge Pattern Scan in ChartsWatcher
Building a wedge pattern scan in a tool like ChartsWatcher is pretty intuitive. All you're doing is translating the visual characteristics of a wedge into a set of rules the software can understand. The goal is simple: find stocks showing price compression between two converging trendlines, ideally on declining volume.
Your scan should filter for these core conditions:
- Price Consolidation: You want stocks where the trading range has been tightening over a specific period, like the last 20 to 50 candles.
- Converging Trendlines: This means looking for a series of lower highs and higher lows (for a falling wedge) or higher highs and lower lows (for a rising wedge).
- Decreasing Volume: Add a condition to filter for stocks where trading volume has been drying up during the consolidation. A common filter is checking if the 20-day average volume is trending lower than the 50-day average.
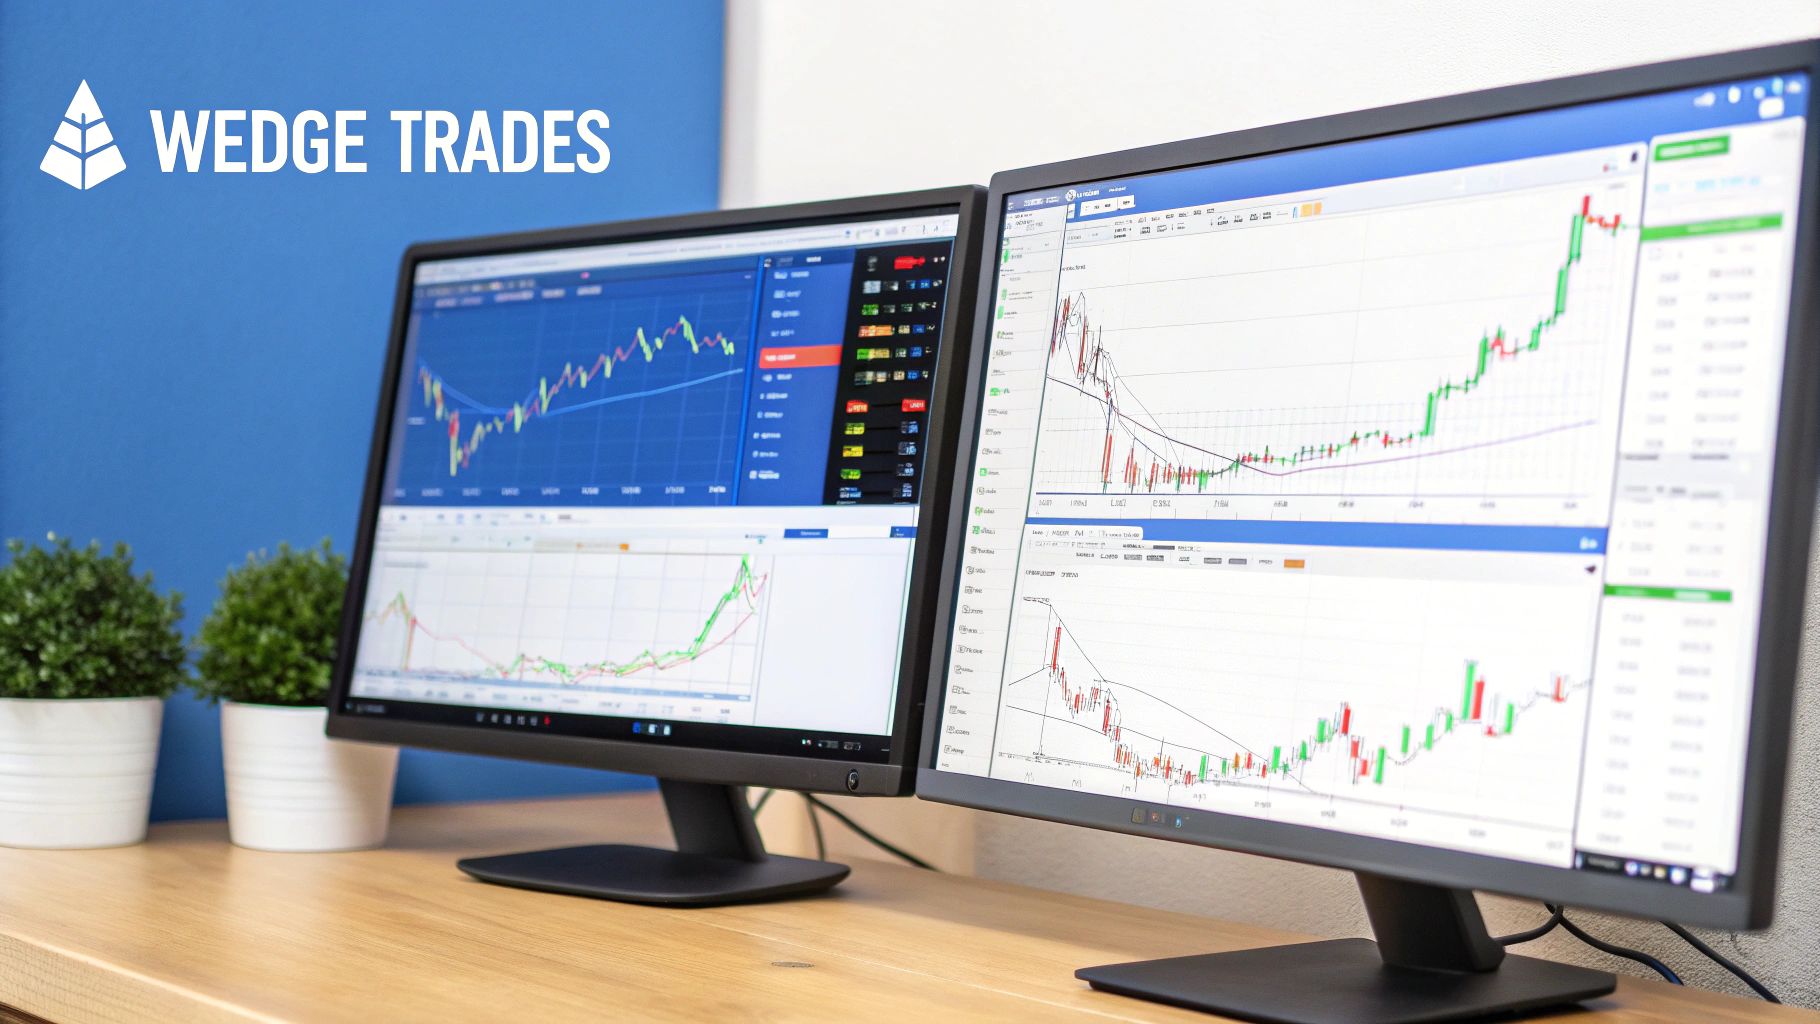
The screenshot below shows how you can layer different filters and alerts in the ChartsWatcher platform to build a powerful, custom scanning environment.
This kind of setup lets you monitor multiple conditions at once, so you get pinged the moment a stock meets all your criteria for a potential wedge breakout.
Activating Real-Time Breakout Alerts
Finding a wedge as it forms is only half the battle. The real money is made by acting the moment a breakout happens, and that's where real-time alerts become your best friend.
In ChartsWatcher, you can set an alert to notify you instantly when a stock's price punches through the upper trendline of a falling wedge or drops below the lower trendline of a rising wedge. You can even add a volume condition, so the alert only triggers if the breakout happens on a significant spike in trading activity.
This combo of automated scanning and real-time alerts closes the gap between analysis and action. It ensures you're always ready to jump on a high-probability stock wedge pattern trade without having to be glued to your screen all day.
Got Questions About Wedges? We’ve Got Answers.
Even after you’ve got the basics down, a few questions always seem to pop up when trading wedges. It's totally normal. Let's clear up some of the most common points of confusion so you can trade these patterns with more confidence.
What's the Real Difference Between a Wedge and a Triangle?
This is a big one, and it all comes down to the direction of the trendlines. In a wedge pattern, both the support and resistance lines are slanting in the same direction. For a rising wedge, both lines point up. For a falling wedge, both point down. It’s this shared slant that gives the pattern its name and hints at a big reversal.
Triangles, on the other hand, have trendlines working against each other or staying neutral.
- Symmetrical Triangles: One trendline goes up, the other goes down, squeezing the price towards a point.
- Ascending/Descending Triangles: One trendline is flat (horizontal), while the other slopes towards it.
This might seem like a small detail, but it’s everything. The uniform tilt of a wedge shows a slow, grinding loss of momentum that often snaps back in a powerful reversal.
While both patterns show price consolidation, think of it like this: a wedge is a sign of a tired trend getting ready to reverse. Triangles are more like a pause before the trend continues.
Just How Reliable is the Stock Wedge Pattern?
Wedges are highly reliable, but—and this is a big but—they live and die by confirmation. While some studies suggest success rates can climb above 70%, you can't trade on that number alone. The single most important confirmation signal you need to see is volume. A breakout that rips higher on a massive spike in trading volume has a much, much better chance of being the real deal.
A breakout on weak, pathetic volume? That's a huge red flag. It’s often a trap—a "false breakout" waiting to reverse and stop you out. Context is also key. A beautiful bullish falling wedge that forms during a raging bull market is a far safer bet than one trying to fight a nasty market-wide downtrend.
What Do I Do If a Wedge Pattern Fails on Me?
Look, every chart pattern known to man can and will fail sometimes. This is exactly why risk management isn't just part of the strategy; it is the most important part. A failure is when the price breaks out the wrong way (like a bullish breakout from a rising wedge, which is supposed to be bearish).
This is why you must have a stop-loss set before you ever enter the trade. No exceptions. If that stop-loss gets hit, the setup is dead. The only right move is to exit the trade immediately and protect your capital. Take the small, planned loss and move on. There will always be another trade.
Tired of hunting for patterns by hand? Let technology do the heavy lifting. ChartsWatcher uses powerful, automated scanning to find high-probability wedge patterns and sends you real-time alerts the second they form. Start your free trial and find your next trade today at https://chartswatcher.com.
