A Trader's Guide to the Inverted Head and Shoulders Pattern
The inverted head and shoulders pattern is a classic chart formation that every technical trader should know. Put simply, it’s a heads-up that a downtrend might be running out of gas and an uptrend is getting ready to take over. This makes it a go-to pattern for traders trying to get in near a market bottom.
Unpacking the Story of a Market Reversal
Think of a downtrend as a brutal tug-of-war where sellers are yanking the price lower and lower. The inverted head and shoulders pattern is the story of the moment buyers finally dig in their heels, start fighting back, and ultimately overpower the sellers. It’s like watching the market’s mood swing from fear to confidence, giving you a clue that the bears are exhausted.
This pattern is widely considered one of the most reliable bullish reversal signals out there. While no pattern is foolproof, some studies suggest its success rate can be surprisingly high when the right conditions are met. Understanding its structure can give you a real edge, helping you spot potential market bottoms before the rest of the crowd catches on.

The Core Components of the Pattern
To really get this pattern, you need to know its distinct parts. Each one tells a piece of the story about the shifting balance of power in the market. We'll get into the weeds later, but here’s a quick rundown of what to look for on a chart:
- The Left Shoulder: This is the first real pushback from buyers after a prolonged downtrend. It creates a temporary low before a small rally.
- The Head: Sellers give it one last, powerful shove, pushing the price to a new, lower low. The problem for them? Their momentum is starting to fade.
- The Right Shoulder: Buyers come back with renewed strength. They stop the price from falling as low as the head, forming a higher low that often mirrors the left shoulder.
- The Neckline: This is the most important part. It’s a line connecting the peaks of the small rallies between the shoulders and the head. A clean break above this line is the confirmation signal—the reversal is officially on.
When you learn to spot these pieces, you’re doing more than just looking at lines on a chart. You're reading the market’s psychology. It’s a powerful narrative of exhaustion giving way to renewal.
Getting good at trading the inverted head and shoulders is about more than just finding it; it’s about building a solid, repeatable trading plan around its signals. This guide will walk you through how to spot it, trade it, and sidestep common mistakes. For an even deeper dive, check out our guide to master the inverted head and shoulder pattern. We'll give you everything you need to use this formation with confidence.
Decoding the Anatomy of the Pattern
To successfully trade the inverted head and shoulders pattern, you can't just see it as a shape on a chart. You have to understand it as a story about market psychology. Each component represents a chapter in the struggle between buyers and sellers, which ends in a powerful shift from bearish despair to bullish optimism. Learning to read this story is the key to spotting high-quality setups.
This pattern is built from five distinct elements. When they show up in the right sequence, they paint a clear picture of a potential market bottom. Let's break down each part to see the role it plays.
The Prior Downtrend: The Necessary Context
First things first: an inverted head and shoulders pattern must appear after a clear and established downtrend. Think of this as the non-negotiable prerequisite. Without a preceding downtrend, the pattern has no bearish momentum to reverse, making it totally meaningless.
This context is everything. The downtrend shows that sellers have been firmly in control, consistently pushing prices lower. The fact that this pattern forms within that trend is what gives its bullish signal so much weight.
The Left Shoulder: The First Pushback
As the downtrend grinds on, the price hits a new low and then bounces. This initial trough and the small rally that follows form the left shoulder. It’s the first real sign that buyers are starting to wake up and show some interest.
While sellers are still calling the shots at this point, the left shoulder represents the first crack in their armor. It's a signal that the relentless selling pressure is finally meeting some resistance, even if it’s just temporary. This is our first clue that the bearish story might be about to change.
The Head: Maximum Seller Exhaustion
After the small rally from the left shoulder, sellers make one final, aggressive push. They manage to drive the price to a significant new low, a point well below the left shoulder. This lowest point in the formation is the head.
This is the moment of maximum bearish exhaustion. Sellers throw everything they have at the market, but the new low just doesn't attract much follow-through selling. The rally that bounces off this low is often stronger than the one from the left shoulder, telling us that buyer conviction is growing.
The Right Shoulder: Buyers Show Their Strength
Following the rally from the head, sellers try to push the price down again. But this time, they fail to even get close to the low of the head. This higher low forms the right shoulder, and its bottom often lines up with the price level of the left shoulder.
This is a critical moment in the battle. The sellers' inability to make a new low shows their power is fading fast. Buyers step in with more confidence, preventing a deeper slide and showing that the balance of power is decisively shifting their way.
The Neckline: The Line in the Sand
The final and most critical component is the neckline. This is simply a resistance line drawn by connecting the peaks of the rallies that happened after the left shoulder and the head. The neckline can be horizontal, or it might slope slightly up or down.
The neckline represents the ultimate barrier that buyers must smash through to confirm the reversal. Think of it as the ceiling that has been holding the price down. A clean breakout above this level is the definitive signal that the downtrend is over and a new uptrend is likely beginning.
This picture shows how all five elements come together to create the full pattern.
:max_bytes(150000):strip_icc()/dotdash_Final_Inverse_Head_and_Shoulders_Jan_2021-01-a689f411649e4a3eb381284f23b246a1.jpg)
The image clearly illustrates the sequence: a prior downtrend is followed by the left shoulder, the lower head, the higher-low of the right shoulder, and the crucial neckline connecting the peaks in between.
Volume: The Ultimate Confirmation Signal
While the price structure is vital, trading volume provides the final piece of the puzzle. Volume tells the story of conviction behind the price moves. For a classic inverted head and shoulders, volume typically plays out like this:
- Left Shoulder: Volume is often high as sellers are still aggressively pushing the price down.
- Head: Volume might decrease on the decline to the head, showing less enthusiasm from the sellers.
- Right Shoulder: Volume is usually lower than on the left shoulder, indicating that sellers are running out of steam.
- Neckline Breakout: This is the most important volume signal of all. A valid breakout should happen on a significant surge in volume, confirming that buyers are rushing in with force.
Historical analysis shows this pattern often appears after long downtrends and signals that bearish momentum is on its last legs. Detailed studies show the pattern has about an 89% success rate in predicting reversals when standard criteria are met, including a decisive, high-volume breakout of the neckline. You can dig deeper into these findings in research about the head and shoulders strategy.
How to Build a Trade Around the Neckline Breakout
Spotting the inverted head and shoulders pattern is a great start, but turning that picture on a chart into a profitable trade? That requires a clear, repeatable plan. This is where theory meets action. Building a solid trading strategy around the neckline breakout involves more than just hitting the "buy" button when things look good. It requires a systematic approach to your entry, risk management, and perhaps most importantly, your exit.
Let's walk through the mechanics, step-by-step, to build a playbook for trading this powerful bullish signal. We'll cover everything from the exact moment to enter to the logical point to take your profits off the table.
This image gives a clean visualization of the first step: correctly identifying the three-trough formation before you even think about placing an order.
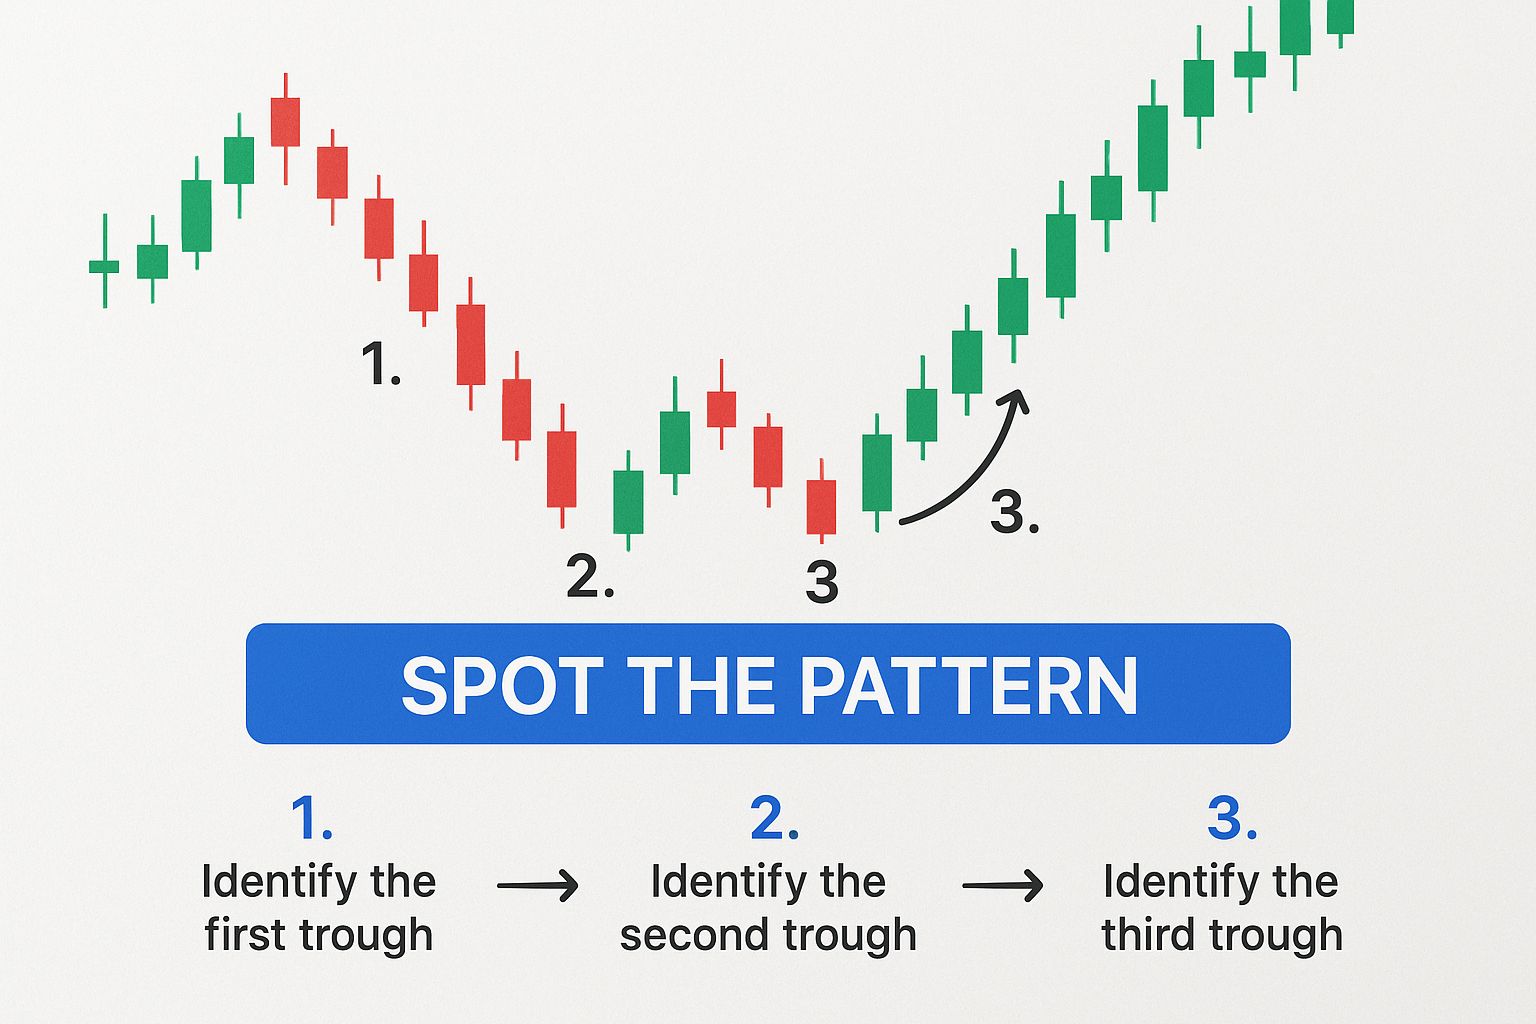
The image highlights the core structure—two shoulders and a lower head—which is the foundation of any trade built on this pattern.
Pinpointing Your Entry
Once the right shoulder is in place and the price starts pushing up against the neckline, you have a critical decision to make. There are two main schools of thought here, and the one you choose will say a lot about your trading style and risk tolerance.
There’s no single “right” answer, but understanding the pros and cons of each is key.
Entry Strategy Comparison: Breakout vs. Pullback
When it comes to pulling the trigger, traders typically choose between jumping in right away or waiting for a second chance. Here's a quick breakdown of the two primary entry methods.
| Strategy | Pros | Cons | Best For |
|---|---|---|---|
| Breakout Entry (Aggressive) | Gets you in early to catch the initial momentum. Less chance of missing the move if it takes off quickly. | Higher risk of "false breakouts" where the price reverses back below the neckline. | Traders with a higher risk tolerance who prioritize not missing a potential big move. |
| Pullback Entry (Conservative) | Confirms the neckline has turned into a support level. Often provides a better risk/reward entry point. Filters out many false moves. | You might miss the trade entirely if the price never pulls back to retest the neckline. | Patient traders who prefer higher-probability setups and want to avoid getting caught in "head fakes." |
Ultimately, choosing between an aggressive breakout entry and a more conservative pullback entry depends on what you're willing to risk: the risk of being wrong (false breakout) versus the risk of missing out (no pullback).
Demanding Volume Confirmation
No matter which entry you prefer, one element is non-negotiable: volume confirmation. A real, legitimate breakout should always happen on a significant surge in trading volume. Think of volume as the fuel for the rocket. No fuel, no liftoff.
A breakout on weak, uninspired volume is a massive red flag. It suggests there's no real conviction from buyers, and the move is likely a trap set by the market. On the other hand, a big spike in volume shows that institutions and a wave of other traders are piling in, giving the pattern some serious validation.
Setting Your Stop-Loss for Protection
Every single trade needs a fire escape. Your stop-loss order is that escape hatch, defining the exact point where you admit the trade isn't working and get out to protect your capital.
For the inverted head and shoulders, the most logical place to set your stop-loss is just below the low of the right shoulder.
Placing it here gives the trade enough room to breathe and absorb normal market noise. If the price does fall below the right shoulder's low, it completely invalidates the bullish structure of the pattern. That's your signal to exit and live to trade another day.
Calculating Your Profit Target
The classic measurement technique for this pattern gives us a wonderfully objective way to set a profit target. It takes the emotion and guesswork out of your exit strategy.
Here’s the simple two-step process:
- Measure the Depth: Calculate the vertical distance from the lowest point of the head straight up to the neckline.
- Project the Target: Take that exact same distance and project it upward from the point where the price broke out from the neckline.
This projected level is your minimum price target. The logic here is that the force of the reversal should be at least equal to the depth of the selling climax that formed the head. Historical data shows this method has merit; the average price advance after a neckline breakout is around 45%. That's a significant potential gain that makes this pattern a favorite. For more on this, check out some great insights on the head and shoulders trading strategy.
Reading the Variations in Pattern Formation
The market is a messy place, and it rarely paints patterns with textbook perfection. The inverted head and shoulders is no exception. While the classic version is clean and easy to spot, real-world charts are full of subtle variations. Learning to read these imperfections is what separates novice traders from seasoned pros, because they offer deeper clues about the strength of a potential reversal.
Thinking of every pattern as a rigid, identical formation is a fast track to missed opportunities and failed trades. You need a more flexible, context-aware approach. The small deviations in a pattern’s structure—like a sloping neckline or uneven shoulders—aren't flaws. They're valuable pieces of information telling a more nuanced story about the battle between buyers and sellers.
Interpreting Sloping Necklines
One of the most common variations you'll run into is a non-horizontal neckline. The angle of this critical resistance line gives you powerful insight into the urgency behind the bullish shift.
-
Upward-Sloping Neckline: This is a sign of serious bullish impatience. It shows that buyers are so eager to take control that they aren't even waiting for the price to return to the previous peak before jumping in. This kind of aggressive buying pressure often signals a more powerful and immediate breakout.
-
Downward-Sloping Neckline: This one calls for a bit more caution. A neckline that slopes down indicates that sellers still have some influence, as each rally fails to reach the height of the previous one. While it's still a valid pattern, the breakout might be less explosive, and the risk of a false move is slightly higher.
Interestingly, some analysis suggests that certain variations can deliver surprisingly strong performance. For instance, an inverted head and shoulders with a downward-sloping neckline and a left shoulder higher than the right can actually lead to stronger bullish outcomes. This just goes to show why traders almost always combine pattern analysis with other tools to validate a signal. You can check out more insights on head and shoulders success rates on TradingView.
Decoding Asymmetrical Shoulders
Just as the neckline can vary, the shoulders are rarely perfect mirror images of each other. The relationship between the height of the left and right shoulders tells you a lot about the evolving strength of the buyers.
A higher right shoulder is a powerful confirmation of growing bullish strength. It demonstrates that buyers stepped in much earlier and with more force, preventing sellers from pushing the price anywhere near the low of the left shoulder.
On the other hand, if the right shoulder forms at a lower price point than the left, it can be a red flag. This might suggest that buying pressure isn't as robust as it should be, and the potential reversal lacks conviction. It's not an immediate dealbreaker, but a lower right shoulder should prompt you to look for exceptionally strong volume on the breakout as confirmation.
Assessing Complex Formations
Every now and then, the market throws a real curveball by forming a complex inverted head and shoulders pattern. These might feature multiple shoulders on one or both sides, or even a double head.
When you see a complex pattern, don't panic—the core principles are exactly the same.
- Identify the Head: Pinpoint the absolute lowest point of the entire formation.
- Draw the Neckline: Connect the significant peaks between all the troughs.
- Confirm the Breakout: The trade signal is still a decisive, high-volume close above that established neckline.
While these complex patterns can look intimidating, they often represent a longer and more significant period of market bottoming. A successful breakout from such a structure can lead to a very powerful and sustained trend reversal, rewarding the traders who can look past the noise and focus on the underlying story.
Common Mistakes That Lead to Failed Trades
Knowing the anatomy of the inverted head and shoulders pattern is only half the battle. The other half—the part that really determines your long-term survival in the markets—is understanding the common pitfalls that can turn a beautiful setup into a painful loss.
Even the most picture-perfect pattern can fail. Often, it's a simple, avoidable mistake that trips up an otherwise smart trader. This is where discipline becomes just as important as your chart-reading skills. Think of this section as your guide to risk management, focused on the critical errors that trap traders and how you can sidestep them.
Forcing the Pattern When It Isn't There
This is probably the most common mistake, born out of impatience and the itch to find a trade. A trader sees a few troughs that vaguely resemble the formation and convinces themselves it’s a valid signal, even when key elements are missing. You start seeing what you want to see, not what's actually there.
Remember, this is a reversal pattern. It's only meaningful if it shows up after a clear, established downtrend. Trying to trade it in a choppy, sideways market is a recipe for disaster. Without the prior bearish momentum to reverse, the pattern loses all its predictive power.
Ignoring Critical Volume Signals
Trading a neckline breakout on low volume is like trying to launch a rocket with an empty fuel tank. It might sputter a little, but it’s not going anywhere. A surge in volume is the market’s stamp of approval. It’s confirmation that a wave of buyers has entered with real conviction, providing the thrust needed for a sustained move higher.
Ignoring this is one of the fastest ways to get caught in a bull trap. If the price just barely inches above the neckline with weak, uninspired volume, that’s a massive red flag. It tells you the breakout lacks genuine buying pressure and is highly likely to fail, sucking you in right before it reverses and stops you out.
Jumping the Gun Before Confirmation
Patience is a trader’s greatest virtue, and nowhere is that truer than waiting for a neckline break. The temptation to enter early as the price approaches the neckline can be overwhelming, driven by the fear of missing out (FOMO). But entering before a decisive close above this critical resistance level isn't trading—it's gambling.
The neckline is the line in the sand. Until the price has decisively closed above it, the downtrend is technically still intact. Entering before that confirmation means you are buying directly into overhead resistance, one of the riskiest trades you can make.
Mismanaging Your Trading Risk
Finally, even a perfect entry on a valid pattern can turn sour through poor risk management. This mistake cuts both ways, and both are equally damaging to your account and your psychology. It's a universal challenge for reversal patterns; if you're interested in the bearish side of things, check out our guide to mastering the head and shoulders pattern.
Here are the two classic risk management blunders:
- Setting Stops Too Tight: Placing your stop-loss just a few ticks below your entry is a rookie move. Markets breathe. This leaves no room for the natural ebb and flow of price action, and you risk getting shaken out of a perfectly good trade by normal volatility before the real move even starts.
- Setting Stops Too Wide: On the flip side, setting your stop-loss way too far away—or worse, not using one at all—is catastrophic. This exposes your capital to unacceptable risk. If the pattern fails, a wide stop can lead to a devastating loss that wipes out the gains from your last several winning trades.
It's also worth remembering that not every breakout takes off like a shot. In fact, pullbacks to the neckline happen in roughly 45-52% of cases. This reinforces why you need both proper stop placement and strong volume to have confidence in the signal.
Putting It All Together in Your Trading System
Mastering the inverted head and shoulders pattern isn't about finding a crystal ball; it's about seeing the pattern as one powerful piece of evidence in a larger trading case. A single pattern, no matter how perfect it looks, is just one clue. Real trading confidence comes from putting it all together—combining multiple, non-correlated signals to build a solid thesis for why a trade should work.
Think of yourself as a detective building a case. The pattern is your main lead, but you need more evidence to be sure. This is where you pull in other technical tools to confirm what the pattern is telling you.
Building a Confluence of Signals
Confluence is simply the idea that a trade setup gets stronger when multiple indicators all point in the same direction. By layering other tools on top of the inverted head and shoulders, you can filter out the weaker signals and zero in on the high-probability opportunities.
Here are a few ways to build this kind of confirmation:
- Moving Averages: Does the neckline breakout happen at the same time the price crosses above a major moving average, like the 50-day or 200-day? That adds some serious weight to the idea that the long-term trend is finally turning.
- Momentum Oscillators: Take a look at the Relative Strength Index (RSI). A bullish divergence—where the RSI makes a higher low while the price makes a lower low at the "head"—is a classic sign that bearish momentum was drying up long before the actual breakout.
- Trendlines: A break of a long-term bearish trendline that occurs right around the neckline break is powerful. It's like getting two major green lights at the same time.
The goal is to get past just spotting a pattern. You want to use it as the foundation for a complete, risk-managed trading strategy that stacks the odds in your favor.
It's also crucial to understand what's happening in the broader market. Reviewing the latest financial market updates gives you that context. After all, you don't want to trade a bullish reversal pattern right into the face of overwhelmingly bearish market news.
Before you ever put real money on the line, you have to practice. Use a tool like ChartsWatcher to backtest your strategy on historical data. See how your combination of signals actually performed in the past. This is how you build the discipline and confidence to execute your plan flawlessly when it counts, helping you trade smarter, not harder.
Got Questions? Let's Clear Things Up.
Even after you've got a good handle on the inverted head and shoulders pattern, a few questions almost always pop up. That's perfectly normal. This section is all about tackling those common queries head-on, giving you the clear answers you need to trade with more confidence.
Let's dive in.
What Is the Main Difference Between a Regular and an Inverted Head and Shoulders Pattern?
Think of them as mirror images telling opposite stories. The regular head and shoulders pattern is a classic bearish signal. It shows up at the top of an uptrend and basically screams that the party might be over and prices could be heading down.
The inverted version is its optimistic twin. It forms at the bottom of a downtrend, signaling that sellers are finally running out of steam. It’s a heads-up that a bullish rally could be just around the corner. One marks the potential end of buying pressure; the other, the end of selling pressure.
How Reliable Is This Bullish Reversal Pattern?
The inverted head and shoulders is considered one of the more dependable reversal patterns out there, but let’s be clear: no pattern is a crystal ball. Its reliability gets a massive boost when the breakout above the neckline is accompanied by a big spike in trading volume.
A high-volume breakout is like getting a vote of confidence from the rest of the market. It suggests real conviction from buyers. Without it, you're looking at a much higher risk of a "bull trap," where the price pokes its head out only to get smacked back down.
Never trade this pattern in a vacuum. Always use it as part of a complete trading plan, confirming the signal with other tools like the RSI or moving averages to build a much stronger case for your trade.
Does the Pattern Work on All Timeframes and Markets?
Yes, and that’s one of its biggest strengths. The inverted head and shoulders is a universal pattern. You can find it on charts for stocks, forex, crypto, commodities—you name it.
It's also fractal, meaning the pattern shows up on all timeframes. You might spot one on a 5-minute chart for a quick day trade or on a weekly chart for a major long-term position. As a general rule of thumb, though, patterns that form over longer timeframes (like daily or weekly charts) tend to carry more weight and often lead to bigger, more sustainable trend reversals.
Tired of hunting for patterns by hand? What if you could find high-probability setups automatically? ChartsWatcher gives you powerful scanning and backtesting tools to identify, test, and trade patterns like the inverted head and shoulders with precision. Discover how ChartsWatcher can sharpen your trading edge today.
