Master the Inverted Head and Shoulder Pattern
The inverted head and shoulder pattern is a classic chart formation that every trader should know. It's one of the most reliable signals that a market's downtrend is running out of steam and a new uptrend could be just around the corner.
Think of it as the market hitting rock bottom, catching its breath, and then building up the strength for a powerful rebound.
The Story: A Tug-of-War Between Buyers and Sellers
Picture a tense tug-of-war. For a while, the sellers have been dominant, relentlessly pulling the price lower and lower. But an inverted head and shoulder pattern tells the visual story of how that momentum slowly, but surely, shifts in favor of the buyers.
This pattern isn't just some random shape; it’s a powerful reflection of changing market psychology. Sellers, who have been in complete control, start to lose their grip. At the same time, buyers begin to sense weakness and smell an opportunity, stepping in with more and more confidence until they finally overpower the selling pressure. This psychological shift is what makes it such a compelling reversal signal.
Anatomy of the Pattern
To really get a feel for this pattern, you have to understand its individual parts. Each component tells a piece of the story, showing how seller momentum is fading and buyer confidence is taking over. It's a drama that unfolds in four key acts.
- The Left Shoulder: After a long slide, sellers push the price to a new low. But then, buyers step in, creating a small bounce. This first dip and recovery form the left shoulder.
- The Head: The sellers give it one last aggressive shove, managing to create an even lower low than the left shoulder. This is their final show of force. But they can't sustain it, and buyers once again push the price back up. This deepest trough is the "head."
- The Right Shoulder: Sellers try to push the price down again, but they're clearly losing energy. They fail to even reach the low of the head. This "higher low" forms the right shoulder and is a massive red flag for sellers—they're exhausted.
- The Neckline: This is the final line in the sand. A resistance line is drawn by connecting the peaks of the rallies that followed the left shoulder and the head. This neckline is the last barrier the buyers need to break through to prove they are in control.
The breakout is the moment of truth. When the price pushes decisively above the neckline, it's the signal that buyers have officially won the battle. The downtrend is very likely over.
To help you remember these parts, here's a quick summary of what each one means for the market's mood.
Quick Guide to Pattern Components
| Component | Description | Market Implication |
|---|---|---|
| Left Shoulder | The first low in the formation, followed by a minor rally. | Sellers are still in control, but buyers show initial signs of life. |
| The Head | A lower low than the left shoulder, followed by a rally. | Sellers make a final, exhaustive push, but buyers respond with more strength. |
| Right Shoulder | A higher low than the head, roughly symmetrical to the left shoulder. | A clear sign of seller exhaustion; buyers are now preventing lower prices. |
| The Neckline | A resistance line connecting the highs of the two rallies. | The critical breakout level that confirms the bullish reversal. |
| Breakout | Price moves decisively above the neckline, often on increased volume. | Buyers have officially taken control, signaling the start of a potential new uptrend. |
This clear progression from seller dominance to buyer takeover is what makes the pattern so popular and trusted among traders.
The reliability of this pattern is a huge part of its appeal. In fact, some statistical analyses show that the inverted head and shoulder pattern is one of the most dependable formations out there. For example, research from sources like CentralCharts.com suggests that in about 98% of cases, the exit from this pattern is bullish, indicating a very strong probability of a price increase.
For an even deeper dive into spotting this setup in real-time, you can explore our full guide on this key bullish reversal pattern.
How to Identify a High-Quality Pattern
Spotting an inverted head and shoulder pattern on a chart is one thing, but knowing if it's a high-quality setup you can actually trade is another skill entirely. Not all of these formations are created equal. A truly powerful pattern tells a clear story of sellers running out of steam and buyers stepping back in with force.
To tell the difference between a high-potential setup and a false alarm, you need to look beyond the basic shape and dig into its anatomy. A valid pattern never just shows up randomly; it absolutely must follow a clear, sustained downtrend. This context is non-negotiable. The downtrend proves that sellers were in control before the reversal started to take shape, giving the pattern its predictive power.
The Four Phases of Formation
A classic, reliable pattern unfolds in four distinct phases, each giving you a clue about the shifting market psychology.
-
The Left Shoulder: After the downtrend, sellers make a push to a new low. But then, buyers show up and manage a small recovery rally. This first dip and bounce create the left shoulder, giving us the first hint that selling pressure is finally meeting some real resistance.
-
The Head: Feeling confident, sellers try one last aggressive push, driving the price to a lower low than the left shoulder. This is their final, major show of force. But the buyers answer with even more strength, pushing the price all the way back up toward the previous rally's high. This deepest point of the pattern is the head.
-
The Right Shoulder: Sellers try to regain control one more time, but they're visibly weaker now. They push the price down again but can't even get close to the low of the head. This "higher low" forms the right shoulder and is a massive signal that the sellers are exhausted. Buyers are now setting a new floor for the price.
-
The Neckline: The final piece of the puzzle is the neckline. You draw this by connecting the high points of the rallies that came after the left shoulder and the head. Think of this line as the final barrier—the "line in the sand" for the bulls.
A breakout above this neckline is the confirmation signal we've been waiting for. It acts as the trigger, confirming that the balance of power has officially shifted from sellers to buyers and a new uptrend is likely getting started.
The Critical Role of Volume
Volume is the ultimate truth-teller in technical analysis. While the shape of the inverted head and shoulder pattern is important, the trading volume that goes along with it provides the essential confirmation you need.
Ideally, you want to see volume follow a specific script. As the left shoulder and head form, volume should be tapering off. This decline shows that the selling pressure driving the downtrend is drying up. Then, when the price breaks out above the neckline, you should see a significant surge in trading volume. This spike confirms that strong buying conviction is fueling the new move higher.
This image visualizes how these distinct phases come together to form a complete and identifiable pattern.
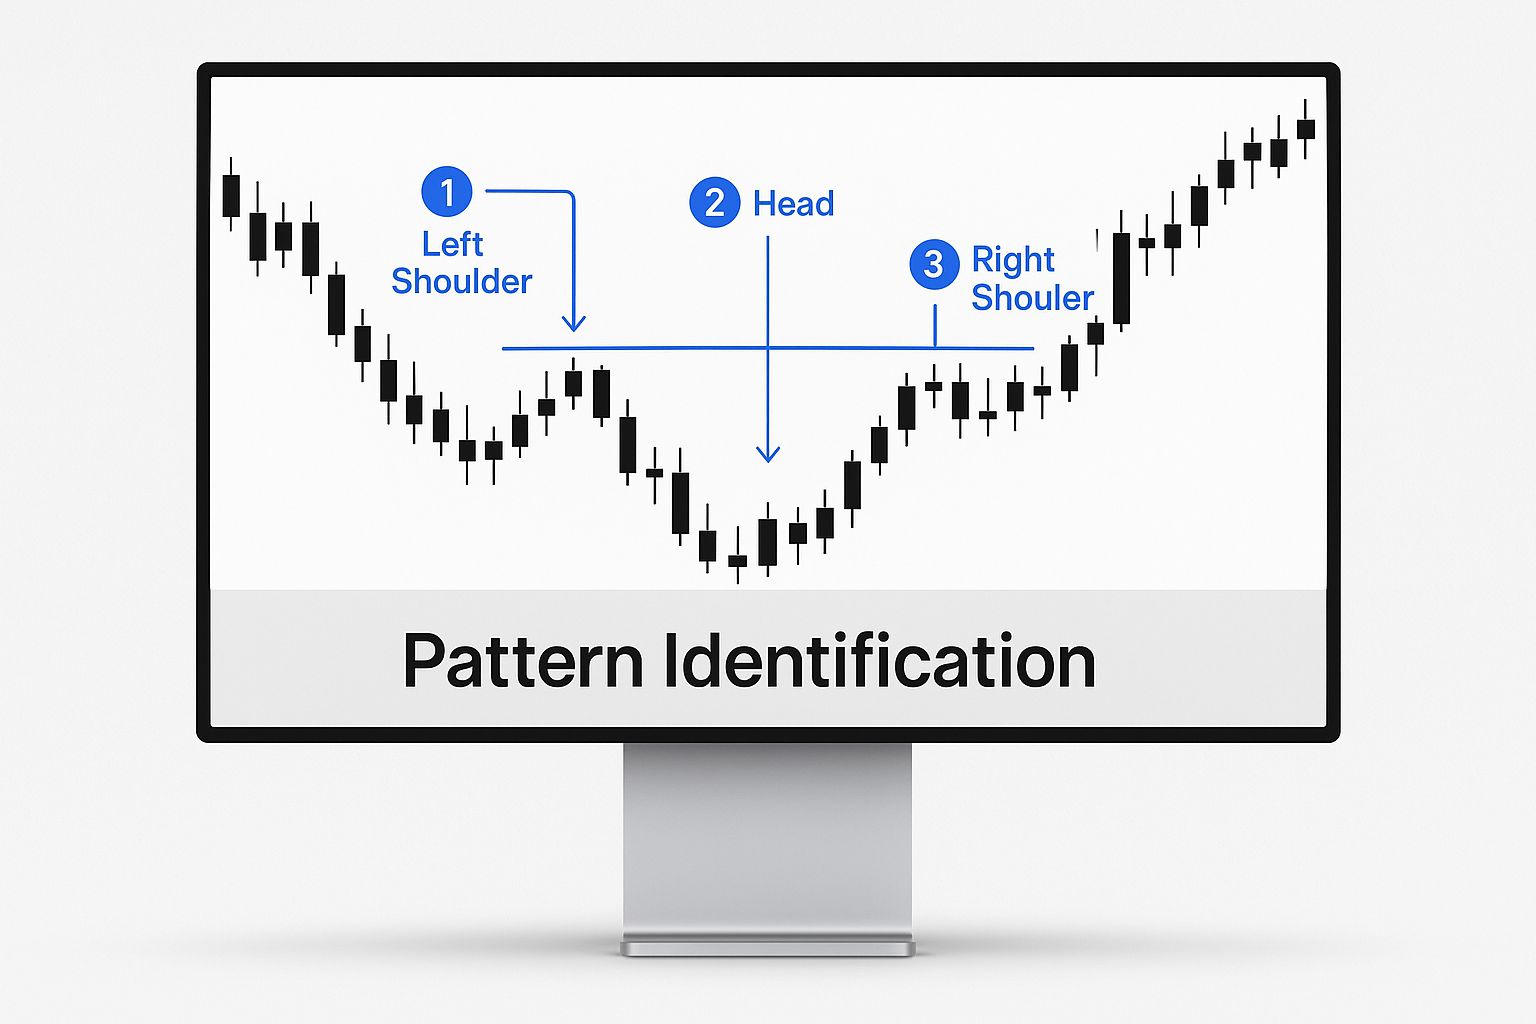
The key insight here is the story it tells: a clear progression from seller exhaustion (lower lows on fading volume) to buyer dominance (a higher low at the right shoulder followed by a high-volume breakout).
Confirming the Breakout with Volume and Indicators
Spotting a potential inverted head and shoulder pattern is a great start, but acting on it without more evidence is like sailing into a storm without checking the weather. Confirmation is what separates a high-probability trade from a costly false alarm. The single most crucial piece of evidence you need is a significant change in trading volume.
Think of volume as the market's "voice." During the formation of the shoulders and the head, you want this voice to be quiet. This quietness suggests that the sellers driving the price down are running out of steam.
But when the price finally punches through the neckline, you need that voice to become a deafening roar. A massive spike in trading volume on the breakout is your green light. It’s the market screaming that a crowd of enthusiastic buyers is rushing in, providing the fuel needed to kick off and sustain a new uptrend.
On the other hand, a breakout on weak or declining volume is a major red flag. It suggests the move lacks genuine conviction and could easily fizzle out.
Using Volume as Your Lie Detector
Volume gives you objective proof of the market's real intentions. It's the tool that helps you tell the difference between a genuine reversal and a deceptive "bull trap" designed to suck you in right before the price collapses again.
Here’s a simple way to think about volume throughout this pattern:
- During the Downtrend: Volume is usually high. Sellers are in control.
- During Pattern Formation: Volume should ideally fade as the left shoulder, head, and right shoulder form. This is a classic sign of seller exhaustion.
- At the Breakout: A decisive surge in volume is non-negotiable. This confirms that buyers have seized control with force.
A great real-world example of this played out in the tech sector in early 2023. A major tech stock carved out a perfect inverted head and shoulders after a brutal downtrend. When the price finally broke the neckline, it did so on a volume spike of around 25-40% above its 50-day average. That was the confirmation. This case perfectly shows how declining volume during the setup signals that bears are tired, while a high-volume breakout confirms bulls are back in charge. You can dive deeper into the market psychology driving this pattern on ChartsWatcher.com.
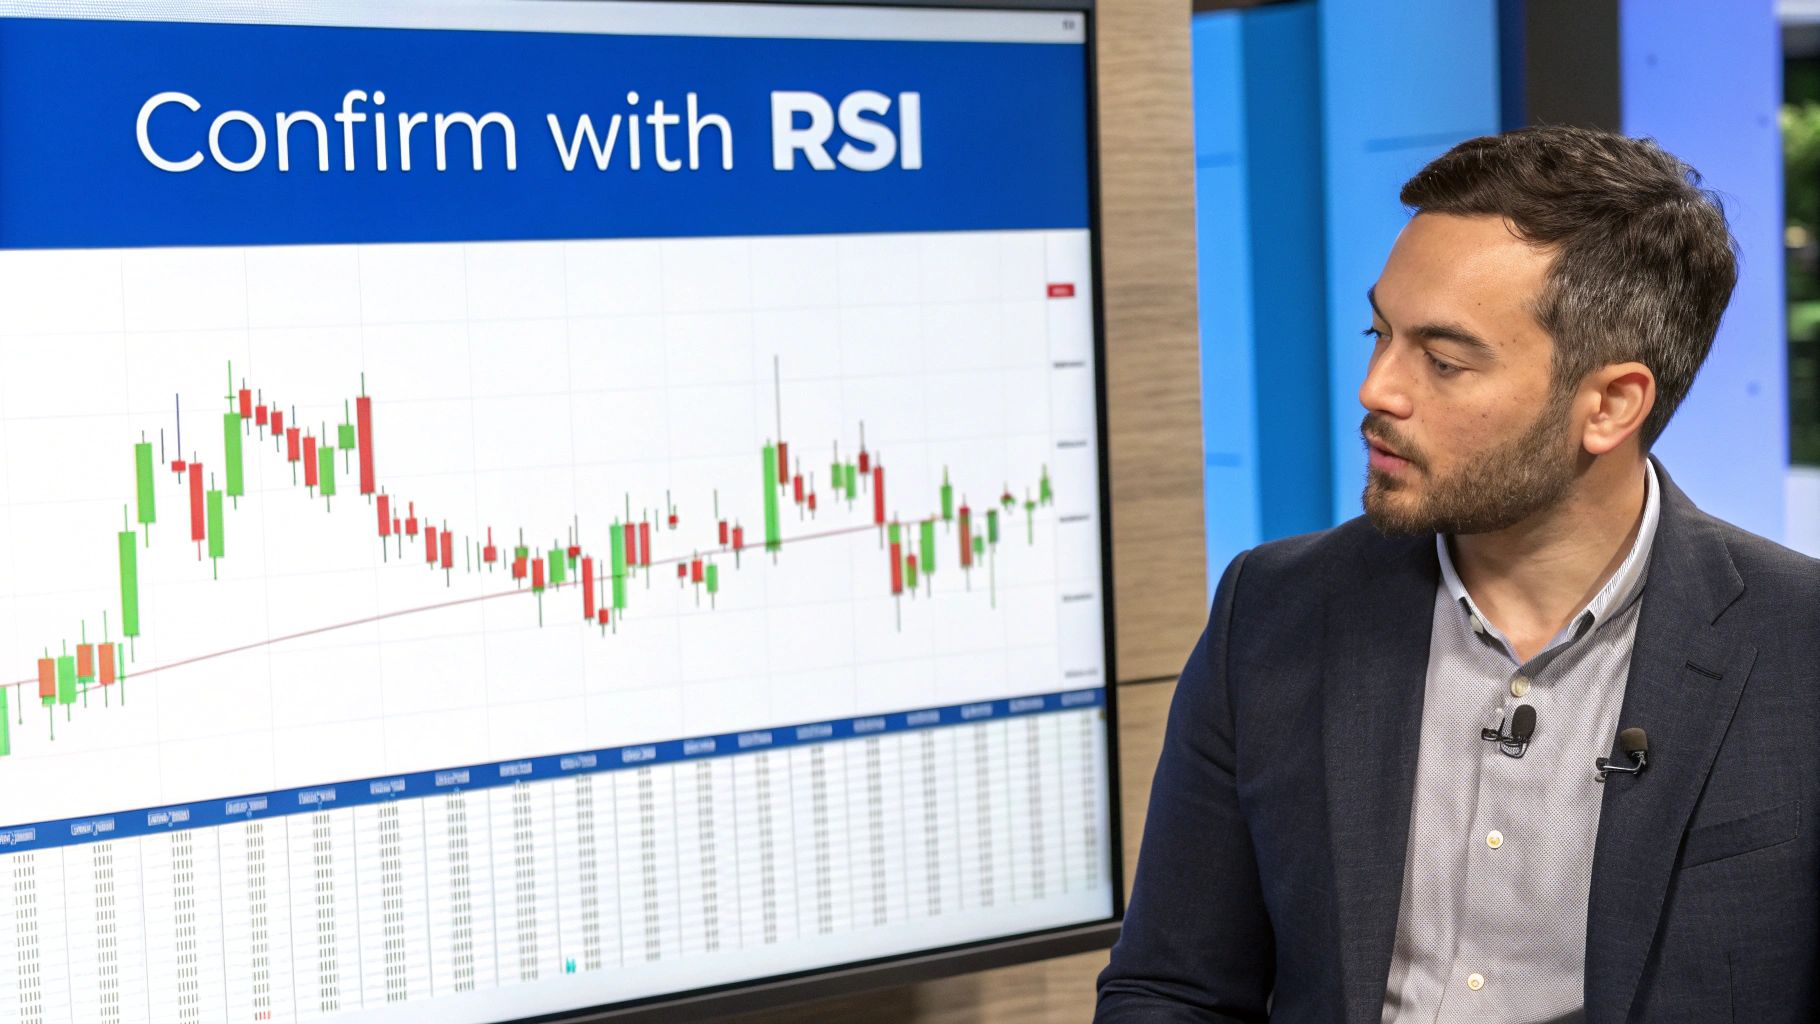
Adding Another Layer of Confidence with Indicators
While volume is king, you can build an even stronger case by layering in other technical indicators. The Relative Strength Index (RSI) is an excellent partner for this pattern. The RSI measures the speed and strength of price moves, helping you spot overbought or oversold conditions.
One of the most powerful confirmation signals is a bullish divergence between the price and the RSI. This happens when the price makes a lower low (from the left shoulder to the head), but the RSI makes a higher low.
This divergence is a huge tell. It shows that even as sellers managed to push the price to a new low to form the head, their downward momentum was actually fading fast.
Finding this signal while an inverted head and shoulder pattern is taking shape gives you an incredible edge. It adds a powerful layer of evidence that a true reversal is brewing. When you see that divergence followed by a high-volume break of the neckline, you have a robust, multi-faceted confirmation to trade with confidence.
A Practical Trading Strategy for This Pattern

Spotting a clean inverted head and shoulder pattern is great, but that's only half the job. To actually make money from it, you need a solid, repeatable game plan. This is where we turn chart analysis into real-world action by defining the three pillars of any good trade: your entry, your stop-loss, and your profit target.
Having a structured approach takes the emotion and guesswork out of the equation, letting you trade with discipline. When you know exactly where you’ll get in, where you’ll cut your losses if you’re wrong, and what your goal is if you’re right, you're trading like a professional. Let's walk through building that plan.
Choosing Your Entry Point
How you enter the trade really comes down to your personality and risk appetite. There are two main ways to get into an inverted head and shoulders trade, each with its own trade-offs.
When it comes to picking an entry, traders generally fall into two camps: aggressive breakout players or patient pullback traders. Deciding which one you are is key to building a strategy that fits you.
Comparing Breakout and Pullback Entry Strategies
| Strategy | Pros | Cons | Best For |
|---|---|---|---|
| Aggressive Breakout | You won't miss the move if it takes off immediately after breaking the neckline. | Higher risk of getting caught in a "false breakout" where the price quickly reverses. | Traders who prioritize catching momentum and are willing to accept a lower win rate for potentially bigger, faster gains. |
| Conservative Pullback | Often provides a better risk-to-reward ratio and confirms the neckline has turned into support. | The price might not pull back, meaning you could miss the trade entirely. | Patient traders who prefer higher-probability setups and are okay with missing some moves to avoid false signals. |
Ultimately, there's no single "best" entry. The right choice depends on your trading style and what you're willing to risk.
Setting Your Stop-Loss
Your stop-loss is your safety net, plain and simple. It's the non-negotiable exit that protects your capital when a pattern fails and the market turns against you.
For an inverted head and shoulder pattern, the most logical place for a stop-loss is just below the low of the right shoulder. This spot gives the trade enough room to wiggle without getting stopped out by normal market noise, but it also ensures you're out with a small, manageable loss if that critical "higher low" structure breaks down.
A well-placed stop-loss isn't a sign of fear; it's a tool of professional risk management. It defines your maximum acceptable loss before you even enter the trade, which is essential for long-term survival in the markets.
Calculating Your Profit Target
One of the best things about this pattern is that it comes with a built-in price projection. This gives you an objective, data-driven target to aim for instead of just guessing.
Here’s how to calculate it:
- Measure the Height: Find the vertical distance from the lowest point of the head straight up to the neckline.
- Project Upward: Take that same distance and add it to the point where the price broke through the neckline.
This projected level is your final destination for the trade. While it provides a solid goal, smart traders also keep an eye on major resistance levels on the way up, as these can be good places to take some profits off the table. Honing this skill is a crucial part of learning how to master technical analysis patterns for better trading results.
By combining these three elements—a defined entry, a protective stop-loss, and a calculated profit target—you create a complete trading blueprint for every setup you take.
Common Mistakes When Trading This Pattern
While the inverted head and shoulder pattern is a powerful bullish signal, it’s not a crystal ball. Even the most textbook-perfect setups can fall apart, and traders often make expensive mistakes by misreading the signs or fumbling the execution. Knowing what not to do is just as critical as knowing how to spot the pattern in the first place.
One of the biggest blunders is forcing the pattern. If you have to squint, tilt your head, and really want to see the shoulders and head on a messy, unclear chart, it’s not a high-quality setup. A legitimate pattern should be obvious and follow a clear downtrend. Trying to trade a questionable formation is just wishful thinking.
Another classic mistake is ignoring volume signals. A breakout above the neckline that happens on weak or average volume is a massive red flag. This tells you there isn't enough buying conviction to push the price higher, making the breakout extremely vulnerable to failure.
Chasing and Failing to Plan
A third critical error is chasing the breakout too late. We’ve all felt it—the fear of missing out (FOMO). But jumping in long after the price has already rocketed past the neckline is a recipe for disaster. It guarantees you a poor entry and a terrible risk-to-reward ratio, leaving your stop-loss dangerously far away.
Finally, the most damaging mistake of all is having no plan for when the pattern fails. A "failed breakout" or "bull trap" is when the price pokes above the neckline, only to reverse and plunge right back below it. This is where your stop-loss becomes your most important tool.
A stop-loss isn't just a suggestion; it is your non-negotiable exit plan. Placing it just below the right shoulder’s low protects your capital and prevents a small, manageable loss from turning into a devastating one.
It's also crucial to understand the odds to keep your expectations in check. While historical performance varies, one detailed statistical analysis found that about 63% of breakouts from the inverted head and shoulder pattern hit their projected price target. The study also noted that pullbacks to the neckline happen in roughly 45% of cases.
These numbers confirm that even good setups fail, reinforcing why disciplined risk management is everything. You can explore more about these success rates to see how these statistics play out under real market conditions.
Frequently Asked Questions
Even when you feel like you've got a good handle on the inverted head and shoulder pattern, a few practical questions always pop up during live trading. Let's tackle some of the most common ones I hear from traders to clear up any confusion and focus on the details that really matter.
What Is the Most Important Confirmation Signal?
If you only pay attention to one thing, make it this: volume. The single most critical confirmation signal is a significant spike in trading volume as the price breaks above the neckline. This surge is the market's way of validating the pattern, showing that real buying conviction is fueling the move.
A breakout that happens on weak or anemic volume is a massive red flag. It dramatically increases the odds of a "fakeout" or a complete pattern failure. That volume spike is your proof that the shift from bearish to bullish sentiment is genuine, backed by traders putting serious capital to work.
Does This Pattern Work on Any Timeframe?
Yes, the pattern is fractal. That's just a fancy way of saying it can show up on any chart you're looking at, from a 5-minute intraday chart all the way up to a weekly or even monthly one.
Key Insight: The pattern's reliability generally gets a major boost on longer timeframes. A weekly or daily pattern carries a lot more weight than one that forms on a 5-minute chart. It suggests a more significant and durable trend reversal is underway. Always adjust your strategy and risk based on the timeframe you're trading.
What Should I Do if a Breakout Fails?
It happens. This scenario is what traders call a "failed breakout" or a "bull trap." It's when the initial buying pressure just isn't enough to keep the momentum going, and the price sinks right back below the neckline it just broke.
This is exactly why disciplined risk management is non-negotiable. If you enter a trade on the breakout, you absolutely must have a stop-loss order in place to cap your potential loss. A failed breakout instantly invalidates the bullish signal, and the smart move is to exit the position immediately to prevent bigger losses if the market decides to resume its downtrend.
How Important Is the Slope of the Neckline?
The slope of the neckline can offer an extra layer of insight into the pattern's potential strength. It's not a hard-and-fast rule, but it adds a bit of nuance to your analysis. Here's a simple way to think about it:
- Horizontal or Downward-Sloping: These are generally the setups you want to see. They're considered more reliable and powerful. A downward-sloping neckline hints that sellers are losing their grip, since they can't even push the price down to the level of the previous rally's peak.
- Steeply Upward-Sloping: This can be a bit of a warning sign. It means the breakout has a tougher hill to climb and might be more prone to failure because it requires so much more buying momentum.
Most experienced traders I know tend to favor patterns with horizontal or slightly descending necklines. They represent a much clearer and more decisive transfer of control from sellers to buyers. By zeroing in on these small details, you can filter for higher-probability setups and sidestep the weaker ones that are more likely to fall apart.
Ready to stop searching for patterns and start finding them automatically? ChartsWatcher provides powerful, real-time market scanners that can instantly identify the inverted head and shoulder pattern and other high-probability setups across thousands of stocks. Customize your dashboards, set precise alerts, and find your next trade faster. Explore our powerful tools and plans at https://chartswatcher.com.
