A Trader's Guide to the Exponential Moving Average Indicator
The exponential moving average is a technical analysis tool that puts a premium on what’s happening in the market right now. It smooths out price data to show you the trend, but unlike a simple moving average, it gives more weight to the very latest price action. This helps traders react faster to important market shifts.
What Is the Exponential Moving Average Indicator?
Imagine you're trying to guess today's weather. Would you average the temperature of the last 30 days, giving equal importance to a chilly day three weeks ago and the warm front that moved in yesterday? Probably not. You'd care a lot more about yesterday's temperature. That's the simple, powerful idea behind the Exponential Moving Average (EMA).
The EMA is a go-to tool for traders who need to cut through the day-to-day "noise" of price charts and see the underlying trend clearly. Its cousin, the Simple Moving Average (SMA), treats all prices in a period equally. The EMA, however, is different—it intentionally biases its calculation toward the most recent prices.
This design makes it react much more quickly to price changes, a huge advantage in fast-moving markets.
Why Responsiveness Matters
This built-in sensitivity is exactly why so many traders lean on the EMA. In volatile markets, a few strong up or down days can be the first signal of a major new trend. The EMA is engineered to pick up on these shifts faster than an SMA, potentially giving you an earlier heads-up to get in or get out.
Think of it like a speedboat versus a cargo ship. The EMA can turn on a dime, while the SMA takes a lot longer to change its course. This nimbleness makes the exponential moving average indicator a favorite for:
- Short-term traders who need to jump on rapid shifts in momentum.
- Trend-followers who know that getting into a new trend early is critical.
- Volatile assets like cryptocurrencies or high-growth tech stocks where the price can reverse in a heartbeat.
The real job of the EMA isn't to predict the future. It’s to clarify the present. It filters out the random price spikes to show you the true direction of momentum, with a clear focus on what’s happening right now.
For traders needing a quick summary, here’s a breakdown of the EMA's core features.
Exponential Moving Average Quick Reference
This table summarizes the core attributes of the EMA indicator for traders who need a fast overview of its key features and applications.
| Attribute | Description | Best Used For |
|---|---|---|
| Calculation | A type of moving average that applies more weight to recent price data. | Identifying current trend direction with more sensitivity than an SMA. |
| Responsiveness | High. Reacts quickly to sudden price changes and new information. | Short to medium-term trading strategies, especially in volatile markets. |
| Lag | Lower than the Simple Moving Average (SMA) for the same period. | Generating faster entry and exit signals for momentum and trend trading. |
| Common Periods | 12 and 26 for MACD; 9, 21, 50 for trend analysis. | Crossovers, dynamic support/resistance, and trend confirmation. |
| Strengths | Timely signals, reduces lag, effective for trend identification. | Capturing the beginning of new trends and reacting to market shifts quickly. |
| Weaknesses | Can be prone to false signals ("whipsaws") in choppy or sideways markets. | Less effective in range-bound markets where its sensitivity can be a drawback. |
This reference gives you the high-level view, but the real magic happens when you put it into practice.
Throughout this guide, we're going to move well beyond the basics. We'll dissect the formula that gives the EMA its unique character, put it head-to-head with other moving averages, and walk through real, actionable trading strategies. You'll also see how to build the EMA into your system using the powerful tools in ChartsWatcher, turning this indicator from a concept into a concrete edge.
How the EMA Calculation Actually Works
To really get a feel for the exponential moving average, you need to look under the hood. While you'll never have to do the math by hand when trading, understanding how it's calculated gives you a powerful intuition for why the EMA behaves the way it does. It's the difference between blindly following a signal and truly understanding the story the chart is telling you.
At its heart, the EMA is built from three simple ingredients: the current price, the EMA value from the last period, and a special little number called the smoothing factor. This factor, or multiplier, is the secret sauce that makes the EMA so responsive to what's happening right now.
Think of it like a snowball rolling downhill. It's always picking up fresh snow, which sticks to the outside and has the biggest impact on its current size. The older snow gets packed deep inside, contributing less and less to its shape. The EMA works the same way—it carries a "memory" of old prices, but it gives the most weight to the very latest price action.
This process essentially filters out the market noise, turning choppy price action into a much smoother, more usable trend line.
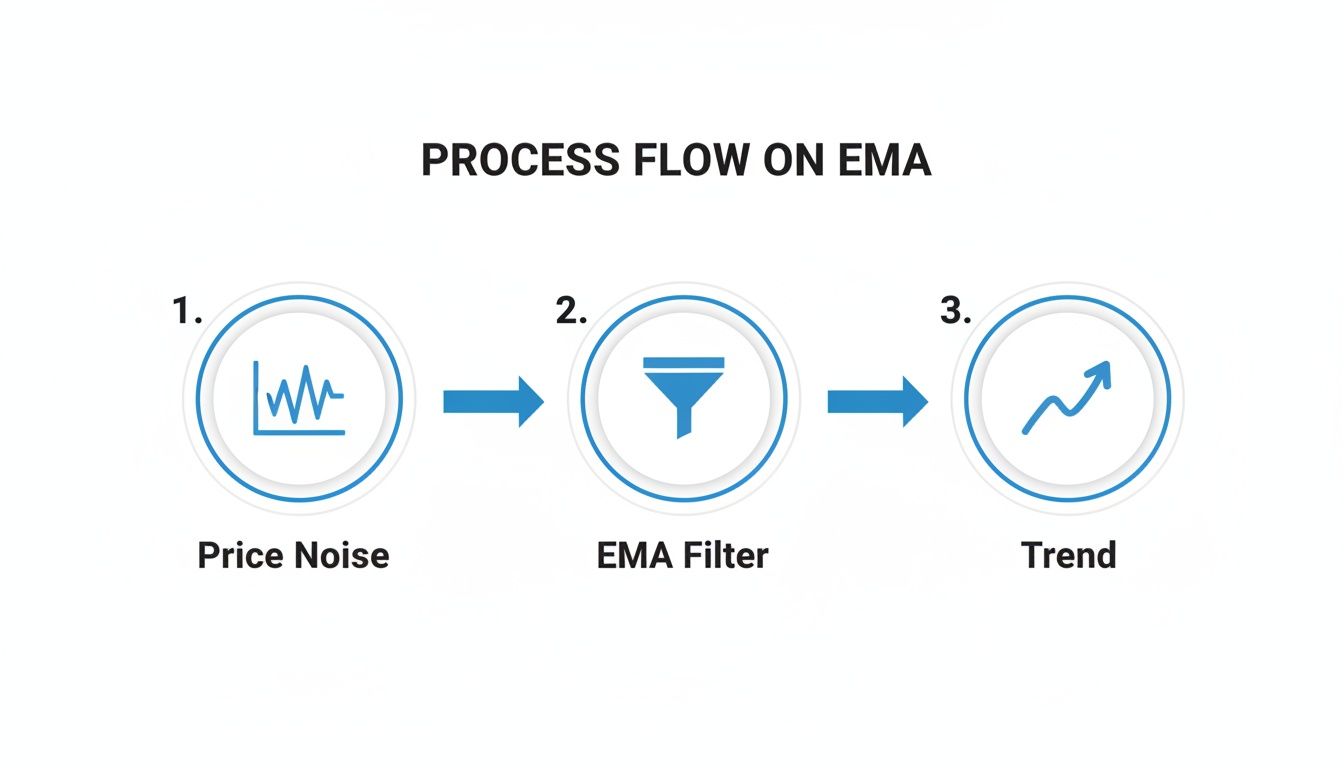
As you can see, the indicator takes those jagged price movements and translates them into a clearer picture of the market's underlying direction.
The Smoothing Factor Unpacked
The whole system hinges on that smoothing factor, which is cooked up directly from the period length you choose for your indicator. The formula is surprisingly simple:
Multiplier = 2 / (Selected Time Period + 1)
This little formula is what assigns the right amount of importance to the most recent price. For a 10-period EMA, the multiplier works out to be 0.1818. This means the most recent closing price gets an 18.18% weighting in today's EMA value.
If you switch to a 20-period EMA, that weighting drops to just 9.52%. This is why shorter-period EMAs hug the price so tightly—they're designed to react much faster than a Simple Moving Average (SMA), which gives every single price point in its lookback period the exact same weight.
Let's walk through a quick example to see how this plays out in the real world.
A Step-By-Step EMA Calculation
Let's say we're calculating a 10-period EMA. As we just figured out, our multiplier is 0.1818.
- The Starting Point: For the very first calculation, we don't have a "previous EMA" value to work with. So, we kick things off by using a Simple Moving Average (SMA) for the first 10 periods. For our example, let's say the 10-day SMA is $100. This becomes our initial EMA value.
- Day 11: The stock closes at $105. Now we have everything we need: the current price ($105), the previous EMA ($100), and our multiplier (0.1818).
- The Formula in Action: The calculation for the new EMA is: (Current Close - Previous EMA) * Multiplier + Previous EMA
- Putting It Together:
- ($105 - $100) * 0.1818 + $100
- $5 * 0.1818 + $100
- $0.909 + $100 = $100.91 (This is our new EMA value)
This process just repeats itself day after day. Tomorrow's calculation will use $100.91 as its "previous EMA," and so on. This continuous, compounding nature is what keeps the indicator fresh and relevant.
For traders who really want to dig into the mechanics, guides on how to calculate moving averages can offer some great insights. We also have our own detailed walkthrough that covers how to calculate moving averages for trading. Getting comfortable with this logic gives you the power to really fine-tune the indicator to fit your specific strategy and timeframe.
Choosing Between EMA and Other Moving Averages
Picking the right moving average isn’t about finding the single “best” one. It’s about picking the right tool for the job. The Exponential Moving Average is just one option in a toolkit that includes other popular choices, like the Simple Moving Average (SMA) and the Weighted Moving Average (WMA). Each one tells a slightly different story about the market’s trend.
The difference really boils down to one thing: how they weigh price data. This single distinction creates huge differences in how they behave on your charts, impacting everything from the speed of your signals to their reliability. Your choice will ultimately depend on your trading style, the market you're analyzing, and your own tolerance for risk.
Put simply, an EMA prioritizes recent action, an SMA treats all data equally, and a WMA offers a linear weighting. Getting these nuances is the key to matching an indicator to your strategy.
Sensitivity and Speed The EMA Advantage
The main reason traders gravitate toward the Exponential Moving Average (EMA) is its speed. By giving more weight to the most recent prices, the EMA reacts much more quickly to new market information. Think of it as a highly sensitive seismograph, built to pick up the earliest tremors of a new trend.
Of course, this responsiveness is a double-edged sword. In a strong, trending market, an EMA will get you into a move earlier than an SMA, potentially letting you capture more of the profit. But in a choppy, sideways market, this same sensitivity can lead to “whipsaws”—generating multiple false buy and sell signals as it overreacts to meaningless noise.
The EMA is built for momentum. Its design assumes that the most recent price is the most important price, making it ideal for traders who want to act on trend changes as quickly as possible.
The Simple Moving Average (SMA), on the other hand, is the slow and steady operator. It gives equal weight to every single price point in its lookback period, which produces a much smoother line on your chart. This makes it fantastic for confirming long-term, established trends, but it's often far too slow for most short-term strategies. If you want a deeper dive, our complete trader's guide to the Simple Moving Average is a great place to start.
Lag and Signal Quality
Every moving average is a lagging indicator—after all, it’s based on past prices. The real question is how much it lags. The EMA was specifically designed to reduce the lag that's so inherent in the SMA. For any given period, the EMA will always hug the current price more closely than the SMA.
The Weighted Moving Average (WMA) sits somewhere in the middle, though it’s less common than its two famous cousins. It also prioritizes recent data but does so with a simple linear weighting. For a 10-period WMA, the most recent price gets a weight of 10, the next gets 9, and so on. It's faster than an SMA but generally isn't as responsive as the compounding, exponential weighting of an EMA.
This constant trade-off between lag and smoothness directly impacts the quality of the signals you get.
- EMA: More signals, but a higher chance of false alarms.
- SMA: Fewer signals, but they are often more reliable confirmations of a major trend.
- WMA: A middle ground, offering a balance but without the distinct advantages of the other two.
Comparing EMA vs SMA vs WMA
To make the choice clearer, this table breaks down the key differences between the three main types of moving averages. Use it to decide which indicator best fits your specific trading approach.
| Indicator Type | Key Characteristic | Pros | Cons | Best For |
|---|---|---|---|---|
| EMA | Exponential Weighting: Places significant emphasis on the most recent price data. | Reduces lag: Provides earlier signals for entries and exits. | Prone to whipsaws: Can generate false signals in choppy markets. | Momentum and trend trading in volatile, fast-moving markets. |
| SMA | Equal Weighting: Averages all prices in the period equally. | Smooths price action: Excellent for identifying long-term trends and reducing noise. | Significant lag: Slow to react to new trend formations. | Long-term trend confirmation and identifying major support/resistance zones. |
| WMA | Linear Weighting: Assigns linearly decreasing weight to older prices. | Faster than SMA: More responsive to recent price changes. | Less common: Fewer established strategies and platform support. | Traders seeking a balance between SMA's smoothness and EMA's speed. |
Ultimately, there's no magic bullet. The best way to find out which moving average works for you is to test them in different market conditions and see which one aligns with your goals and risk management rules.
Putting the EMA to Work: Actionable Trading Strategies
Alright, enough theory. Let's get down to what really matters: how to use the Exponential Moving Average to actually make trading decisions. Knowing what an EMA is helps, but making money comes from knowing what it does in the real world.
I'm going to walk you through three solid, battle-tested strategies. Each one uses the EMA's sensitivity to momentum in a slightly different way, giving you a strong foundation for building a system that fits your own style. Think of these as frameworks for identifying trends, timing your entries, and knowing when to get out.
The goal here is simple: filter out the market noise and focus on the underlying trend. It doesn't matter if you're holding for months or just a few days; these concepts can be adapted. The secret is understanding the logic behind each one before you risk a single dollar.
Strategy 1: The Trend Barometer
The simplest, most effective way to use an EMA is as a basic trend filter. Think of it as a line in the sand. By plotting a longer-term EMA on your chart, you get a clean, visual guide to whether the bulls or the bears are in control. It's your high-level barometer for market sentiment.
For this job, you need to think long-term.
- 50-period EMA: This is a classic for gauging the medium-term trend on daily charts. If the price is consistently trading above the 50 EMA, the market has a bullish lean. If it's trading below, the bears are in charge.
- 200-period EMA: This is the big one. It's the institutional benchmark for the long-term trend. Many professional funds won't even consider buying a stock if it's trading below its 200-day EMA.
The rule couldn't be simpler: When the price is above the EMA (uptrend), you should only be looking for chances to buy. When the price is below the EMA (downtrend), your focus should be on shorting or, just as importantly, staying on the sidelines. This one filter can save you from the costly mistake of fighting the market's primary direction.
Strategy 2: EMA Crossover Signals
This is where things get a bit more active. Crossover strategies bring in a second, faster EMA to generate more specific buy and sell signals. It's easily one of the most popular ways traders use the indicator. The logic is all about shifts in momentum—when the faster EMA crosses the slower one, it signals that the short-term energy is changing direction relative to the longer-term trend.
You’ve probably heard of the most famous examples:
- Golden Cross (Bullish): This happens when a shorter-term EMA (like the 50-period) crosses above a longer-term one (like the 200-period). It's widely seen as a major confirmation that a new bull market is underway.
- Death Cross (Bearish): The opposite, of course. The 50-period EMA dives below the 200-period EMA, signaling the potential start of a painful bear market.
While those are powerful long-term signals, swing traders use faster combinations to catch smaller moves. For instance, a trader might use a 9-period and a 21-period EMA on a daily chart. A buy signal triggers when the 9 EMA crosses above the 21 EMA; a sell signal appears when it crosses below.
Strategy 3: Dynamic Support and Resistance
In a market that's trending smoothly, the EMA itself can become a powerful, moving level of support or resistance. Unlike a static horizontal line you draw on your chart, the EMA travels with the price, creating a constantly adjusting zone where buyers (in an uptrend) or sellers (in a downtrend) are likely to show up.
Here’s how you can use this in practice:
- Find a Strong Trend: First, confirm the market is in a clear uptrend or downtrend, maybe using the 50 or 200 EMA we just discussed.
- Wait for a Pullback: In an uptrend, don't chase the price. Be patient and wait for it to pull back toward a shorter-term EMA, like the 21-period. This zone often acts as dynamic support.
- Look for Confirmation: When the price hits the EMA, look for a sign that buyers are stepping in. This could be a bullish candlestick pattern like a hammer or an engulfing bar. This extra piece of evidence gives you a much higher-probability entry.
This method is fantastic because it helps you get into an established trend at a better price, rather than buying at the top after the big move has already happened. Knowing how EMAs behave is critical, especially when analyzing volatile assets where trends are key, such as in Bitcoin price movements.
Key Takeaway: The real power of these strategies comes from combining them. A trader might use the 200 EMA to define the overall market, the 50 EMA to identify the tradable trend, and the 21 EMA to pinpoint entries on pullbacks. This creates a layered, much more robust system.
This multi-layered approach isn't just trader folklore; it's backed by research. Studies on stock performance have found that while short-term moving averages generate more signals, they're often less profitable. Longer-term averages are more reliable but slow. The clear takeaway is that using multiple EMAs together creates a more durable and effective strategy than just relying on a single line.
Alright, theory is one thing, but putting it into practice is where the rubber meets the road. An exponential moving average is just a line on a chart until you build a real system around it. This is where a platform like ChartsWatcher comes in—it’s designed to turn your strategies into automated, actionable rules that save you time and keep emotion out of your trading.
This next part is your hands-on guide to making the EMA work for you. We’ll walk through adding the indicator to your charts, building screener filters to hunt down opportunities, and setting up alerts so you never miss a critical price move. It's all about creating a systematic approach.

Customizing and Saving Your EMA Templates
First things first: let's get the EMA on your chart. In ChartsWatcher, this is dead simple. Just open a chart, head over to the "Indicators" menu, and find "Exponential Moving Average." Once it's added, you can start dialing in the settings to match the strategies we’ve been talking about.
You'll want to tweak a few key things:
- Period: This is the big one. Set it to a fast value like 9 or 21 for short-term moves, or a slower benchmark like 50 or 200 for the bigger picture.
- Source: The default is almost always the closing price, which is fine for most strategies. But you can also apply the EMA to the open, high, low, or even other indicators if you want to get creative.
- Appearance: Don't underestimate this! Change the color, thickness, and style of your EMA lines. When you have three or four MAs on a chart, making them visually distinct is a lifesaver.
Once you have a setup you love—say, a 9, 21, and 50 EMA combo for swing trading—save it as a chart template. This is a massive time-saver. It lets you apply your entire indicator suite to any stock with a single click, keeping your analysis consistent every single time.
Building Powerful Screener Filters
Here’s where you can really automate your workflow. Instead of burning your weekend manually flipping through hundreds of charts, you can build a custom screener in ChartsWatcher to find stocks that perfectly match your EMA rules in real-time.
For example, you could set up filters to find stocks where:
- A Golden Cross Just Happened: Just tell the screener to find stocks where the
EMA(50) Crossed Above EMA(200)on the daily chart. - Price Is Breaking Out: Create a rule like
Price Crossed Above EMA(21)to spot assets that are just starting to show bullish momentum. - The Trend Is Your Friend: Filter for stocks where
Price > EMA(50)andEMA(50) > EMA(200). This will instantly give you a list of only the strongest, most established uptrends.
This is what layering different rules looks like in the platform. You can combine technical conditions—like price action, volume, and multiple indicators—to create a hyper-specific scan that delivers a short, manageable list of high-potential trades.
Configuring Real-Time EMA Alerts
A screener finds the setups, but alerts make sure you act on them at exactly the right moment. This is how you go from being reactive to proactive. In ChartsWatcher, you can set up alerts using the same conditions you built in your screener.
Imagine getting a notification sent straight to your phone the instant a stock pulls back and touches its 21-period EMA on the hourly chart. That’s a perfect way to time your entries without having to stare at the screen all day.
Here are a couple of other powerful alert ideas:
- An alert for a 9/21 EMA crossover on a 15-minute chart to catch quick day trading setups.
- A notification when the price breaks below the 200-day EMA—a critical warning signal for your long-term holds.
By combining your custom chart templates, laser-focused screener filters, and precise real-time alerts, you can build a complete, disciplined trading system around the EMA. This is how you move from just knowing about an indicator to truly mastering it.
Common EMA Mistakes and How to Avoid Them
The exponential moving average is a fantastic tool, but it's no magic wand. Like any indicator, if you misuse it, you're setting yourself up for frustrating losses and missed opportunities. Understanding where it falls short is just as important as knowing where it shines. This awareness is what helps build a truly resilient trading approach.
One of the biggest mistakes traders make is treating the EMA as a standalone system. They see a bullish crossover, jump into a trade with both feet, and get stopped out moments later when the price whips right back around. The problem isn't the indicator; it's the lack of confirmation from the bigger picture.
The Whipsaw Trap in Choppy Markets
The EMA’s greatest strength—its sensitivity—becomes its biggest liability in the wrong market conditions. During choppy, sideways markets where the price is just bouncing around without a clear direction, the EMA gets messy. It will constantly cross back and forth over the price, firing off a series of false buy and sell signals. We call these whipsaws.
This is where a lot of new traders get chewed up. They chase one signal, then the next, racking up small losses that can bleed an account dry surprisingly fast. The EMA is a trend-following tool; when there's no trend to follow, it just reflects the market's indecision.
The cardinal rule for using an EMA is to first figure out what the market is doing. If the price is stuck in a tight range, EMA signals should be taken with a huge grain of salt—or ignored completely.
A deep-dive analysis of the EMA's performance on 30 Dow Jones stocks over an eight-year period exposed this exact weakness. The study revealed a shockingly low win rate of just 7%, mostly because the indicator got chopped to pieces in non-trending markets. You can learn more about these findings and why a multi-indicator approach is so critical.
Avoiding Pitfalls with a Confirmation-Based Strategy
So, how do you sidestep these traps? Simple: never, ever rely on a single EMA signal in isolation. Instead, you need to build a system that demands confirmation from other, non-correlated indicators. This creates a much stronger filter for your trade ideas.
Here are a few ways to get that confirmation:
- Momentum Oscillators: Pair the EMA with something like the Relative Strength Index (RSI) or the Moving Average Convergence Divergence (MACD). For example, before you take a bullish EMA crossover, check if the RSI is also showing strength (like being above 50) and isn't screaming "overbought."
- Volume Analysis: A real breakout or trend has fuel behind it, and that fuel is volume. If your EMA signals a buy but volume is pathetic or dropping off, that's a massive red flag. It tells you there's no real conviction behind the move.
- Market Structure: Always respect classic price action. Is the market making higher highs and higher lows (an uptrend)? Or is it making lower highs and lower lows (a downtrend)? An EMA signal that flows with the existing market structure is infinitely more reliable than one that tries to fight the current.
By demanding this "confluence" of signals, you filter out the low-probability noise that plagues choppy markets. This discipline is what turns the EMA from a potential trap into a dependable part of your trading toolkit.
Common Questions About Trading With the EMA
Even when you feel like you've got a handle on the exponential moving average, questions always pop up in the heat of a live trade. Let's tackle some of the most common ones traders ask to help you navigate real-world scenarios with more confidence.
What Are the Best EMA Settings for Day Trading?
When you're day trading, you live and die by speed. That's why most intraday traders lean on shorter-term EMAs to catch quick price moves. You'll often see settings like the 9, 12, 21, and 26-period EMAs pop up on day trading charts.
A classic day trading tactic is to watch for a crossover, like the 9-period EMA slicing up through the 21-period EMA, as a potential entry signal. But there's no magic number here. The "best" setting really boils down to the volatility of what you're trading and your personal strategy. The only way to know for sure is to backtest different periods and see what actually performs for your market and timeframe.
Can the EMA Predict the Future?
Absolutely not. It's crucial to remember that the EMA is a lagging indicator, not a crystal ball. It’s built using past price data, which means it will always be a step behind the current price action. Its job isn't to tell you where the price is going tomorrow.
Instead, think of the EMA as a tool for clarifying the present. It smooths out the noise to give you a clearer picture of the current trend and its momentum. Traders use it to confirm the trend's direction, spot dynamic support and resistance levels, and generate signals based on what the market is doing right now.
How Do I Handle Contradictory Signals?
Contradictory signals between indicators aren't a problem to be solved; they're a warning to be heeded. If your EMA is screaming "buy" but your RSI is flashing "overbought," that's a major red flag. This kind of divergence often hints that a trend is running out of steam.
When you see conflicting signals, the smartest thing to do is nothing. Just wait. The best trading setups are built on confluence—that's when multiple, non-related indicators all point to the same conclusion. Acting on a single indicator, especially when other tools are telling you the opposite, is just asking for trouble.
Ready to put these EMA strategies to the test? ChartsWatcher gives you the screener, alerts, and charting firepower you need to find and act on high-probability setups. Start scanning the markets with precision today at chartswatcher.com.
