A Trader's Guide to the Simple Moving Average
If you've spent any time looking at stock charts, you've probably seen the Simple Moving Average (SMA). It’s one of the most fundamental tools in a trader's arsenal, designed to cut through the day-to-day "noise" of price swings and give you a clearer view of the underlying trend.
Think of it as a way to smooth out the chaotic zig-zags of a price chart into a single, flowing line that reveals the bigger picture.
What Is a Simple Moving Average in Trading

Imagine trying to figure out if you're speeding up or slowing down by looking at a car's speedometer that's jumping around erratically every second. It’s tough, right? The Simple Moving Average is like your chart's cruise control—it averages out those wild swings to show you a steady, more understandable speed. In this case, that "speed" is the market's trend.
Instead of getting bogged down by every minor price spike and dip, the SMA plots a single line representing the average closing price over a specific period, like 10, 50, or 200 days. This smoothed-out perspective is a cornerstone of technical analysis for a few powerful reasons:
- Trend Identification: It makes it instantly obvious whether a stock is in an uptrend, downtrend, or just chopping sideways.
- Support and Resistance: Traders often watch the SMA line as a dynamic level where prices might bounce during an uptrend (support) or stall out during a downtrend (resistance).
- Signal Generation: When the price crosses an SMA, or when a short-term SMA crosses a long-term one, it can signal a potential shift in momentum—a trigger for entering or exiting a trade.
The Trade-Off Between Smoothness and Lag
The real magic of the SMA is its simplicity, but that simplicity comes with a trade-off. A longer-period SMA, like the 200-day, creates a beautifully smooth line that isn't easily fooled by short-term volatility. The downside? It's slow to react to new price action.
On the other hand, a shorter 10-day SMA hugs the price much more closely, giving you faster signals. But this responsiveness means it can also get whipsawed in choppy markets, generating a lot of false alarms.
The lag of an SMA isn't just a feeling; it's mathematical. The average lag is calculated as (n+1)/2, where 'n' is the number of periods. So, a 5-period SMA has an average lag of 3 periods, while an 11-period SMA lags by 6 periods.
Even with this built-in delay, the SMA remains a go-to indicator for traders who want to make sure they're trading with the market's primary current, not against it. To build on these concepts, it's worth exploring broader technical analysis trading tips and charting trends that show how indicators like the SMA fit into a complete strategy.
How to Calculate the Simple Moving Average

Despite its power, the math behind the simple moving average is refreshingly simple. There are no complex formulas or scary Greek letters—it's just basic arithmetic you could do with a pencil and paper. This simplicity is a big part of what makes it such a timeless and reliable tool for traders.
At its heart, the SMA calculation is just two steps: add up the closing prices for your chosen number of periods, then divide by that number. That's it. The result is a single value representing the average price, or the "center of gravity," for that specific window of time.
Let's break it down with a clear example.
A Basic 5-Day SMA Example
Imagine you want to calculate a 5-day SMA for a stock. All you need to do is grab the closing prices for the last five trading days, add them together, and divide the total by five.
Let's say a stock had the following closing prices over a week:
- Day 1: $10
- Day 2: $11
- Day 3: $12
- Day 4: $13
- Day 5: $14
First, you sum those prices up: $10 + $11 + $12 + $13 + $14 = $60. Next, you divide that sum by the number of days, which is 5.
The math is just $60 / 5 = $12. And there you have it. The 5-day simple moving average at the close of Day 5 is $12. This value becomes the very first point plotted on your SMA line.
Visualizing the Moving Calculation
Now for the magic—the "moving" part of the moving average. As a new day begins and ends, we add its new closing price to our calculation but, critically, we also drop the oldest price. This constant refresh ensures the average always reflects the most recent market action.
Let's continue our example. On Day 6, the stock closes at $15. To get the new 5-day SMA, we drop the price from Day 1 ($10) and add the price from Day 6 ($15).
Our new set of prices is now: $11, $12, $13, $14, and $15.
The new sum becomes $11 + $12 + $13 + $14 + $15 = $65. Dividing this by 5 gives us a new SMA of $13. This process repeats every single day, creating the smooth, continuous line you see on a chart.
The core idea of the SMA is to always reflect the average price over the most recent period you've defined. By discarding old data, it ensures the indicator stays relevant to current market action rather than being anchored to the distant past.
To see this rolling calculation in action, let's map it out in a table.
Step-by-Step 5-Day SMA Calculation Example
This table shows exactly how the SMA value shifts as each new day's data is added and the oldest day's data is removed from the set.
| Day | Closing Price | 5-Day Sum | 5-Day SMA |
|---|---|---|---|
| 1 | $10 | N/A | Not enough data |
| 2 | $11 | N/A | Not enough data |
| 3 | $12 | N/A | Not enough data |
| 4 | $13 | N/A | Not enough data |
| 5 | $14 | $60 | ($10+$11+$12+$13+$14) / 5 = $12.00 |
| 6 | $15 | $65 | ($11+$12+$13+$14+$15) / 5 = $13.00 |
| 7 | $16 | $70 | ($12+$13+$14+$15+$16) / 5 = $14.00 |
As you can see, the average "moves" up from $12 to $14 over three days, smoothly following the rising price trend. This dynamic updating is what makes the SMA so useful for tracking market sentiment.
For a real-world example, a 5-day SMA calculated on recent closing prices of $153.83, $151.60, $152.87, $150.59, and $148.50 would yield an SMA of $151.48. You can explore more on SMA calculation methods to see how different timeframes change the indicator's behavior.
Thankfully, you'll rarely need to do this math yourself. Modern charting platforms like ChartsWatcher crunch all the numbers instantly, letting you focus on what really matters: interpreting the signals and building a solid trading strategy.
How to Interpret SMA Signals for Trading
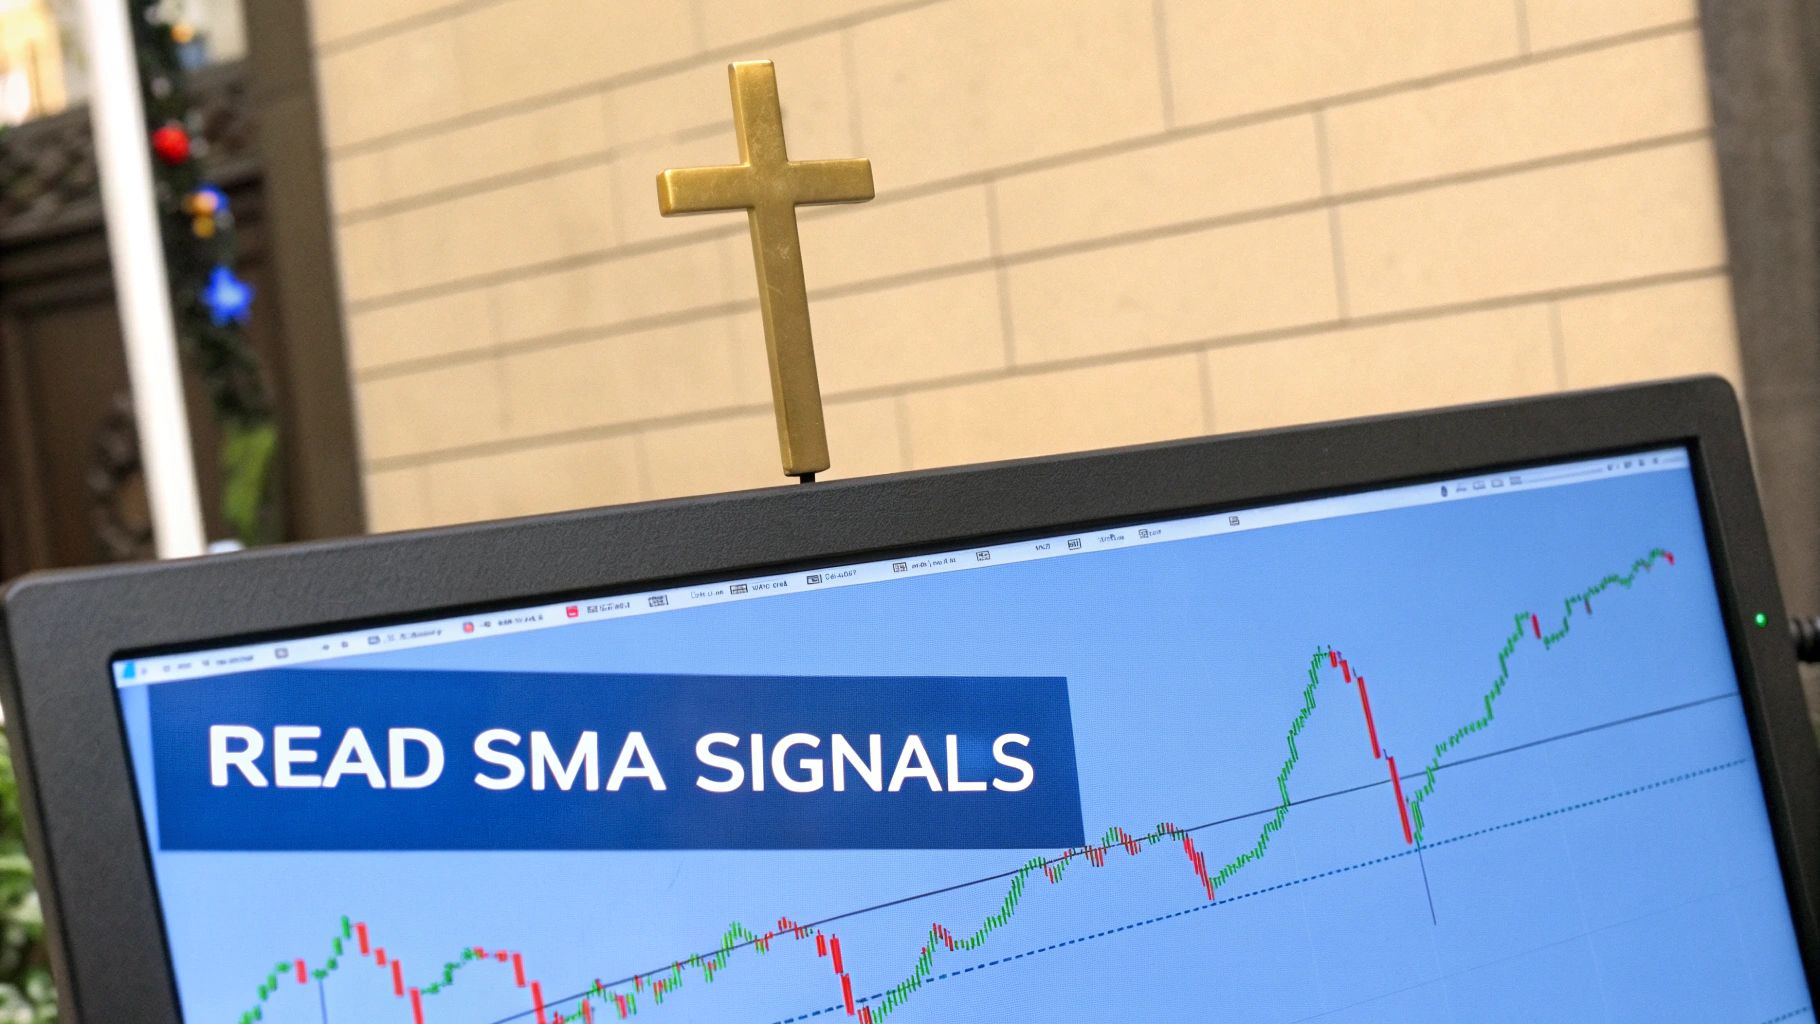
Knowing how to calculate a simple moving average is one thing, but learning to read the story it tells on your charts is where the real magic happens. The SMA isn’t just a line; it’s a visual map of market consensus over a set period. Once you can interpret its signals, you move from just watching the market to making informed trading decisions.
The most basic signal is trend identification. Is the market bullish or bearish? The SMA gives you a clean, visual answer.
When an asset's price consistently trades above its simple moving average, it's a strong sign of an uptrend. On the flip side, when the price is consistently below the SMA, it points to a clear downtrend. The angle of the SMA itself gives you extra clues; a steeply rising SMA suggests powerful bullish momentum, while a falling one indicates the bears are in control.
Using the SMA as Dynamic Support and Resistance
Beyond just showing the trend's direction, the SMA line often acts as a dynamic level of support or resistance. Think of it as a moving floor or ceiling that adjusts to the market's flow.
In a healthy uptrend, it's very common to see the price pull back and "bounce" right off the SMA line before marching higher. In this case, the SMA is acting as dynamic support. Traders will often watch these bounces for potential low-risk entries to jump into the trend.
Conversely, during a downtrend, the price might rally up to the SMA only to get rejected and pushed back down. Here, the SMA is acting as dynamic resistance. These retests of the SMA can be great opportunities for traders looking to open short positions.
The Power of SMA Crossovers
One of the most popular and powerful ways to generate trade signals is through SMA crossovers. This strategy involves watching how the price interacts with the SMA line, or how two different SMAs interact with each other. These crossovers can flag a potential change in the market's direction.
There are two main types of crossovers to keep an eye on:
- Price Crossovers: This is the simplest signal. A bullish signal flashes when the price crosses from below the SMA to above it. A bearish signal happens when the price crosses from above the SMA to below it.
- Moving Average Crossovers: This involves putting two SMAs on your chart—a short-term ("fast") one and a long-term ("slow") one. Signals are generated when the faster SMA crosses the slower one, pointing to a shift in momentum. To really dive deep, check out our guide on how to master the moving averages crossover strategy for profitable trading.
The most famous of these strategies are the "Golden Cross" and the "Death Cross," which are watched closely by traders and analysts across every market.
Identifying the Golden Cross and Death Cross
These two classic patterns are long-term signals that use the 50-day SMA and the 200-day SMA. They're considered a big deal because they reflect major shifts in market sentiment over both the medium and long term.
A Golden Cross occurs when the shorter-term 50-day SMA crosses above the longer-term 200-day SMA. This is a classic bullish signal, suggesting that momentum is shifting to the upside and a new, sustained uptrend may be starting.
This pattern is often seen as confirmation that a bear market might finally be over and a new bull market is getting underway. Many long-term investors actually wait for a Golden Cross before deploying serious capital.
The bearish counterpart is just as powerful.
A Death Cross happens when the 50-day SMA crosses below the 200-day SMA. This is a potent bearish signal that indicates a potential shift from a bull to a bear market, signaling that a major downtrend could be on the horizon.
Of course, no indicator is foolproof, and these signals aren't an exception. But they carry significant weight because of the long timeframes involved. They effectively filter out all the short-term market noise, focusing only on massive, macro-level changes in trend. By learning to interpret these simple yet effective signals, you can start building a solid framework for your trading decisions.
Choosing the Right SMA Period for Your Style
Picking the right period for a simple moving average is a lot like choosing the right tool for a job. You wouldn't use a sledgehammer to hang a picture frame, and you wouldn't use a tiny screwdriver to break up concrete. Neither tool is "better"—it all comes down to what you're trying to accomplish.
In trading, there's no magic number for the "best" SMA period. The perfect setting is entirely dependent on your personal trading style and goals. What works wonders for a long-term investor analyzing a decade-long trend will be totally useless for a day trader who needs to react in seconds.
Short-Term SMAs for Active Traders
For day traders and short-term swing traders, it's all about speed. You need an indicator that keeps up with the market's latest moves to help you jump on small, quick opportunities. This is where short-term SMAs, like the 10-period or 20-period, really come into their own.
These "fast" moving averages hug the price action tightly. When the price zigs, they zig right along with it, giving you timely signals for getting in and out of trades.
- 10-Period SMA: This one is extremely sensitive. It's a favorite among scalpers and day traders working on hyper-short timeframes, like 1-minute or 5-minute charts.
- 20-Period SMA: A very popular choice for swing traders, the 20-period SMA offers a nice balance between being responsive and filtering out some of the noise on daily or 4-hour charts.
The biggest downside? Their sensitivity can lead to "whipsaws." In a choppy, sideways market, the price can cross back and forth over a short-term SMA repeatedly, generating a flurry of false signals that can lead to a string of frustrating little losses if you're not careful.
Long-Term SMAs for Investors
Investors are playing a completely different game. They couldn’t care less about the daily price chatter; they're focused on identifying and riding major, multi-month or even multi-year trends. For this bigger-picture view, the heavy hitters are the 50-period, 100-period, and the legendary 200-period SMAs.
These "slow" moving averages smooth out the price action significantly, effectively ignoring minor corrections and daily volatility. They act as a steady hand, guiding you on the market's primary direction.
A classic rule of thumb on Wall Street is that a stock trading above its 200-day simple moving average is in a healthy, long-term uptrend. In fact, many large institutional funds won't even consider buying a stock that’s trading below this critical level.
While long-term SMAs are fantastic for confirming the big trend, they are far too slow for timing short-term trades. Their built-in lag means that by the time a crossover signal finally appears, a big chunk of the move might have already happened. To dig deeper into this specific indicator, check out our trader's guide to the 200-day moving average.
Using Multiple SMAs with Ribbons
But why limit yourself to just one? Many of the sharpest traders get the most value by layering multiple SMAs onto a single chart. This technique, called creating moving average ribbons, gives you a much richer, more nuanced view of the market's health.
A moving average ribbon is simply a collection of several SMAs with different periods (for instance, 10, 20, 30, 40, 50, and 60) all plotted on the same chart. The visual effect is a "ribbon" that expands and contracts based on momentum.
- Trend Strength: When the ribbon's lines are spread far apart, parallel, and pointing in the same direction, it’s a clear sign of a strong, healthy trend.
- Trend Weakness: When the lines start to squeeze together or get tangled up, it’s a warning that the trend is losing steam. A reversal or a period of choppy consolidation might be just around the corner.
This method lets you see short-term, medium-term, and long-term sentiment all at once, making it easier to align your trades with the market's true character. The key is to experiment with different combinations until you find a setup that perfectly matches your trading horizon and style.
Building Automated SMA Trading Strategies
Knowing what a simple moving average is and how it works is one thing. Actually turning that knowledge into a systematic, repeatable trading process is what separates the casual chart-watchers from the pros. This is where automation comes in.
The goal isn't just to find one or two setups; it's to build a machine that executes your strategy with precision, removes the emotional guesswork, and saves you from staring at charts all day. We're turning rules into a system that actively works for you, bringing the best opportunities directly to your doorstep.
Setting Up Real-Time SMA Alerts
First things first: you need alerts. Think of an alert as your personal trading assistant, tapping you on the shoulder the moment a specific event happens. This frees you up to do other things, confident you won't miss a critical move. Modern platforms like ChartsWatcher are built for this.
Let's take a classic strategy: you want to know when a stock’s price crosses above its 50-day simple moving average. Good luck checking your entire watchlist for that manually—it's next to impossible. Instead, you can build an alert in seconds.
- Trigger: Price
- Condition: Crosses Above
- Value: 50-Day SMA
- Universe: Your personal watchlist or an entire index (like the S&P 500)
Once you set this up, the system does the heavy lifting. The instant a stock meets your criteria, you get a notification. Now you can pull up the chart and analyze the setup right away, not hours later.
The real power of alerts is efficiency. A well-designed alert system acts as your personal market analyst, working 24/7 to ensure you never miss a high-potential setup that aligns with your specific trading rules.
Building Custom Scans for SMA Patterns
Alerts are perfect for the stocks you're already watching. But what about the ones you don't even know exist? That's where scans come in. A stock scanner is a powerful filter that sifts through thousands of stocks to find the handful that perfectly match your criteria. This is how you discover hidden gems.
Let's say you're looking for stocks showing strong bullish momentum, specifically those in a "Golden Cross" pattern. That's when the shorter-term 50-day SMA crosses above the longer-term 200-day SMA.
In a tool like ChartsWatcher, your scan recipe would look something like this:
- Index Membership: Stock must be in the NASDAQ 100.
- SMA Crossover Condition: The 50-Day SMA crossed above the 200-Day SMA within the last 5 trading days.
- Volume Filter: Average daily volume is greater than 500,000 shares (this ensures you can get in and out easily).
- Price Filter: Stock price is above $10 to weed out penny stocks.
Running this scan takes just a few seconds and gives you a clean, actionable list of stocks to investigate further. It's a systematic approach that beats random chance every time.
How you choose your SMA periods really comes down to your trading style, as this chart shows.
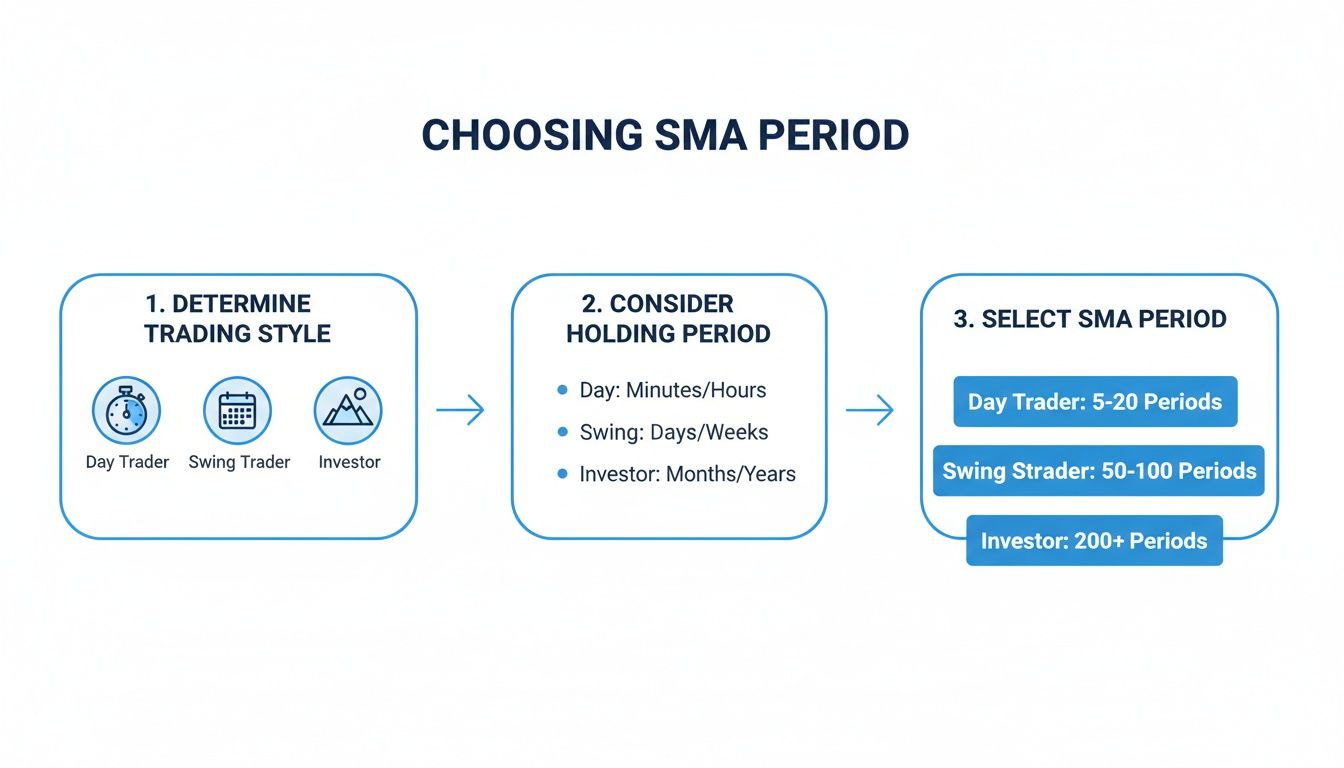
Short-term day traders need fast SMAs to react quickly, while long-term investors lean on slower, more stable ones to guide their bigger-picture decisions.
Backtesting Your SMA Strategies
So you've built your alerts and scans. Great. But how do you know if the strategy is any good? The answer is backtesting. This is where you run your trading rules on historical data to see how they would have performed in the past. It’s like taking your strategy for a test drive before putting real money on the line.
You could take that same Golden Cross strategy and backtest it over the last 10 years of market data. A backtesting engine would simulate every single trade, spitting out crucial performance metrics:
- Total Profit/Loss: Did it actually make money?
- Win Rate: What percentage of trades were winners?
- Max Drawdown: What was the biggest losing streak? This tells you about the strategy's risk.
- Profit Factor: The gross profit divided by the gross loss—a key measure of performance.
Maybe your results show the Golden Cross works, but it's prone to false signals in choppy markets. This is invaluable information! You might then decide to add an RSI filter to avoid buying into overbought conditions. Backtesting lets you test that hypothesis with hard data, not just a hunch.
For traders serious about building these kinds of robust, automated systems, resources from firms like Trading Bot Experts can offer deeper insights. This disciplined cycle of alerting, scanning, and backtesting is truly the bedrock of any durable and successful trading system.
Common SMA Trading Mistakes to Avoid
The simple moving average is an incredibly handy tool, but it's no crystal ball. Just like any indicator, it has its weak spots. Falling into a few common traps can lead to a string of frustrating losses and missed opportunities, so knowing the pitfalls is just as crucial as reading the signals themselves.
The absolute worst environment for any SMA strategy is a choppy, sideways market. When prices are just bouncing around without a clear direction, the SMA's trend-following ability completely breaks down. The price will constantly zigzag above and below the line, firing off a series of false buy and sell signals. This is what traders call getting "whipsawed," and acting on every one of these signals is a surefire way to bleed your account dry from a thousand small cuts.
Forgetting the SMA Is Reactive Not Predictive
Another classic blunder is treating the SMA like it can predict the future. It can't. The SMA is a reactive indicator—it only shows you an average of what has already happened. By its very nature, it will always lag behind the real-time price.
Expecting an SMA to nail exact market tops and bottoms is a recipe for disappointment. Its real job is to confirm that a trend is already in motion, not to predict when it will start.
You might think that different types of moving averages would give wildly different results. The truth is, when you adjust them for the same amount of lag, they behave remarkably alike in strong trends. For example, an 11-period SMA and an 11-period EMA with the same 5-month lag will track each other very closely. To see just how consistent these indicators can be with real data, you can explore more research on moving average consistency.
Trading with the SMA in Isolation
This is probably the biggest mistake of all: using the SMA as your one and only reason to enter a trade. No single indicator should ever be used in a vacuum. A stock crossing above its 50-day SMA might look like a great buy signal, but what if an oscillator like the RSI is screaming "overbought"? That could be a classic bull trap.
To stack the odds in your favor, always look for confirmation from other tools in your arsenal.
- Check Your Oscillators: Pair the SMA with a momentum indicator like the RSI or MACD. A valid SMA crossover should be backed by strengthening momentum.
- Look at the Volume: A real breakout or breakdown across an SMA should happen on a significant spike in trading volume. No volume means no conviction.
- Zoom Out: Before you jump on a signal from your daily chart, take a peek at the weekly chart. You always want to be trading in the direction of the bigger, primary trend.
Common Questions About the Simple Moving Average
To wrap things up, let's tackle a few of the most common questions traders have when they start using the simple moving average. Getting these concepts down will help you put the SMA to work with a lot more confidence.
Which Moving Average Is Best for Day Trading?
For day trading, speed is the name of the game. Because the simple moving average gives equal weight to all its data points, some traders find it a bit too slow for really fast-moving, intraday markets. This is why many day traders lean towards the Exponential Moving Average (EMA), which puts more emphasis on the very latest price action, giving you quicker signals.
That said, a very short-term SMA (like a 5-period or 10-period) is still a perfectly good tool for spotting trends on lower-timeframe charts. It all comes down to matching the indicator's speed to how quickly you need to make decisions.
Can the SMA Predict Future Prices?
This is a big one, so let's be crystal clear: no, the SMA cannot predict the future. It’s a reactive indicator, sometimes called a trend-following tool. All it does is show you an average of what has already happened. Its job isn't to tell you where the price will go next, but to help you confirm the direction and strength of the trend we're in right now.
Think of the SMA as a rearview mirror, not a crystal ball. It gives you valuable context about where the market has been, which helps you make smarter decisions about where it might be going. But it offers zero guarantees.
How Do I Avoid False Signals from the SMA?
False signals, or "whipsaws," are the biggest headache when using any moving average, and they pop up most often in choppy, sideways markets where there's no clear trend. The best way to cut them down is to never, ever take an SMA signal in isolation. Always look for confirmation from other tools.
- Bring in an Oscillator: Pair the SMA with an indicator like the RSI or MACD. If you get a buy signal from your SMA crossover, you want to see momentum building on the oscillator to back it up.
- Check the Higher Timeframes: A buy signal on the daily chart is much more powerful if the weekly chart is also showing a clear uptrend. This keeps you trading with the bigger picture in mind.
- Look at the Volume: A real trend change or a true breakout should happen on a spike in trading volume. If you see a crossover on whisper-quiet volume, be skeptical.
By adding these simple layers of confirmation, you can filter out a ton of market noise and focus on the trading setups that have a much higher chance of working out.
At ChartsWatcher, we help traders turn these concepts into concrete strategies. Our advanced scanning and backtesting tools let you build, test, and automate your simple moving average systems with real data. Stop guessing and start trading with an edge by visiting https://chartswatcher.com today.
