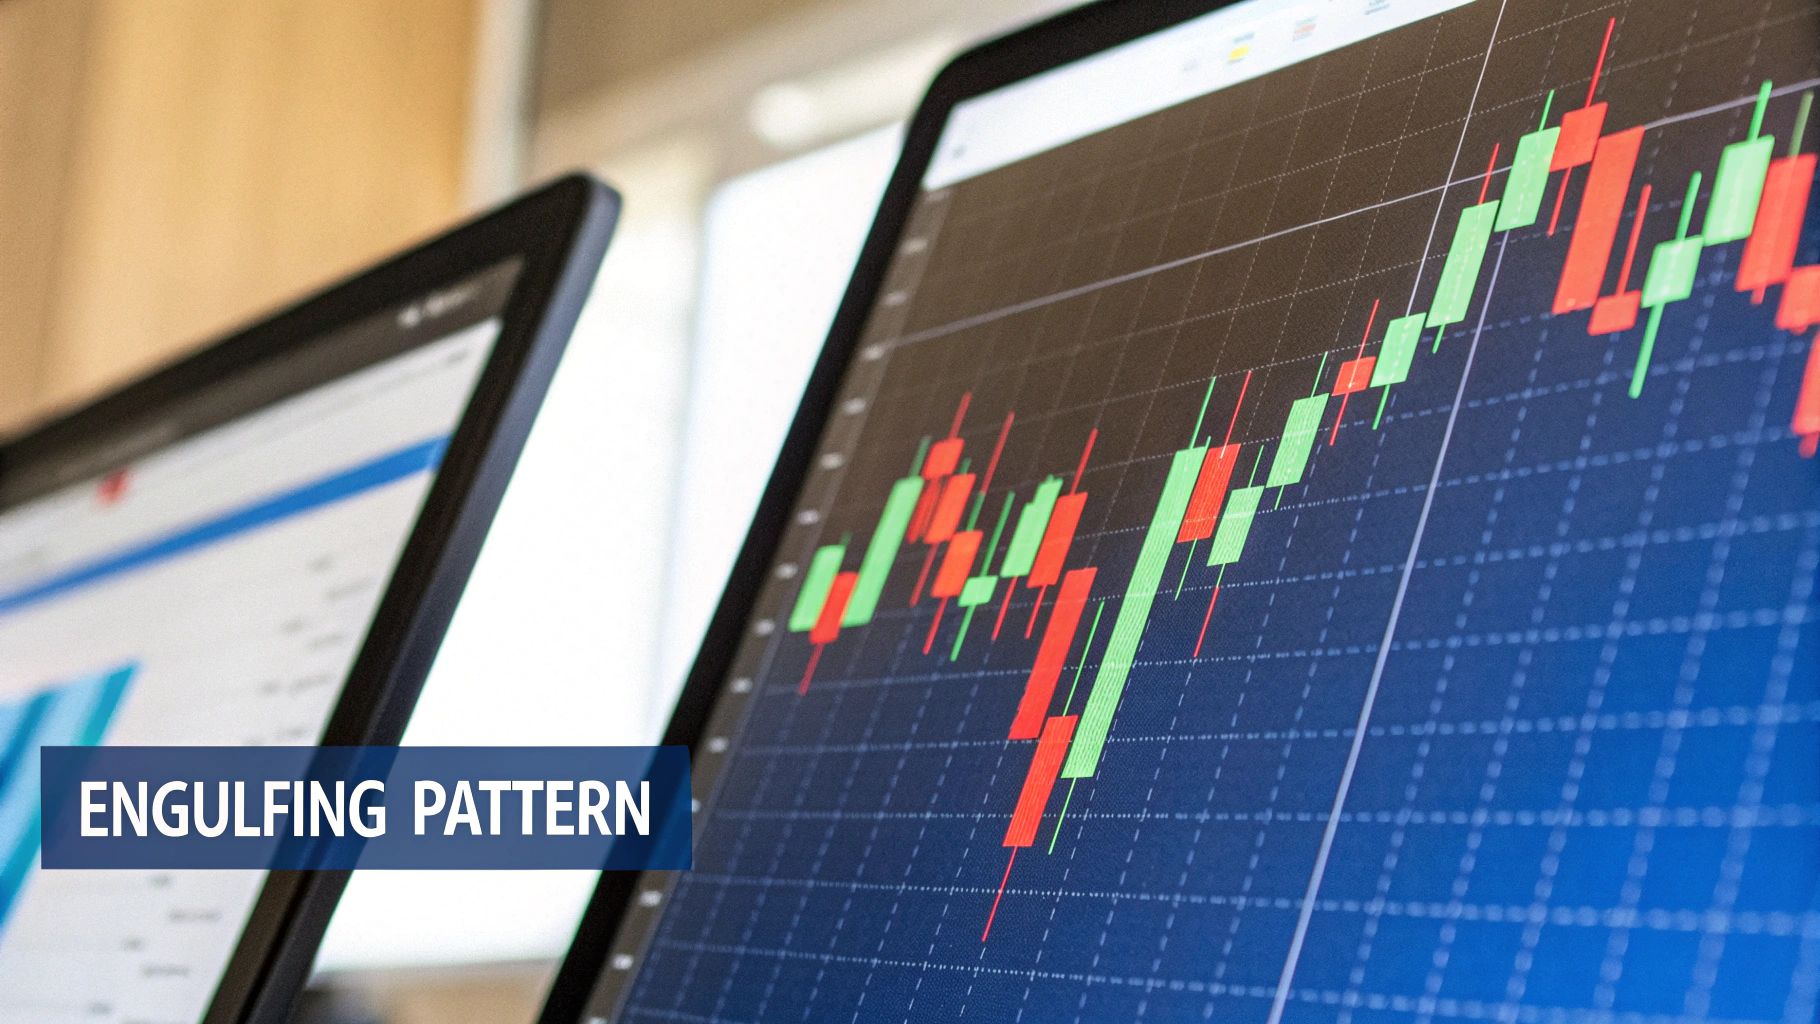
A Trader's Guide to the Engulfing Pattern Candlestick
An engulfing pattern is one of the most powerful two-candle signals you’ll find on a chart, often screaming that a trend reversal might be just around the corner.
At its core, the pattern shows up when the second candle's body completely "engulfs," or swallows, the body of the candle right before it. This isn't just a random blip; it’s a sign of a dramatic and sudden shift in control between buyers and sellers. For technical traders, learning to spot this cue is fundamental.
Decoding the Power Shift in Candlestick Charts
Think of a market trend like a game of tug-of-war. For a while, one team is clearly winning, pulling the rope steadily in their direction. Then, out of nowhere, the other team musters a massive burst of strength and yanks the rope way back, completely overwhelming their opponents in one decisive pull.
That’s exactly what an engulfing pattern represents on a price chart.
It’s not just a shape; it's a short story about a forceful change in market sentiment. Getting comfortable with this pattern is a huge step toward really understanding price action. (If you're still new to candles, our guide to understanding candlestick graphs is a great place to start.)
This powerful signal comes in two distinct flavors, each telling a different story.
The Two Core Types of Engulfing Patterns
The direction of the trend leading into the pattern is what determines which type of engulfing pattern you'll see. One signals buyers are taking over, while the other signals the sellers have seized control.
Here’s a simple side-by-side to make the distinction crystal clear.
Bullish vs Bearish Engulfing Pattern At a Glance
| Characteristic | Bullish Engulfing Pattern | Bearish Engulfing Pattern |
|---|---|---|
| Prior Trend | Downtrend | Uptrend |
| First Candle | Small and bearish (red) | Small and bullish (green) |
| Second Candle | Large and bullish (green) | Large and bearish (red) |
| What It Signals | Buyers have overwhelmed sellers | Sellers have overwhelmed buyers |
| Potential Outcome | The downtrend may be reversing | The uptrend may be reversing |
As you can see, they are perfect mirror images of each other, signaling opposite outcomes.
A Bullish Engulfing Pattern pops up at the bottom of a downtrend. You’ll see a small bearish candle followed by a much larger bullish one that completely wraps around the first. This is a classic sign that buyers have stormed in with overwhelming force, possibly marking the end of the downtrend.
Conversely, a Bearish Engulfing Pattern forms at the top of an uptrend. Here, a small bullish candle gets dwarfed by a massive bearish candle that follows it. This tells you the sellers have wrestled control away from the buyers, and the uptrend could be running out of gas.
The bearish engulfing pattern, in particular, is a signal that demands attention. Some statistical analyses have shown that it has a historical bearish reversal rate of around 79%. A number that high suggests that in nearly eight out of ten cases, the market heads downward after the pattern appears, making it a favorite among traders looking to spot a top.
Key Takeaway: The engulfing pattern's real strength lies in how clearly it visualizes a shift in power. A simple rule of thumb: the bigger the second candle is compared to the first, the more significant the potential reversal.
The Market Story Behind the Pattern

To really get a feel for the engulfing pattern candlestick, you have to see it as more than just a couple of bars on a chart. Think of it like a two-act play, a short but intense story that captures a dramatic power struggle between buyers (the bulls) and sellers (the bears). Once you learn to read this narrative, you can understand the market psychology that makes this pattern so powerful.
This isn't just about red and green shapes. It's about confidence, fear, and a sudden, decisive shift in who’s in control. Let's break down the plot for both scenarios.
The Bullish Takeover
Picture a market that’s been in a steady downtrend. For days, maybe weeks, sellers have been running the show, pushing prices lower without much resistance. The mood is gloomy, and the charts reflect this with a string of bearish candles. The first candle of our pattern is just another one of those—a small, bearish candle that seems to say, "more of the same."
But then, the second act kicks off. The next trading session opens, and something feels different. A huge wave of buyers storms the market, seemingly out of nowhere. They don't just stop the bleeding; they completely reverse it, absorbing all of the previous day's selling pressure and then some, driving the price well above the prior day's high.
This huge second candle completely "engulfs" the first one, telling a very clear story:
- Act I: Sellers are confident and in control, pushing prices down.
- Act II: Buyers launch a surprise attack with overwhelming force, erasing the sellers' gains and seizing command.
This swift and total rejection of lower prices is a powerful signal that the downtrend might have finally run out of steam.
The Bearish Ambush
Now, let's flip the script. The market is in a healthy uptrend. Buyers are feeling good, pushing prices to new highs, and the overall sentiment is optimistic. The first candle in the pattern is a small bullish one, looking like just another step up the ladder. Everything points to the rally continuing.
Suddenly, the plot twists. The next session opens, and sellers emerge with an ambush. They stop the buyers in their tracks and start pushing prices down with serious conviction. The selling is so intense that by the end of the day, the price has not only wiped out all of the previous day's gains but has also closed well below where it started.
The massive bearish candle that forms completely swallows the prior bullish one. It’s a vivid picture of a rally that just hit a brick wall.
- Act I: Buyers are in charge, continuing the uptrend as expected.
- Act II: Sellers ambush the market, overpowering the buyers and slamming the price down hard.
This forceful rejection of higher prices is a loud-and-clear signal that the bulls have lost their momentum and a reversal could be imminent.
Key Insight: The engulfing pattern candlestick captures a moment of extreme emotional whiplash. It’s the visual proof of one side getting overconfident, only to be completely steamrolled by a sudden, powerful counterattack from the opposition.
The Role of Volume as Confirmation
This story gets even more compelling when you bring in a key piece of evidence: trading volume. Volume tells you how many shares or contracts were traded, acting as a conviction meter for any price move. A reversal pattern on low volume is like a whisper; one on high volume is a shout.
If that big, second candle of an engulfing pattern forms on a major spike in volume, it confirms that a ton of market participants were involved in that reversal. This high participation rate adds a huge amount of credibility to the power shift. It shows the move wasn't just a bit of market noise but a decisive battle won with overwhelming force, making the engulfing pattern candlestick a much more reliable signal to act on.
How to Identify Engulfing Patterns Accurately
Spotting an engulfing pattern seems easy at first, right? Just find a big candle that swallows the one before it. But if it were that simple, everyone would be a millionaire. This surface-level approach is a classic trap, often leading traders to jump on false signals that are nothing more than market noise.
To do this right, you have to think like a detective. You're looking for specific clues that confirm a real transfer of power between buyers and sellers, not just a random price blip. This means sticking to a strict set of rules—a sort of three-point checklist. If a pattern doesn't tick all three boxes, it's not a high-probability setup, and you should treat it with serious caution. This is what separates the pros from the rest.
The Three Pillars of a Valid Engulfing Pattern
Before you even think about placing a trade, a potential engulfing pattern has to pass three critical tests. These rules give the pattern the context and structure it needs to be a meaningful reversal signal.
-
A Clear Preceding Trend Must Exist: This is the big one, and it's the rule traders ignore most often. An engulfing pattern is a reversal signal. You can't reverse something that isn't moving in a clear direction. A bullish engulfing pattern needs to show up after a defined downtrend, and a bearish engulfing pattern must form after a solid uptrend. If the market is just chopping sideways, the pattern is completely meaningless.
-
The Second Candle’s Body Must Engulf the First: The "engulfing" part is literal. The real body of the second candle (the part between its open and close) has to completely swallow the real body of the first candle. Don't worry about the wicks or shadows; they can poke out. But the body-to-body relationship is non-negotiable.
-
The Colors of the Two Candles Must Be Opposite: This is the visual confirmation of the power shift. For a bullish reversal, the first candle must be bearish (red), followed by a bullish (green) one. For a bearish reversal, it’s the opposite: a green candle followed by a red one. This color change shows you that the opposing force didn't just show up—they took control.
This infographic breaks down this three-step validation process perfectly.
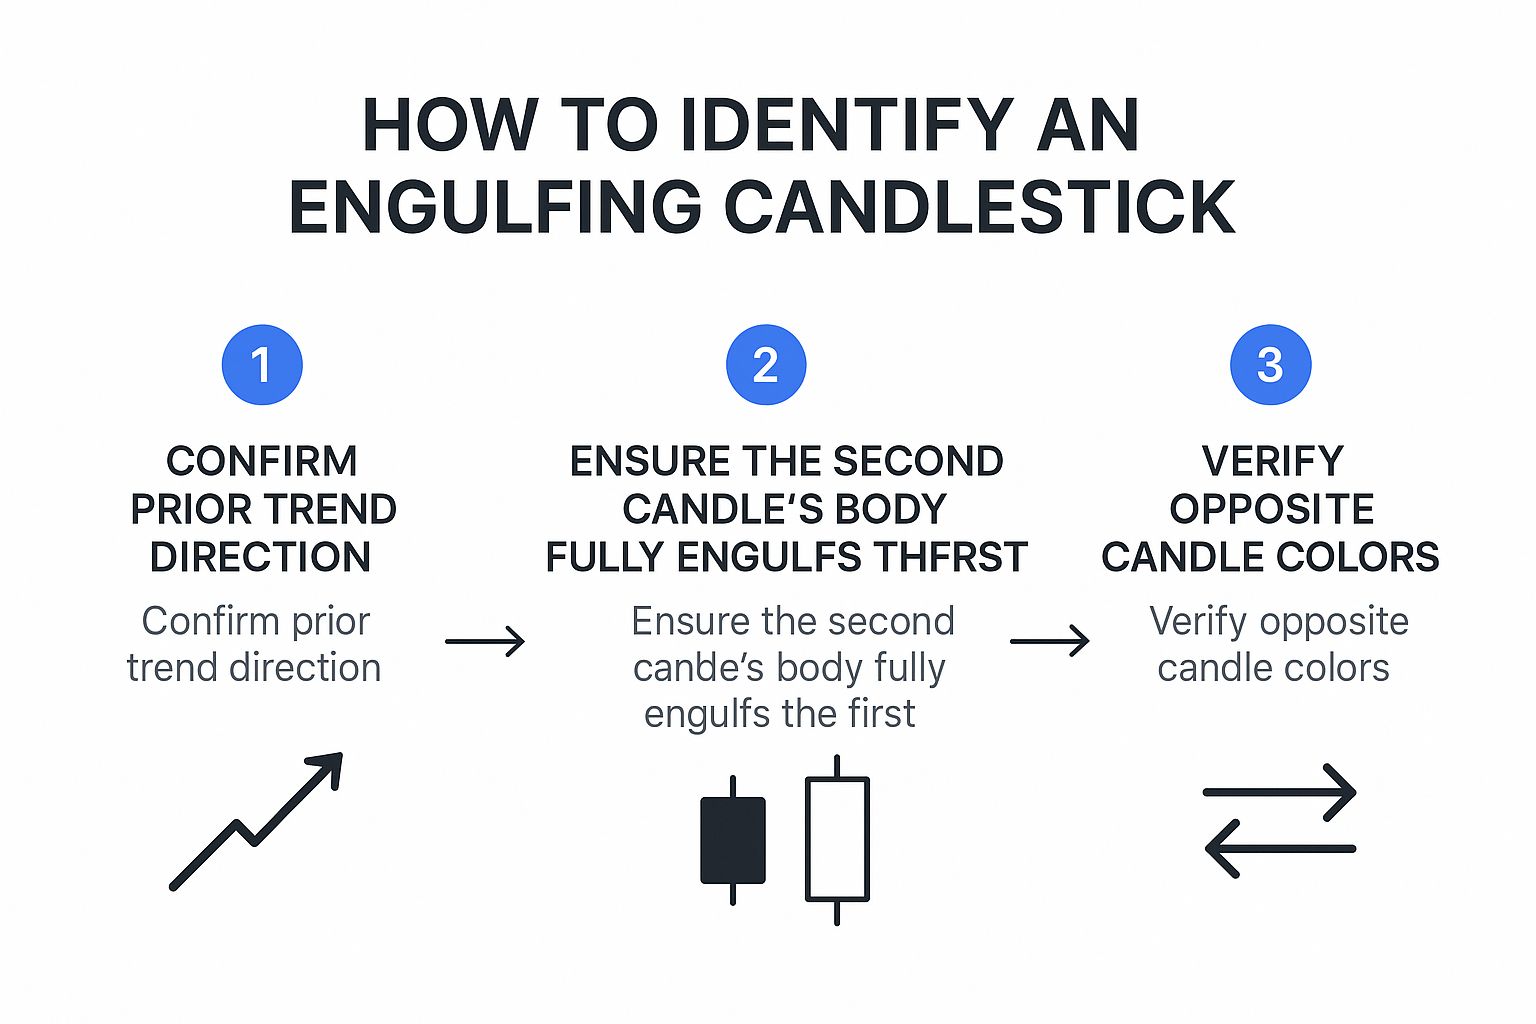
Always follow that sequence: check for the trend, confirm the engulfment, and verify the opposite colors. This discipline ensures you're only focusing on patterns with a solid technical foundation.
Real-World Examples Versus Lookalikes
Knowing the rules is one thing, but applying them on a live, messy chart is where it counts. Textbook examples are clean; real markets are not.
The screenshot here shows a picture-perfect bullish engulfing pattern that meets all our criteria. See how it forms after a clear downtrend? Notice how the big green body completely dwarfs the prior red body. The opposite colors seal the deal, signaling a powerful shift in momentum.
Key Insight: Context is everything. The preceding trend is what gives the engulfing pattern its predictive power. A pattern that appears in a sideways, choppy market is just two random candles, not a trading signal.
It's just as important to know what isn't a valid pattern. New traders often get tripped up by "almost" patterns because they relax the rules. They might trade a pattern where the second body is barely bigger than the first, or one that appears in a messy consolidation zone. These lookalikes are traps waiting to happen.
A common mistake is seeing a second candle that fails to fully engulf the first. Another trap is a pattern where both candles are the same color. These formations simply don't represent the decisive takeover that defines a true engulfing pattern candlestick and should be ignored. By being a stickler for the three rules, you filter out the noise and focus only on the setups that give you a real edge.
Trading the Bullish Engulfing Pattern
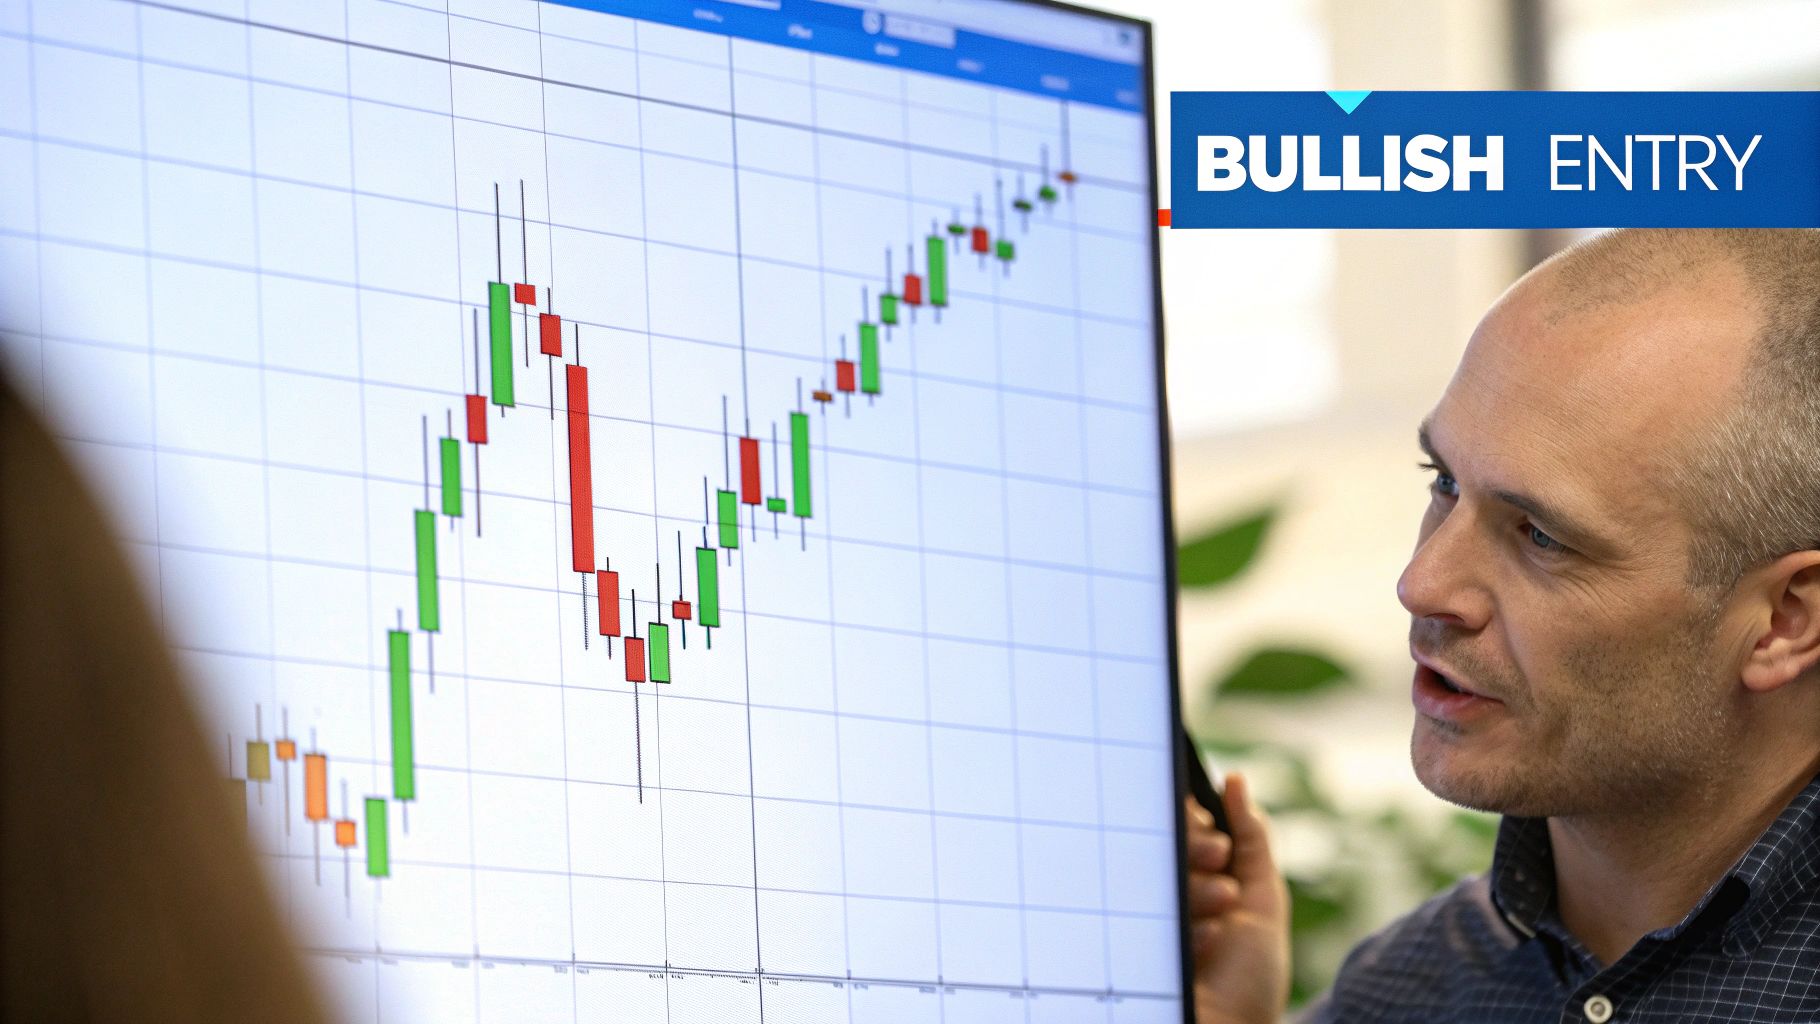
Spotting a bullish engulfing pattern is one thing, but turning that signal into a profitable trade is a different ball game. You need a rock-solid plan. We're not talking about guesswork here; we're talking about defining your exact entry point, managing your risk with a stop-loss, and knowing where you'll cash out before you ever put a dollar on the line.
Without these rules, you're not trading—you're gambling. Let’s build a complete framework for taking a trade off this powerful pattern, moving from chart theory to real-world application.
H3 Pinpointing Your Entry
The most straightforward way to enter a bullish engulfing trade is right around the close of that big green candle. By waiting for the candle to fully form, you get confirmation that the buyers held control all the way to the bell. Jumping in before the close is tempting, but it's an aggressive move that can backfire if sellers swoop in at the last minute and invalidate the pattern.
If you’re a bit more conservative, you can wait for the next candle to open. The idea is to enter once the price pushes slightly above the high of the engulfing candle. This gives you an extra layer of confirmation that the bullish momentum is continuing, but it comes at a cost—a slightly higher entry price, which can squeeze your potential profit margin.
Trader's Tip: It all boils down to your risk tolerance. An entry at the close gets you a better price but carries a little more uncertainty. An entry on the next candle gives you more confidence but might reduce your overall reward.
H3 Setting Your Protective Stop-Loss
This is non-negotiable. Your stop-loss is your safety net, the line in the sand where you admit the trade isn't working and get out to protect your capital. For the bullish engulfing pattern, the placement is crystal clear.
You should set your stop-loss just below the low of the entire pattern. Usually, this means placing it a few ticks under the low of the big green engulfing candle itself. This gives the trade some breathing room while ensuring that if sellers take back control and break that critical low, your losses are capped. Never, ever trade an engulfing pattern candlestick without a firm stop-loss in place.
H3 Defining Your Profit Targets
Knowing when to take your profits is just as crucial as knowing when to get in. Greed can turn a winning trade into a loser if you don't have a clear exit plan. Fortunately, there are a few reliable ways to set your targets.
- Look for Old Resistance: Scan to the left on your chart. Do you see any previous areas where the price struggled to break through? These old swing highs or zones of consolidation are natural places for the price to gravitate toward, making them perfect spots to take profit.
- Use a Measured Move: This technique uses the size of the pattern to project a potential target. For a detailed walkthrough of this strategy with examples, check out our comprehensive guide on trading bullish engulfing patterns.
- Target a Specific Risk-to-Reward Ratio: This is a classic money management approach. Aim for a profit target that is at least 1.5 or 2 times your risk. For example, if your stop-loss is $1 away from your entry, your first profit target should be at least $1.50 to $2.00 above your entry.
Let's look at a real-world example with Walmart (WMT). The stock formed a clean bullish engulfing pattern where the distance from the prior day's close to the engulfing candle's open was $2.30. By applying a measured move—adding that $2.30 height to the top of the pattern—a profit target of $149.61 was set. The stock hit that target just three trading sessions later, showing just how effective these simple rules can be.
Trading the Bearish Engulfing Pattern
Just as the bullish engulfing pattern screams "buy," its bearish twin is a powerful signal that it might be time to sell or cash out of a long position. Think of this pattern as the market slamming on the brakes after a strong rally. To trade it well, you can't just wing it; you need a solid plan.
A disciplined strategy for the bearish engulfing pattern candlestick is basically the mirror image of our bullish approach. It all comes down to a clear entry, tight risk control, and a pre-defined exit. A good trade isn't just about spotting the pattern—it's about executing your plan with precision. Let's walk through how to do it.
Executing the Short Entry
When a bearish engulfing pattern forms, it’s a clear sign that sellers have wrestled control from the buyers. The most common way to enter a short trade is right around the closing price of that big red engulfing candle. Waiting for the candle to close is key—it confirms that sellers held their ground for the entire session, which validates the reversal signal.
Some traders are a bit more cautious. They prefer to wait for extra confirmation by entering on the next candle, placing a short order just below the low of the bearish engulfing candle. This gives you a bit more certainty that the downward momentum is for real, but it also means getting in at a slightly lower price, which can affect your risk-to-reward ratio.
Placing the Protective Stop-Loss
Risk management is everything in trading. Without it, you're just gambling. Fortunately, with the bearish engulfing pattern, placing your stop-loss is pretty intuitive. Your stop should go just a few ticks above the high of the entire two-candle pattern.
This placement is non-negotiable. If the price breaks above the high of that engulfing candle, the whole bearish setup is invalidated. Setting your stop there ensures you get out immediately if the trade goes against you, keeping your loss small and defined.
Establishing Realistic Profit Targets
You should always know where you're getting out before you get in. Having a clear profit target stops you from making emotional decisions driven by greed or fear.
Here are three practical ways to set your profit targets:
-
Find Key Support Levels: Pan to the left on your chart and look for previous areas where the price found support. Old swing lows or zones of consolidation are natural price magnets and make for great initial profit targets.
-
Use Fibonacci Tools: For a more technical take, you can use Fibonacci retracement or extension tools. By drawing them from the start of the last uptrend to the high of the engulfing pattern, you can map out potential support levels where the price is likely to pause or reverse.
-
Aim for a Solid Risk-to-Reward Ratio: A simple but incredibly effective method is to set a target that's a multiple of your risk. If your stop-loss is $0.50 above your entry, a 2:1 risk-to-reward target would be $1.00 below it. This simple math ensures your winning trades are always bigger than your losing ones.
Key Takeaway: Never trade an engulfing pattern candlestick in a vacuum. You stack the odds in your favor by looking for confirmation from other signals, like a bearish divergence on the RSI or the price cracking below a key moving average. This confluence of signals turns a good setup into a great one.
Common Mistakes and How to Avoid Them
The engulfing pattern is a powerful signal, no doubt. But treating it like an infallible crystal ball is one of the fastest ways to drain your trading account.
Too many traders learn this the hard way. They spot a perfect-looking engulfing candle, jump into a trade expecting a massive reversal, and get stopped out moments later. Why? Because the pattern showed up in the middle of a choppy, directionless market where it meant absolutely nothing. It was just market noise, not a signal.
Let’s break down the most common blunders so you can learn to sidestep them.
Forgetting the Trend Context
This is the big one. The single biggest mistake is trading an engulfing pattern without a clear, pre-existing trend. Think about it: the pattern is a reversal signal by definition. It can’t reverse a market that's just drifting sideways.
- The Mistake: Seeing a bullish engulfing pattern in a range-bound market and betting the farm on a huge breakout.
- The Fix: Always confirm there's a clear downtrend before you even consider a bullish engulfing pattern. Likewise, you need a solid uptrend before a bearish engulfing pattern is worth a look. If there’s no trend, there’s no trade. Simple as that.
Another rookie error is trading without a stop-loss. An engulfing pattern gives you a logical place to define your risk—just below the low of a bullish pattern or just above the high of a bearish one. Trading without that safety net is like sailing into a storm without a life raft.
Treating the Pattern as a Standalone Signal
An engulfing pattern is a clue, a piece of evidence—it's not the final verdict. Relying on it and nothing else is a recipe for disaster. A surprise news announcement or a sudden jolt in market sentiment can blow any technical pattern out of the water in seconds.
A common misconception is that these patterns guarantee a reversal. They don't. They are probabilistic signals, and their effectiveness skyrockets when you use them as part of a complete trading plan.
Even under ideal conditions, the pattern can fail. Research has challenged the idea that these patterns always provide a reliable edge, especially in highly liquid markets dominated by institutions. A study on large-cap stocks in India, for example, found that while the engulfing pattern candlestick did produce some short-term returns, they weren't consistently significant. You can explore the full findings of this study to understand its nuances.
To avoid this pitfall, always look for confirmation. You need other clues to back up your trade idea. Look for things like:
- A spike in trading volume on the engulfing candle.
- The pattern forming at a major support or resistance level.
- An indicator like the RSI showing divergence.
By treating the pattern as one component of a larger strategy, you stop gambling and start trading.
Questions Traders Often Ask
Even when you feel like you've got the basics down, staring at a live chart brings up a whole new set of questions. It's totally normal. Answering these practical "what ifs" is what builds the confidence to actually pull the trigger on a trade. Let's tackle some of the most common ones.
What Is the Most Important Factor for a Valid Engulfing Pattern
If you remember only one thing, make it this: context. A bullish engulfing pattern means nothing if it’s just floating in a choppy, sideways market. It needs to show up after a clear, sustained downtrend. The same goes for a bearish engulfing—it's only powerful if it forms at the peak of an established uptrend.
Without that preceding trend, the pattern is just noise. The trend sets up the story—the exhaustion of one side and the dramatic takeover by the other. That’s where the pattern gets its predictive muscle.
Do the Shadows or Wicks of the Candles Matter
They absolutely do. While the core rule is that the second candle's body has to swallow the first one's body, the wicks (or shadows) add another layer to the story. For a truly dominant signal, you want to see the second candle's entire range—high to low, wicks included—completely engulf the first candle. This isn't a deal-breaker, but it's a sign of stronger conviction.
Think of it this way: the real battle happens over the real body, which shows the open and close prices. A big, fat engulfing body with tiny wicks is a knockout punch. If it has long wicks, it might suggest there was a fight and some indecision lingers.
How Can I Increase the Reliability of Engulfing Pattern Signals
Simple: never, ever trade the pattern in a vacuum. You can dramatically stack the odds in your favor by looking for a few friends to back up the signal.
Here are a few things to look for:
- High Volume: Did trading volume spike on that engulfing candle? A surge in volume is like a crowd roaring its approval of the reversal. It confirms strong money is behind the move.
- Key Levels: An engulfing pattern forming right at a major support or resistance level is the A+ setup. A bullish engulfing bouncing off a well-tested support line is far more potent than one appearing in the middle of nowhere.
- Indicator Confirmation: Get a second opinion from an oscillator like the RSI. For example, a bullish engulfing that coincides with the RSI climbing out of oversold territory is a much stronger signal.
When you start combining these elements, you're not just trading a pattern; you're trading a high-probability setup. This is how you filter out the weak signals and focus on the ones that count.
Ready to stop hunting for patterns manually? ChartsWatcher helps you find high-probability engulfing patterns across thousands of stocks in real time. Our scanning and charting tools give you the edge you need to act fast. Build your custom trading dashboard today at https://chartswatcher.com.
