A Trader's Guide to the Engulfing Candle Stick
An engulfing candle is one of the most powerful two-candle reversal patterns you'll find on a price chart. At its core, it’s a story of a sudden, dramatic takeover. The pattern forms when a smaller candle is followed by a much larger, opposing candle whose real body completely "engulfs" the body of the one before it.
This visual tells you everything you need to know: there's been a massive shift in control, either from sellers to buyers (bullish) or from buyers to sellers (bearish).
Decoding the Engulfing Candle Stick

Think of an engulfing pattern as a sudden and decisive battle on the trading floor. The first candle represents the established trend, the current market sentiment. The second, much larger candle is a surprise attack from the opposing force, completely overwhelming the prior momentum in a single session.
This pattern isn't just about two candles sitting next to each other; it’s a clear signal that the prevailing market psychology has been shattered. Whether it’s buyers stepping in with overwhelming force at the bottom of a downtrend or sellers taking firm control at the peak of an uptrend, the message is clear: a reversal could be underway.
The Two Sides of the Engulfing Story
The engulfing pattern comes in two distinct flavors, each telling an opposite tale about where the market might be headed. Understanding the context—where they appear on the chart—is absolutely critical to getting their message right.
-
Bullish Engulfing: This pattern shows up at the end of a downtrend. It starts with a small bearish (red) candle, which is then completely swallowed by a large bullish (green) candle. It screams that selling pressure is exhausted and that buyers have stormed in to take command.
-
Bearish Engulfing: Conversely, this one forms at the top of an uptrend. A small bullish (green) candle is followed by a massive bearish (red) candle that engulfs the body of the first. This is a huge red flag that buying momentum has fizzled out and sellers have aggressively seized control.
The core idea behind the engulfing pattern is a complete reversal of power. The second candle doesn't just negate the price action of the previous day—it establishes a powerful move in the opposite direction.
This fundamental transfer of control is precisely what makes the engulfing candle a favorite among technical traders. It provides a potent, visual clue that the market's direction is about to change, offering a potential entry point to catch a new trend right as it begins.
Bullish vs Bearish Engulfing At a Glance
To make spotting these patterns even easier, here’s a quick side-by-side comparison. Use this table as a cheat sheet to instantly recognize the key differences on your charts.
| Characteristic | Bullish Engulfing | Bearish Engulfing |
|---|---|---|
| Location | Appears after a downtrend | Appears after an uptrend |
| Candle 1 | Small bearish (red) body | Small bullish (green) body |
| Candle 2 | Large bullish (green) body | Large bearish (red) body |
| Key Action | The green body completely engulfs the red body | The red body completely engulfs the green body |
| What It Signals | Potential bottom reversal; buyers are now in control | Potential top reversal; sellers are now in control |
| Market Psychology | Selling exhaustion followed by aggressive buying | Buying exhaustion followed by aggressive selling |
Keep these characteristics in mind, and you'll start seeing these powerful signals pop up all over your charts, giving you a serious edge in anticipating market turns.
How to Reliably Spot a Bullish Engulfing Pattern
Spotting a high-probability bullish engulfing pattern is more of an art than a science. It's not just about finding a big green candle swallowing a little red one; it's about understanding the story the market is telling you through its price action.
A true bullish engulfing pattern doesn't just pop up anywhere. It's a very specific signal, and for it to have any real power, the right conditions have to be in place.
The most crucial rule is context. The pattern must appear after a clear downtrend. Think of it as a reversal signal—it can't reverse a trend that doesn't exist. If you see this pattern form in the middle of choppy, sideways price action, it loses almost all of its psychological impact. The downtrend is what sets the stage for the dramatic power shift that the engulfing candle represents.
The Anatomy of a Valid Signal
Once you've confirmed a downtrend is in place, you can zoom in on the two candles that make up the pattern itself. For the signal to be valid, they have to meet a couple of specific criteria.
-
Candle One: The first candle absolutely must be bearish (red). This candle is a continuation of the downtrend, showing that sellers were still in control during that session, even if it's just a small move down.
-
Candle Two: The second candle must be bullish (green). Its real body—the part between the open and close prices—has to completely "engulf" or swallow the entire real body of the first candle. This is the visual proof that buying pressure just steamrolled the sellers.
A recent study of large-cap stocks actually found that the bullish engulfing pattern is statistically significant when it forms after a downtrend, which backs up its reliability as a reversal signal under these specific conditions.
A valid bullish engulfing pattern is a story of capitulation and takeover. The small red candle is the last gasp of the sellers. The large green candle is the decisive entry of buyers who finally see value at these lower prices.
Beyond the Basics: What Strengthens the Signal
Of course, not all bullish engulfing patterns are created equal. Some are screaming "buy," while others are more of a whisper. Several factors can either add conviction to the signal or tell you to be cautious.
One of the biggest confirmations is trading volume. A significant spike in volume on the day the big green engulfing candle forms adds a ton of credibility. It shows that the reversal isn't just a handful of traders; it's backed by a large number of market participants putting their money where their mouth is.
The wicks, or shadows, of the candles also tell a story. Ideally, you want to see relatively short wicks on the engulfing candle. A very long upper wick, for example, might suggest that sellers pushed back hard from the highs, which could weaken the bullish case. For a deeper dive into these nuances, check out our guide on trading bullish engulfing patterns.
Identifying the Bearish Engulfing Pattern for Sell Signals
While the bullish engulfing pattern signals buyers are wrestling control at a market bottom, its bearish twin is a powerful red flag at the top of an uptrend. Think of the bearish engulfing pattern as a critical sell signal, one that suggests the buying frenzy has run its course and sellers are stepping in with overwhelming force.
This two-candle pattern tells a dramatic story of a power shift. After a string of rising prices, buyers get a little too comfortable, or perhaps they're just exhausted. Then, in a single session, sellers don't just stop the advance—they completely wipe out the gains from the day before, shouting from the rooftops that a market top could be in.
The Essential Criteria for a Valid Bearish Signal
For a bearish engulfing candle to be a high-probability signal, it needs to follow a few strict rules. Ignoring these can lead you to act on false signals and take unnecessary losses. The context of where the pattern shows up is just as important as the shape of the candles themselves.
Here are the non-negotiable rules for spotting a valid one:
- A Preceding Uptrend Must Exist: The pattern’s whole job is to signal a reversal. So, there must be a clear uptrend to reverse. A bearish engulfing pattern floating in a choppy, sideways market doesn't carry much weight.
- Candle One is Bullish: The first candle of the pattern must be a green (bullish) candle. This candle represents the final, often weak, push from buyers continuing the uptrend.
- Candle Two is Bearish and Engulfing: The second candle must be a big red (bearish) candle. Crucially, its real body must completely swallow, or "engulf," the entire real body of the first bullish candle.
This complete consumption is the key. It's a visual knockout punch, showing that the selling pressure in one session was strong enough to erase all the buying conviction from the period before. It traps late buyers and signals a decisive win for the sellers.
The pattern's reliability is also well-documented. According to technical analyst Thomas Bulkowski, this specific pattern predicts a bearish reversal about 79% of the time when it forms after a solid uptrend, making it a statistically significant tool for any trader. You can dig deeper into these findings on bearish engulfing pattern reliability on StockCharts.com.
Enhancing the Signal's Strength
Beyond the basic rules, a few other factors can add serious muscle to a bearish engulfing signal. A big spike in trading volume on the day the large red candle forms is a major confirmation. It shows that the reversal is backed by conviction and heavy market participation.
Location, location, location. A bearish engulfing candle that forms right at a known resistance level—like a previous swing high or a major moving average—is far more potent than one that just appears in open space. Learning to spot these powerful sell signals can give you an invaluable early warning to protect your profits or even initiate a short position.
The Market Psychology Driving the Pattern
An engulfing pattern is so much more than just a shape on a chart; it’s a story playing out in real time. Each one captures a high-stakes battle between fear and greed, giving you a window right into the market's collective mind. Grasping this psychology is what separates traders who just spot patterns from those who truly understand what the market is telling them.
The bullish engulfing candle tells a story of fear flipping to confidence. Picture a downtrend where sellers have been in total control, relentlessly pushing prices lower. That small red candle is their final, maybe even overconfident, push. Then, out of nowhere, a massive wave of buying pressure storms in. It creates that huge green candle that completely swallows the previous one.
This isn't just a simple price move; it's a psychological shockwave. Buyers didn't just absorb all the selling pressure—they hammered in a powerful new price floor. This signals that the sellers are exhausted and a new consensus is forming, one built on confidence and optimism.
The Bearish Takedown
On the flip side, the bearish engulfing pattern shows you the exact moment greed turns to fear. During an uptrend, buyers are feeling great, pushing prices higher and higher. The small green candle is often the result of latecomers jumping in, driven by a classic case of FOMO (fear of missing out).
Then, the script flips. A powerful force of sellers enters the ring, creating a massive red candle that not only erases the previous period's gains but keeps on going. This decisive move traps all those late buyers, instantly turning their hopeful positions into losers. The sudden reversal triggers panic, showing that the buying momentum has vanished and sellers have seized control with overwhelming force. This is the exact psychology that can kick off a market top.
At its core, an engulfing candle represents a moment of capitulation. In a bullish pattern, sellers capitulate to overwhelming buying pressure. In a bearish pattern, buyers capitulate to a surprising and dominant seller takedown.
This is precisely why context, especially trading volume, is so critical. An engulfing candle that forms on high volume shows real conviction; it means a huge number of market participants are driving that reversal. A pattern on low volume, however, lacks that institutional muscle and is far less reliable.
By learning to read the emotional story behind the engulfing candle stick, you move beyond just recognizing shapes and start trading on true market conviction.
Actionable Engulfing Candle Stick Trading Strategies
Spotting an engulfing candle is one thing, but turning that observation into a repeatable, profitable trading plan is what really counts. A solid strategy goes way beyond just seeing the pattern; it builds a complete system with hard rules for entry, exit, and managing your risk.
A common entry trigger for a bullish engulfing setup is to wait for the price to not just break, but close above the high of the engulfing candle itself. This acts as a small confirmation that buyers are still in control and have the strength to push the market higher. For a bearish pattern, you'd do the opposite: a trader might short the market once the price breaks below the low of that big red engulfing candle.
Entry Triggers and Confirmation
Here's a hard truth: trading every single engulfing pattern you find is a quick way to empty your account. The best, highest-probability setups are the ones confirmed by other technical factors. Think of these confirmations as building a stronger case for why this particular trade should work.
-
Volume Analysis: A big spike in trading volume on the day the engulfing candle forms is a massive vote of confidence. High volume tells you there’s real conviction and heavy participation behind the move. You can learn more about this in our guide to trading with volume for modern market analysis.
-
Support and Resistance: A bullish engulfing pattern that forms right at a key support level—like a previous swing low or a major moving average—is far more powerful. In the same way, a bearish engulfing pattern popping up at a known resistance level is a strong signal that the rally has just hit a brick wall.
-
Indicator Divergence: Imagine an oscillator like the Relative Strength Index (RSI) is showing bullish divergence (the price makes a new low, but the RSI makes a higher low). If a bullish engulfing candle appears right after that, the reversal signal becomes significantly stronger.
This decision tree gives you a great visual for how volume can act as your first and most important filter.
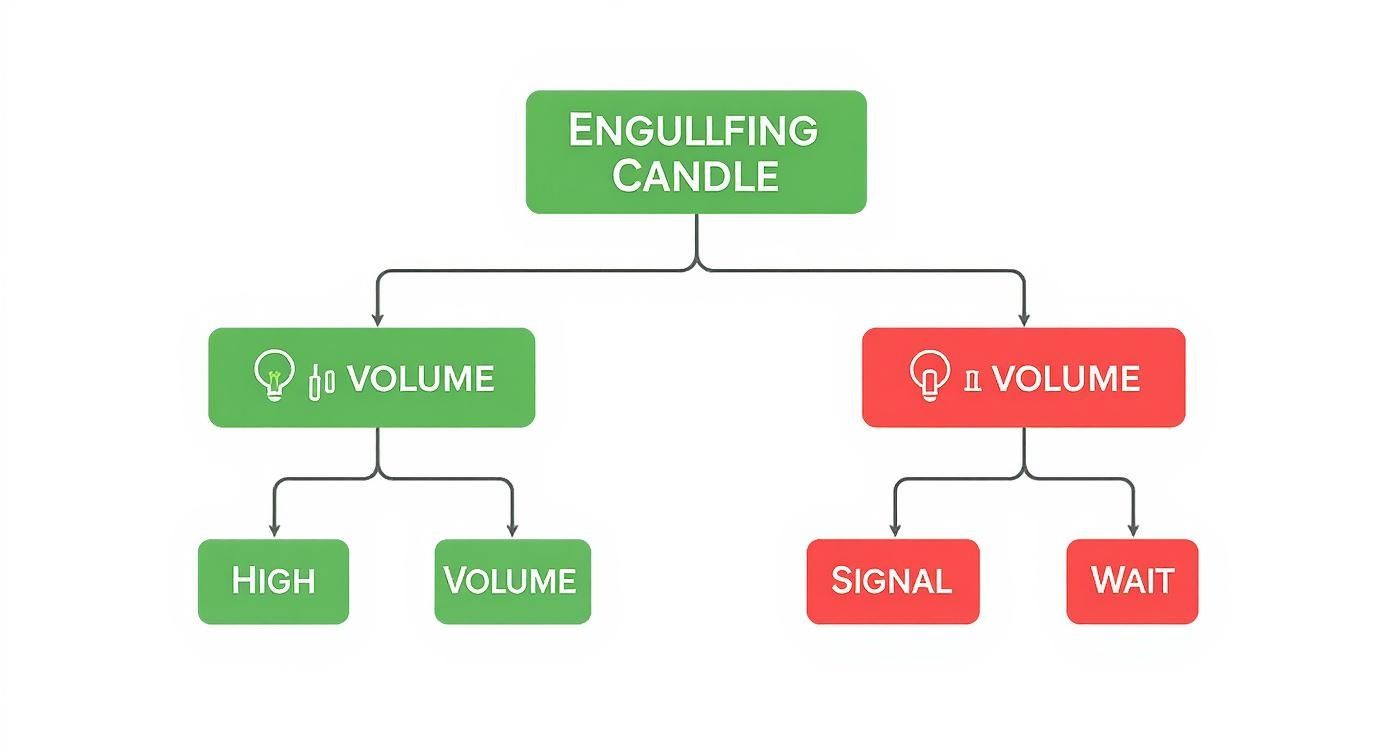
The flowchart drives home a key point: high volume adds credibility to the signal, while low volume is a warning sign to wait for more proof before you jump in.
Disciplined Risk Management
No trading strategy is worth its salt without strict risk management rules. Fortunately, with an engulfing pattern, this is pretty straightforward. When you enter a long trade after a bullish engulfing candle, a standard approach is to place your stop-loss order just below the low of the pattern.
There's a clear logic here: if the price falls back below the absolute low of that powerful reversal candle, the entire reason for the trade has been invalidated. It’s time to get out with a small, manageable loss.
Interestingly, even failed patterns can teach us something. One study on U.S. stocks found that while the bearish engulfing pattern appears about twice a year per stock, the stock actually closes higher 59.3% of the time just one week later. This tells us just how critical context and extra filters are for making the pattern reliable.
Ultimately, before you risk real money, you need to be sure your strategies are solid. That's why it's so important to understand how to backtest a trading strategy the right way. This process validates your rules against historical data, giving you the confidence you need to execute them without hesitation when the market is live.
Got Questions About Trading Engulfing Patterns?
Once you start spotting engulfing candles on your charts, a bunch of questions usually pop up. It’s a simple-looking pattern, but the little details can make a huge difference in your trading results. Let's clear up some of the most common points of confusion to help you trade these signals more effectively and sidestep the usual traps.
Here are the answers to the questions I hear most often from traders.
What Is the Most Accurate Time Frame for Engulfing Patterns?
This is probably the number one question traders ask. The short answer? Engulfing patterns show up on every chart imaginable, from a blink-and-you'll-miss-it one-minute chart all the way up to a weekly or monthly view. But here's the key: their reliability skyrockets on higher time frames.
Why? Think of higher time frames like the daily or 4-hour charts as a filter for market "noise." Each candle on these charts represents a huge amount of buying and selling, which means a reversal signal carries a lot more weight.
- Daily Charts: Many traders consider this the sweet spot. Signals on the daily are strong, reliable, and less likely to be faked out by short-term market jitters.
- 4-Hour Charts: This is a fantastic middle ground for swing traders. You get more trading opportunities than the daily chart offers, but the signals are still far more trustworthy than on lower time frames.
- Lower Time Frames (e.g., 15-Minute): You'll see tons of engulfing patterns here, but you'll also run into a lot of false signals. Day traders who live on these charts must lean heavily on other confirmation tools, like a big spike in volume or a confirming indicator signal.
Put it this way: an engulfing pattern on a daily chart is the result of a full day's battle where one side clearly won. The same pattern on a 5-minute chart is more like a brief, less meaningful skirmish.
Do Engulfing Patterns Work in All Markets?
Yep. The core psychology behind the engulfing pattern—a sudden, dramatic power shift between buyers and sellers—is a universal human (and market) behavior. That's what makes it so versatile across different financial markets.
You can find and trade engulfing patterns effectively in:
- Stocks: A classic playground for these patterns, where a big shift in sentiment around a company can trigger a powerful engulfing signal.
- Forex: The massive liquidity in currency markets means these patterns are extremely common and effective, especially on the major pairs.
- Commodities: Markets like oil and gold are driven hard by supply, demand, and sentiment, so they respond very well to the psychology this pattern reveals.
- Cryptocurrencies: In the wild, volatile world of crypto, engulfing patterns can signal some incredibly sharp and fast trend reversals.
The trick isn't the market itself, but rather understanding that market's unique personality. The confirmation signals you'd want to see in a slow-moving utility stock are going to be different from what you'd need in a fast-and-furious crypto trade.
Can I Trade an Engulfing Candle in Isolation?
Technically you can, but it's a really bad idea. Relying on any single candlestick pattern alone, even a strong one like the engulfing candle, is a high-risk gamble. It's a powerful signal, but it should absolutely never be traded in a vacuum.
The best traders use the engulfing candle as a major clue in a larger trading thesis. Think of the pattern as a compelling piece of evidence, not the final verdict. Always hunt for confirmation from other sources before you put your money on the line. This "confluence" of signals is what stacks the odds in your favor.
For instance, a bullish engulfing pattern goes from being just "interesting" to a high-probability setup when it:
- Pops up right at a major historical support level.
- Is backed by a significant spike in trading volume.
- Shows up after a bullish divergence on an oscillator like the RSI.
Without that extra evidence, you're just trading a shape on a chart. With it, you're trading a well-supported hypothesis about where the market is headed next.
What if the Second Candle Only Engulfs the Body?
Fantastic question. This gets right into the nitty-gritty of pattern recognition. The classic, textbook definition of an engulfing candlestick requires the second candle's real body to completely swallow the first candle's real body.
The wicks (or shadows) are a secondary concern. Some purists like to see the second candle's entire range—from its high to its low—engulf the first candle's entire range, as this shows even more overwhelming force. But the core requirement is all about the real bodies, because they show the opening and closing prices—the most important battlefield between buyers and sellers.
Ready to stop manually searching for these powerful signals? ChartsWatcher provides advanced scanning and filtering tools that can automatically find high-probability engulfing candlestick patterns across thousands of stocks in real-time. Customize your alerts, backtest your strategies, and get the edge you need by visiting https://chartswatcher.com.
