A Trader's Guide to the Bullish Engulfing Pattern
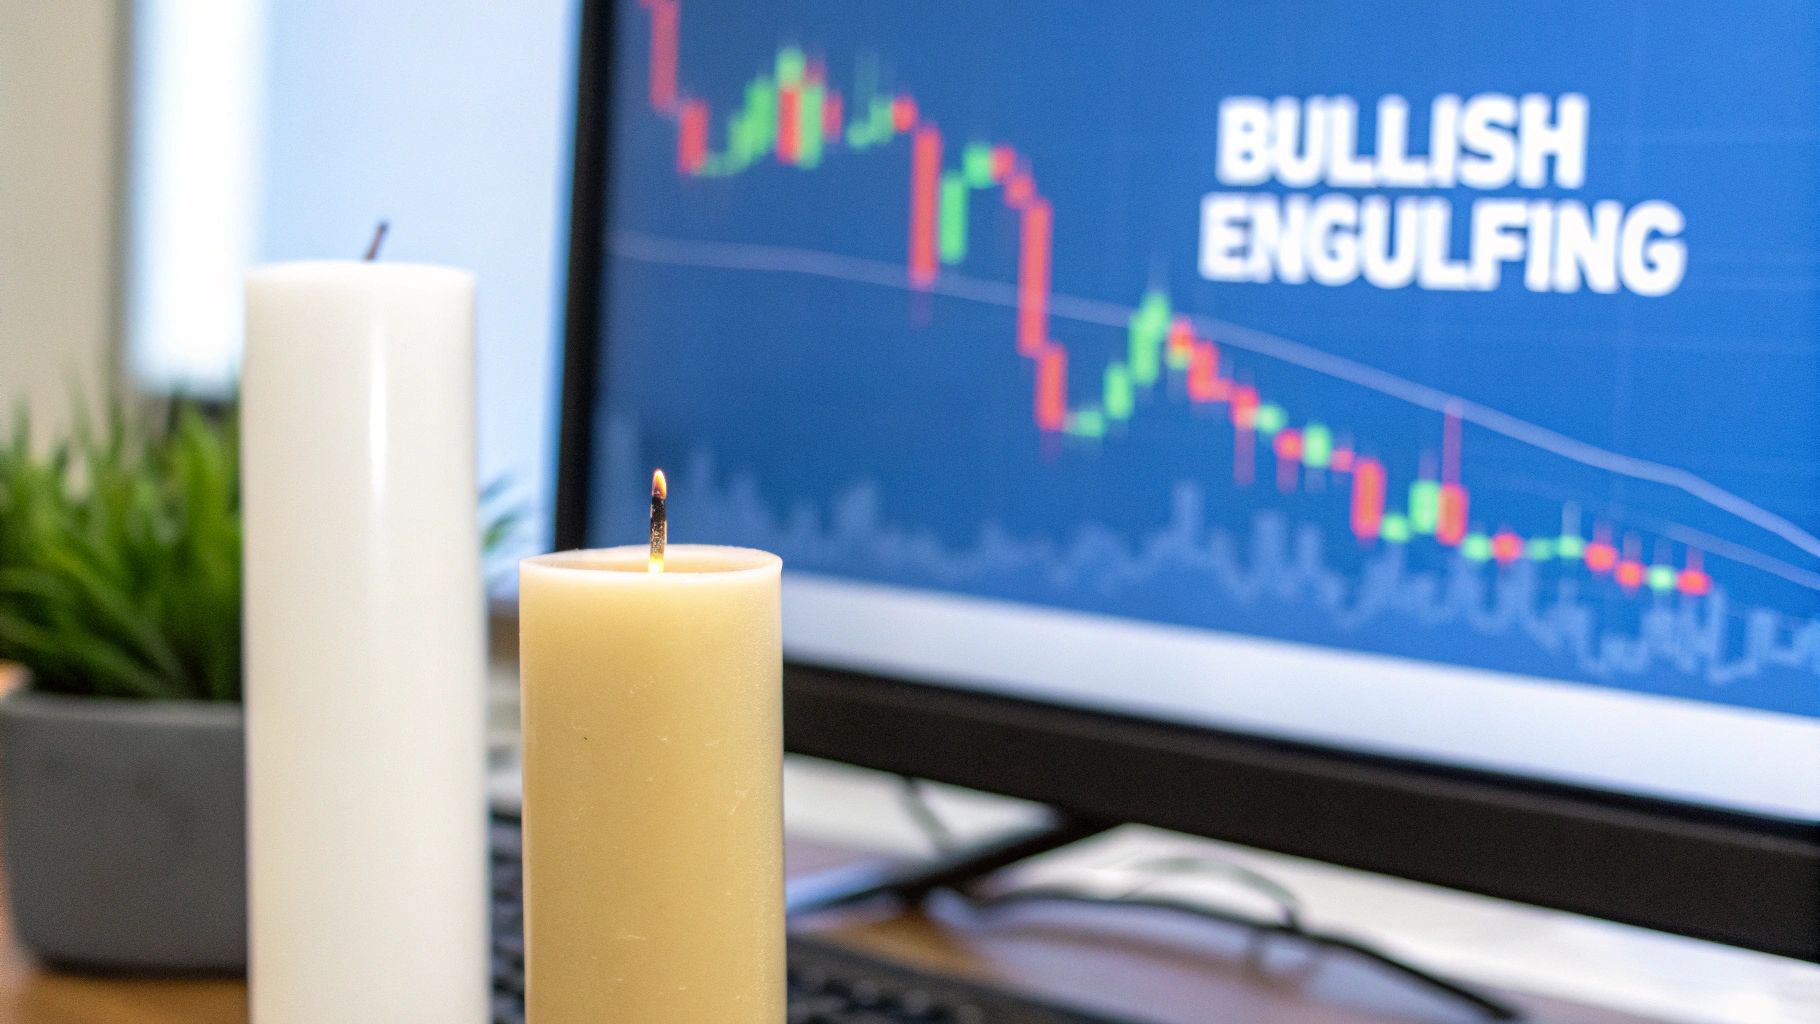
A bullish engulfing pattern is a powerful two-candle signal that can flag a potential turnaround, shifting a market from a downtrend to an uptrend.
This setup consists of a small bearish candle followed by a much larger bullish candle whose body completely swallows or engulfs the body of the previous one. When you see this, it’s a strong visual cue that market sentiment is flipping from selling to buying.
Understanding the Bullish Engulfing Pattern
Think of it like this: a small wave of selling pressure gets suddenly overwhelmed by a massive wave of buying enthusiasm. That's the story the bullish engulfing pattern tells on a price chart. It’s a dramatic signal suggesting that sellers are losing their grip and buyers are stepping in with force.
This pattern is a cornerstone of candlestick analysis because it gives you a clear, visual snapshot of a battle for market dominance. The first candle, a small red (or bearish) one, shows that sellers were in control, pushing the price down as part of the existing downtrend.
But the second candle flips the script entirely. It opens at or even below the previous candle's close, but then buyers jump in with such conviction that they drive the price up, completely erasing the prior session's losses and closing significantly higher than its open.
The Psychology Behind the Shift
The real power of the bullish engulfing pattern lies in the market psychology it reveals. It’s a moment of capitulation for sellers and a surge of confidence for buyers. This sudden and decisive reversal can often be the very first sign that a larger trend change is just around the corner.
Of course, context is everything. For this signal to be truly meaningful, it needs to appear in the right place—ideally at the bottom of a clear downtrend or near a key support level. In these scenarios, it suggests that the selling momentum has finally burned out and a new upward move might be getting started.
A key insight is that this pattern isn't just about price; it's about power. The larger green candle's ability to completely "engulf" the prior red one demonstrates a definitive transfer of control from bears to bulls.
While visually compelling, it’s also important to look at the numbers. Comprehensive analysis shows the bullish engulfing pattern signals a bullish reversal about 63% of the time. While that’s a respectable figure, it reinforces why you need confirmation rather than trading on the pattern alone. You can dive deeper into the statistical performance of various candlestick formations to build a more robust strategy.
To make things even clearer, let's put this pattern side-by-side with its bearish twin.
Bullish vs Bearish Engulfing At a Glance
The table below breaks down the key differences between the bullish engulfing pattern and its bearish counterpart, giving you a quick reference for telling them apart on your charts.
| Characteristic | Bullish Engulfing Pattern | Bearish Engulfing Pattern |
|---|---|---|
| Market Context | Appears at the bottom of a downtrend. | Appears at the top of an uptrend. |
| Candle Sequence | A small bearish (red) candle is followed by a large bullish (green) candle. | A small bullish (green) candle is followed by a large bearish (red) candle. |
| Market Implication | Signals a potential upward reversal; buyers are taking control. | Signals a potential downward reversal; sellers are taking control. |
| Trader Action | Look for potential buying (long) opportunities. | Look for potential selling (short) opportunities. |
As you can see, they are mirror images of each other, signaling opposite outcomes based on where they appear in a trend. Recognizing this distinction is the first step toward using them effectively.
How to Reliably Identify the Pattern
Spotting a genuine bullish engulfing pattern is more than just seeing a big green candle next to a small red one. Any rookie can do that. True identification is more like detective work; you need to look for specific clues that separate a high-probability signal from simple market noise.
The first and most critical clue is context. This pattern is a reversal signal, which means it has to show up after a clear, established downtrend. A bullish engulfing pattern that appears in the middle of a choppy, sideways market is like a lighthouse in the desert—it's in the wrong place and serves no real purpose. The downtrend is essential because it shows that sellers were firmly in control, setting the stage for a meaningful power shift.
This infographic breaks down the core steps for spotting the pattern in a live market.
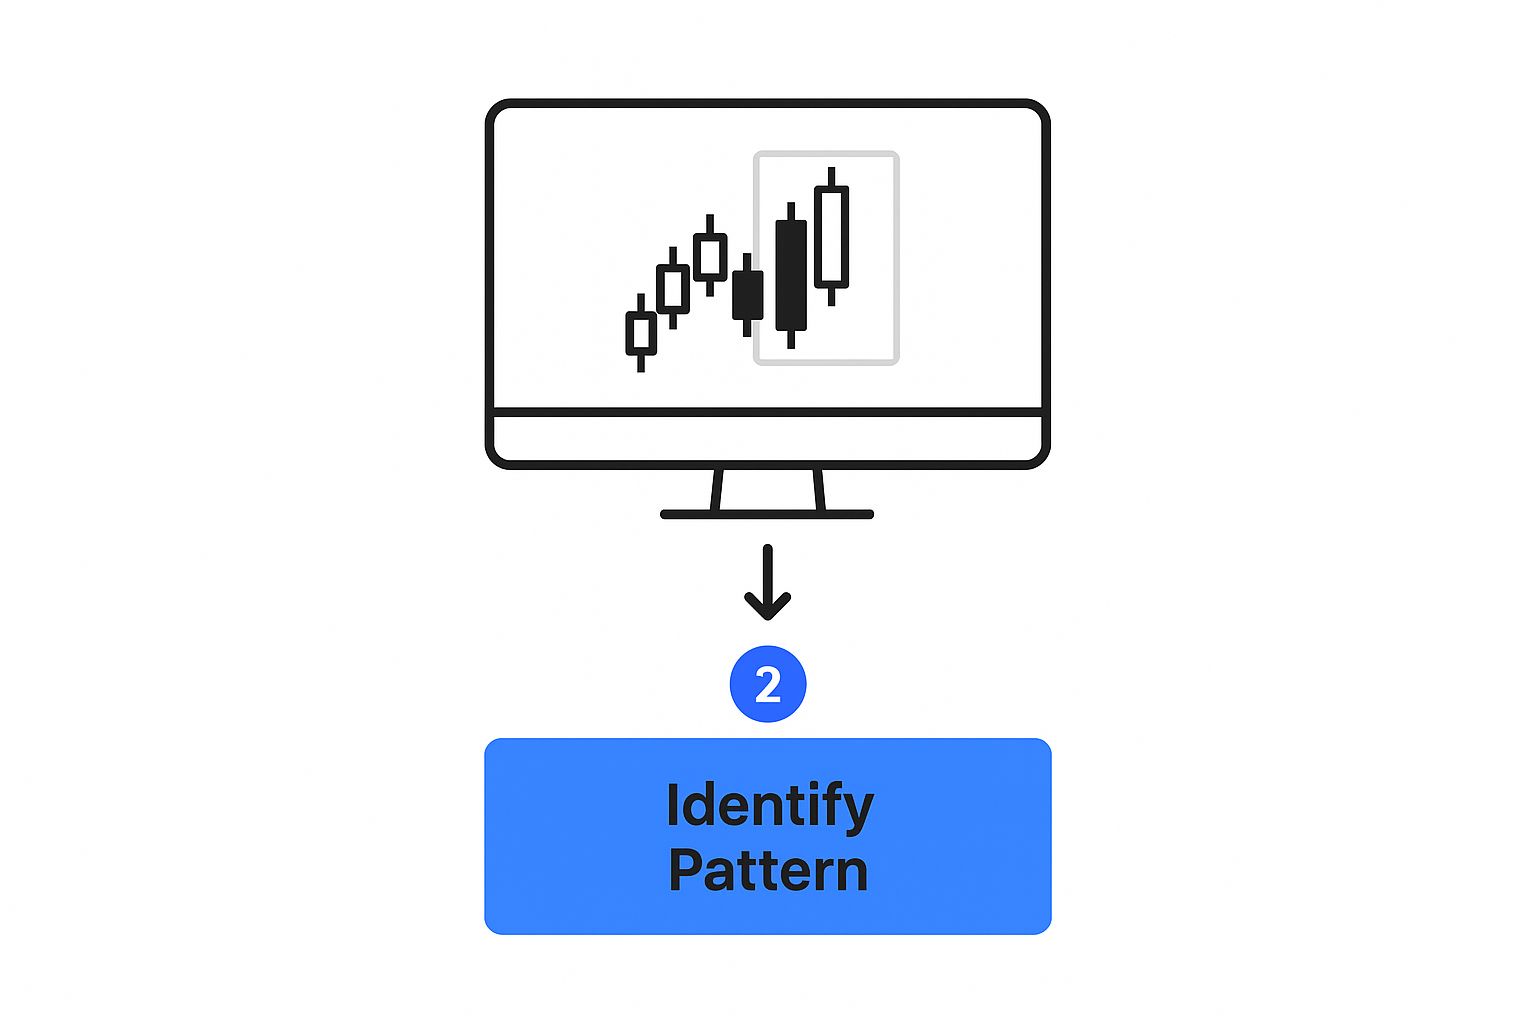
As you can see, it all starts with confirming the market context—the downtrend. Only then do you zoom in on the specific anatomy of the candles, which is where the real verification happens.
The Anatomy of the Two Candles
Once you've confirmed the downtrend, your focus narrows to the two specific candles that make up the pattern. For the signal to be valid, each one has to follow the rules.
-
The First Candle (The Bearish Precursor): This has to be a bearish (red) candle. It’s often small, which can suggest sellers are losing steam, but that’s not a strict requirement. What matters is that it continues the downtrend that came before it.
-
The Second Candle (The Bullish Takeover): This is the star of the show. It must be a bullish (green) candle whose body completely "engulfs" the body of the first candle. This is the single most important rule of the pattern.
The rule of thumb is this: The second candle must open at or below the first candle’s close, and it must close above the first candle’s open. This proves that buyers didn't just absorb all the previous selling pressure; they completely overpowered it and drove the price significantly higher.
What Counts and What Does Not
The word "engulf" can be a little tricky. It specifically refers to the real body of the candles—that's the colored part between the open and close price. The wicks (or shadows) are secondary; they can offer extra clues, but they aren't part of the core definition.
Let’s run through a quick checklist:
- Valid Pattern: The top of the green candle's body is above the top of the red candle's body.
- Valid Pattern: The bottom of the green candle's body is below the bottom of the red candle's body.
- Invalid Pattern: The second candle's body is bigger but doesn't fully wrap around the first one. That's just a big green candle, not a bullish engulfing pattern.
For instance, if the first candle's body ranges from a high of $10.50 down to a low of $10.25, a valid engulfing candle might open at $10.20 and close way up at $10.60. Its body completely swallows the previous candle's range.
Subtle Clues from Wicks and Volume
While they aren't part of the main definition, the wicks and trading volume can add another layer of confirmation, giving you more confidence in the signal. A long upper wick on the big bullish candle, for example, might suggest that sellers fought back hard before the close, which could slightly weaken the signal.
On the flip side, an engulfing candle that closes right near its high with almost no upper wick shows that buyers finished the session in total command.
But the strongest confirmation of all? A noticeable increase in trading volume on the day the engulfing candle forms. A surge in volume shows that the big upward move was backed by conviction and a large number of market participants, adding some serious muscle to the reversal signal.
Reading the Story Behind the Candles
A bullish engulfing pattern is more than just two colored bars on a chart; it’s a short, dramatic story about a battle for market control. To really get a feel for what’s happening, you have to read the narrative each candle represents. It’s not about memorizing a shape, but about understanding the raw shift in power it reveals.
The story starts with the first candle. This is a small, bearish (red) candle that shows sellers are still in the driver's seat. They’re confidently pushing prices down, continuing the existing downtrend. For all intents and purposes, it looks like just another day where the bears are winning.
Then, the second candle shows up, and the plot takes a wild turn.
The Decisive Power Shift
This is where the real action happens. A massive wave of buyers suddenly floods the market. They don’t just slow the decline or put up a small fight—they launch a full-scale assault that completely steamrolls the previous day's bearish sentiment.
This second, much larger bullish candle often opens at or even below the previous close, absorbing any leftover selling pressure. From there, buyers go on the offensive, aggressively driving the price all the way past the open of the previous day. This isn’t a small victory; it’s a total takeover. The sellers have capitulated.
Think of it like a tug-of-war. The sellers (bears) have been steadily pulling the rope their way. All of a sudden, the buyers (bulls) don't just stop the momentum—they yank the rope with so much force that the entire selling team is thrown off its feet. That powerful, sudden reversal is exactly what the bullish engulfing pattern visualizes.
This visible flip in market psychology is what makes the pattern so compelling. It’s an early flare gun, signaling that a much bigger trend change could be just around the corner.
What This Story Means for Traders
Once you understand this narrative, you can see why the bullish engulfing pattern is such a critical signal for anyone looking to trade reversals. The psychology is crystal clear: the sellers are exhausted, and a fresh wave of buyers has charged in with conviction. This isn't just random market noise; it’s a fundamental shift in the market's collective mindset.
This powerful move highlights a few key things:
- Seller Capitulation: The momentum that drove the downtrend has been completely wiped out.
- Buyer Dominance: New buying pressure isn’t just present; it’s strong enough to erase all of the prior session's losses and then some.
- Potential Bottom: This abrupt turnaround often happens at a price level where buyers see major value, suggesting a potential floor has been set.
The story told by these two little candles is a loud-and-clear signal that the bears have lost control. For traders, this is the cue to start looking for confirmation that a new uptrend is kicking off. The pattern provides the first clue, turning a simple chart into a dynamic map of market forces. For a more foundational look at chart interpretation, our guide to understanding candlestick graphs offers additional valuable insights. This context is essential for building a robust trading strategy.
Turning a Pattern into a Plan: Actionable Trading Strategies
Spotting a bullish engulfing pattern is one thing. Turning it into a profitable trade is another game entirely. A classic rookie mistake is seeing the pattern, getting excited about the potential reversal, and immediately hitting the "buy" button. More often than not, this leads to getting burned on a false signal.
Instead of jumping the gun, a smarter approach is to treat the pattern as a strong hint—not a guarantee. We need to see some follow-through. A simple but effective tactic is to place a buy stop order just a few ticks above the high of the big green engulfing candle. This way, you're only entering the trade if the price proves it has the strength to keep climbing. You're letting the market confirm the buyers are still in charge before you put any capital at risk.
The Power of Confirmation: Never Trade a Pattern in Isolation
If you take only one thing away from this guide, let it be this: never, ever trade a candlestick pattern on its own. Think of the bullish engulfing pattern as a compelling piece of evidence in a larger investigation. Your job as a trader is to find other clues that all point to the same conclusion.
When you get several different indicators all flashing a "buy" signal at the same time, your odds of success skyrocket. This is what traders call confluence, and it's the foundation of high-probability trading.
Here are the key confirmation tools to look for:
- Relative Strength Index (RSI): Is the RSI showing bullish divergence? This is a fantastic signal. It happens when the price grinds down to a new low, but the RSI makes a higher low. It’s a subtle sign that the downward momentum is running out of steam, setting the stage perfectly for a reversal.
- Moving Average Convergence Divergence (MACD): Look for a bullish crossover, where the MACD line crosses up and over the signal line. If this happens below the zero line and lines up with your engulfing pattern, it’s a strong signal that a new wave of upward momentum is just getting started.
- Volume: Did trading volume spike on the day the engulfing candle formed? This is huge. A surge in volume tells you that the bullish move was backed by a lot of conviction and participation from buyers. It adds serious weight to the reversal signal.
Take a look at this setup from the ChartsWatcher platform. It’s a textbook example of confluence in action.
Here, we see the bullish engulfing pattern form right at a key support level—that’s our first layer of confirmation. But look below the chart. The RSI is showing clear bullish divergence, the MACD is making a bullish crossover, and the whole thing is supported by a big spike in volume. That's a setup worth paying attention to.
Building a Complete Trade Setup
Let's put all the pieces together into a simple, step-by-step trading plan.
- Find the Right Context: First, make sure the pattern shows up after a legitimate downtrend. Even better if it’s near a known support level, like a previous swing low or a major moving average.
- Verify the Pattern: Check the anatomy. Does the second candle’s real body completely swallow the first one?
- Seek Confluence: Now, hunt for confirmation. Do you see bullish divergence on the RSI? A MACD crossover? A significant jump in volume? The more you can check off, the stronger the signal.
- Set Your Entry: Place a buy stop order just a smidge above the high of the engulfing candle. This confirms the upward momentum before you commit.
It's important to remember that market environments change. For instance, recent studies show that in highly liquid markets dominated by institutions, the predictive power of classic patterns can be less reliable. Traders need to adapt. You can dig into the research on how market microstructure affects pattern validity.pdf) to learn more.
By using the bullish engulfing pattern as the centerpiece of a multi-layered analysis, you shift from reactive guessing to strategic, evidence-based trading. That kind of disciplined approach is what separates consistently profitable traders from the rest.
Managing Risk and Setting Profit Targets
Spotting a textbook bullish engulfing pattern is a great feeling, but it’s just the starting whistle, not the finish line. A fantastic entry signal means nothing if you don't have a solid plan for how you'll get out—whether you're taking profits or cutting a loss. This is what really separates the pros from the amateurs: a relentless focus on risk management.
Without a predefined exit strategy, even the most promising setup can quickly sour and turn into a big loss. The goal isn't just to find winning patterns; it's to build a disciplined framework that keeps you in the game for the long haul.
Setting Your Stop-Loss The Smart Way
Your stop-loss order is the bedrock of your entire risk management plan. Thankfully, for a bullish engulfing pattern, the most logical place to set it is both intuitive and powerful.
You want to place your stop-loss just below the low of the big, green engulfing candle. This level is your line in the sand. The whole trade is based on the idea that buyers have stormed in and set a new price floor. If the price breaks below that low, the bullish theory is busted, and it's time to get out with a small, controlled loss.
By setting your stop-loss here, you're defining your exact risk before you even enter the trade. You know precisely how much you stand to lose if things go south, which takes the emotion right out of the decision.
If you want to get more advanced with your exits, it helps to understand the different types of stop orders and where to place them. To dig deeper, check out our practical guide on how to set stop-losses for more techniques.
Locking In Gains With Profit Targets
Once your risk is handled, the next move is figuring out where to cash in. It’s tempting to just let a winner run, but without a clear target, a profitable trade can easily reverse and evaporate. Here are three practical ways to set your profit targets.
-
Key Support and Resistance Levels: Look left on your chart. The most obvious place for a rally to hit a wall is a previous area of heavy price action. Find the nearest major resistance level—it could be a prior swing high, a zone of consolidation, or even a key moving average. That level makes for an excellent first profit target.
-
Fibonacci Retracement and Extensions: Fibonacci tools are perfect for mapping out potential exit points. By drawing a Fibonacci retracement from the high of the last downtrend down to the low of the bullish engulfing pattern, you can use key levels like the 50% or 61.8% retracement as logical targets where sellers might step back in.
-
Measured Moves: Here's another simple but effective technique. Measure the height of the bullish engulfing candle itself. Then, project that same distance upward from the candle’s high to find a conservative, short-term profit target. This method is great for snagging quick, momentum-fueled moves.
Calculating Your Risk-to-Reward Ratio
Finally, let's tie it all together by looking at your risk-to-reward ratio. Before you pull the trigger on any trade, you have to make sure the potential reward is worth the risk you're taking.
- Risk: The distance from your entry point down to your stop-loss.
- Reward: The distance from your entry point up to your profit target.
A healthy trade setup should give you a risk-to-reward ratio of at least 1:2. In plain English, that means you stand to make at least double what you're risking. If the distance to your target is smaller than the distance to your stop, the trade simply isn't worth it—no matter how perfect that bullish engulfing pattern looks. This disciplined mindset is what protects your capital and ensures your winners are big enough to more than cover your losses over time.
Common Trading Mistakes to Avoid
Even the most textbook-perfect bullish engulfing pattern can turn into a losing trade if you get sloppy. The road to consistent trading is paved with discipline, and that means sidestepping the common traps that catch both new and seasoned traders off guard. Spotting these pitfalls is the first step to building a much stronger strategy.
One of the biggest blunders is getting the location wrong. A bullish engulfing pattern is a reversal signal, which means it has the most predictive power when it shows up at the bottom of a clear downtrend. When the same pattern pops up in a sideways, choppy, or range-bound market, it loses all meaning. It just becomes noise.
Ignoring the Need for Confirmation
Another critical mistake is treating the bullish engulfing pattern like a crystal ball—a single, infallible signal to go long. Acting on the pattern alone, without looking for any other supporting evidence, is a recipe for frustration. You're essentially trading with just one piece of a much larger puzzle.
The pattern itself is a question, not an answer. It asks, "Is the trend reversing?" Your job is to find other clues—like volume spikes or indicator signals—to confirm the answer is "yes."
Think of it like this: the pattern flags a potential opportunity. But confirmation from tools like the RSI, MACD, or a significant surge in trading volume is what validates that the buying pressure is real and has staying power. Without that backup, you're just trading on hope.
Acting on Weak or "Close-Enough" Patterns
There's a reason the definition of a bullish engulfing pattern is so precise. A common slip-up is jumping on a "close enough" formation where the second candle’s body doesn't truly swallow the first one. This lack of discipline means you're entering trades based on weak signals that don't have the psychological punch of a true reversal.
Ignoring the size of the candles can also be a costly error. A ridiculously massive engulfing candle might signal exhaustion rather than a fresh start, while a tiny one might not have enough conviction for a sustained move higher.
To really dial in your reliability, you have to filter these signals through a strict set of rules. Historical data shows that even a well-formed bullish engulfing pattern has a pretty modest success rate on its own. In fact, extensive backtesting reveals a win rate of around 55%, which hammers home why you absolutely need extra confirmation before putting capital at risk. You can explore more detailed statistics about this pattern's performance to see for yourself why context is king.
By sidestepping these common errors—trading out of context, skipping confirmation, and settling for sloppy setups—you start to shift the odds back in your favor. This disciplined approach is what separates traders who can effectively use the bullish engulfing pattern from those who just get burned by it.
Got Questions? Let's Get Them Answered
Even after breaking down a pattern, a few specific questions always seem to pop up. Think of this as the "what about..." section, where we tackle the most common queries traders have about the bullish engulfing pattern. This will help clear up any lingering doubts and make sure the concept really clicks.
So, How Reliable Is This Pattern, Really?
The short answer? It's moderately reliable, but its real power comes from context. It's not a magic bullet.
While some studies have thrown around a success rate of about 63% for signaling a reversal, that number isn't set in stone. It can swing wildly depending on the market, the asset you're trading, and your chosen timeframe.
The signal gets a lot stronger when it shows up in the right neighborhood:
- At a support level that has held strong in the past.
- Backed up by a bullish divergence on an indicator like the RSI.
- Paired with a noticeable spike in trading volume.
The most important thing to remember is this: a bullish engulfing pattern is a piece of evidence, not the final verdict. It should never be your sole reason for entering a trade. Its reliability skyrockets when you have other signals agreeing with it.
What’s the Best Timeframe for Trading It?
You'll spot the bullish engulfing pattern everywhere, from one-minute charts all the way up to monthly ones. But here's the catch: its significance grows with the timeframe.
A pattern forming on a daily or weekly chart is a much bigger deal than one on a 5-minute chart. Why? Because it represents a change of heart among a much larger group of traders over a longer period.
For swing and position traders, sticking to higher timeframes like the 4-hour, daily, and weekly charts is the way to go. It filters out a ton of the market "noise" you see on lower timeframes and gives you a clearer, more reliable picture.
How Is This Different from a Bullish Outside Day?
This one trips people up all the time because they look almost identical. The devil is in the details, specifically in what part of the candle you're measuring.
-
Bullish Engulfing Pattern: For this pattern, only the real body (the colored part from the open to the close) of the second candle has to swallow the real body of the first one. The wicks don't really matter for the basic definition.
-
Bullish Outside Day: This is a much stricter, more powerful version. For an outside day, the entire price range of the second day—from its absolute high to its absolute low—must completely contain the entire range of the first day.
Think of it this way: every bullish outside day is also a bullish engulfing pattern, but not every bullish engulfing pattern is an outside day. The outside day is a more powerful signal because it shows an even bigger, more decisive victory for the buyers who controlled the price across a much wider territory.
Ready to stop hunting for patterns manually and start finding high-probability setups with precision? ChartsWatcher gives you the advanced scanning and analysis tools you need to spot bullish engulfing patterns with confirmation, build solid strategies, and trade with confidence. Start your free trial today.
