A Trader's Guide to Short Interest of Float
Short interest of float tells you what percentage of a company's tradable shares are being bet against. Think of it as a market sentiment gauge—it shows just how many investors are convinced a stock’s price is heading down. A high percentage signals heavy pessimism, but it can also be the perfect setup for a powerful short squeeze.
Understanding Short Interest of Float as a Market Signal
Let's say a company has 100 million shares in total. That sounds like a massive pool of stock, right? But the reality is, not all of those shares are actually available for trading on any given day. A huge chunk might be locked up by insiders like executives, or held by large institutions that aren't planning on selling anytime soon.
The shares that can be freely bought and sold by the public make up what’s called the float. This is the number that really matters for day-to-day trading because it represents the actual, available supply.
This simple diagram breaks down the relationship between a company's total shares, its float, and how short interest fits into the picture.
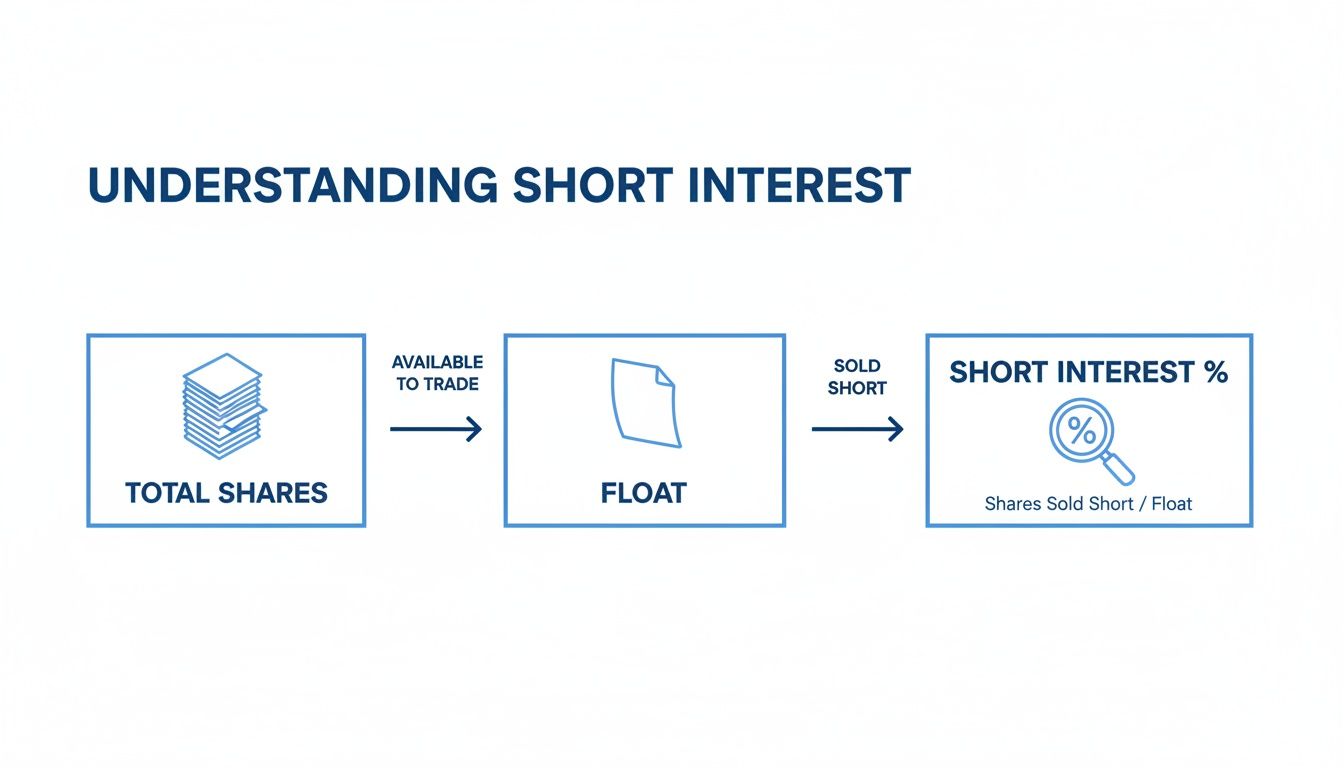
As you can see, the float is a much smaller, more relevant slice of the pie. It’s this slice that gives the short interest figure its true meaning.
Why the Float Is Crucial
Focusing on the float gives traders a far more accurate picture of what's really going on. Imagine a company has 10 million shares sold short against its 100 million total shares. At first glance, the short interest is just 10%. Seems manageable.
But what if only 20 million of those shares are actually in the float?
Now, the situation looks completely different. The short interest of float is a staggering 50% (10 million short shares / 20 million float shares). That means for every two shares available to the public, one has been shorted. This metric reveals a much more crowded—and dangerous—trade for the short sellers.
A high short interest of float isn't just a bearish signal; it represents tension building up in the market. It’s like a coiled spring—the more compressed it gets, the more explosive the release can be if good news hits.
This distinction is fundamental for a few key reasons:
- A More Accurate Read on Sentiment: It shows the true level of bearish conviction among everyday traders.
- A Glimpse into Liquidity: A stock with a small float and high short interest can become very illiquid, which magnifies price swings.
- The Ultimate Short Squeeze Precursor: This is the single most important ingredient for a potential short squeeze. When short sellers are forced to buy back shares, they're all competing for that limited supply in the float.
Setting the Stage for Opportunity
This dynamic is exactly why savvy traders watch this metric so closely. A high short interest of float means a large number of traders are trapped in a bearish position. If the company releases positive news or gets a surge of unexpected buying, these shorts are forced to buy back shares to cut their losses.
This forced buying creates a feedback loop: their buying pushes the price up, which forces more shorts to cover, pushing the price even higher. This rapid, upward spiral is the classic short squeeze. By understanding and monitoring the short interest of float, you can spot stocks where this explosive potential is building up long before it’s unleashed.
Calculating the Numbers Behind Market Sentiment

To really get a feel for the power of short interest of float, you have to look at the simple but revealing math behind it. Don't worry, calculating this metric isn't rocket science; it’s all about knowing which numbers to grab and, more importantly, why they matter.
The formula itself is pretty straightforward. It gives you a clean percentage that tells you just how much bearish sentiment is out there relative to the shares people can actually trade.
The Formula: (Number of Shares Sold Short / Total Float) x 100 = Short Interest of Float %
Let's pull back the curtain on each piece of this equation. Seeing how they fit together is what turns raw data into an actionable signal for your trading.
Unpacking the Formula's Components
First up, we need the total number of shares that have been sold short. This number is the sum of all open bets against a stock—shares that traders have borrowed and sold, hoping the price will tank.
Next, and this is the crucial part, we need the float. This isn't the total number of shares the company has ever issued. It's the number of shares actually available for you and me to trade on the open market.
To get the float, you start with the shares outstanding (the total number of shares held by everyone) and then subtract any restricted shares.
- Shares Outstanding: This is the big number, including every single share the company has issued.
- Restricted Shares: These are chunks of stock held by insiders—think executives, directors, or massive institutions—that can't be sold on the market right away.
The number you're left with is the float, the true pool of tradable shares. This distinction is exactly what makes short interest of float a much sharper tool than other metrics. For a deeper dive on how it stacks up, check out our trader’s guide to short float percentage.
A Practical Calculation Example
Let's make this real with a hypothetical company, "Innovate Corp." This will show you how a few key numbers can expose powerful market sentiment.
Imagine Innovate Corp. has this share structure:
- Total Shares Outstanding: 100 million shares
- Restricted Shares (held by insiders): 30 million shares
- Shares Sold Short: 14 million shares
With these figures, we can walk through the calculation step-by-step.
-
Calculate the Float: First, let's find out how many shares are actually in play for public trading. 100 million (Outstanding Shares) - 30 million (Restricted Shares) = 70 million shares in the float.
-
Apply the Short Interest Formula: Now, we plug the float into our formula to see the ratio of shorted shares. (14 million Shares Sold Short / 70 million Float Shares) = 0.20
-
Convert to a Percentage: Finally, multiply that result by 100 to get the metric we're after. 0.20 x 100 = 20%
In this scenario, Innovate Corp. has a short interest of float of 20%. What does that mean in plain English? For every five shares available to the public, one has been sold short. This percentage gives you immediate, actionable context.
A 20% level is considered high and signals that a serious chunk of the market is betting against the stock. This makes it a prime candidate for a potential short squeeze watchlist. Understanding how to do this simple math empowers you to see past the headlines and interpret the raw data for yourself.
How to Interpret Signals from Short Interest Levels
So, you've got the short interest of float percentage. Think of it as a powerful piece of market intel. But like any data point, its real value is in how you read it. A high number can be a red flag or an invitation to a contrarian trade—it all depends on the context and your strategy.
To make sense of the numbers, traders often use a few common benchmarks to get a quick read on the level of shorting activity. These aren't rigid rules, but they provide a solid framework for sizing up a stock's situation at a glance.
It’s a bit like a weather forecast. A low percentage is a calm, sunny day. A high percentage is a storm warning—it doesn't guarantee a hurricane, but it tells you the conditions are right for one.
Establishing Your Benchmarks
The first step is understanding where a stock's short interest stands relative to the market. These thresholds are a great way to classify what you're seeing and decide if a stock is worth digging into further.
- Low Short Interest (Below 10%): This is pretty much business as usual. It signals that there isn't any significant bearish sentiment aimed at the stock. Most healthy, stable companies live in this zone.
- Elevated Short Interest (10% to 20%): Now we're talking. A percentage in this range is a clear sign that a decent number of traders are betting against the stock. It's time to start asking why. Are the fundamentals weak? Are there industry headwinds?
- High Short Interest (Above 20%): This is where things get interesting. A figure over 20% tells you it's a crowded short trade. Here, the metric becomes a double-edged sword—it’s both a strong bearish signal and a potential short squeeze setup.
- Extreme Short Interest (Above 40%): Levels this high are rare. It means short sellers are piling on with extreme conviction. Stocks in this zone are like coiled springs, packed with tension. Any unexpected positive news could trigger a violent, explosive move upward.
The Two Faces of High Short Interest
A high short interest figure can be read in two completely opposite ways. Figuring out the right interpretation comes down to your trading style, risk tolerance, and whether you can spot a catalyst before everyone else does.
Viewpoint 1: The Bearish Consensus
The most straightforward take is that a high short interest of float simply reflects widespread negative sentiment. When a huge chunk of the market is willing to put money on a stock's decline, there are usually good reasons for it.
These reasons often include:
- Weakening company fundamentals
- A rough earnings report on the horizon
- Serious threats from competitors
- A broader economic downturn hitting the entire sector
For traders with a bearish outlook, a high and rising short interest can feel like confirmation. It suggests they're on the same page as a significant portion of the market.
Viewpoint 2: The Contrarian Squeeze Potential
Then there's the more exciting, contrarian view. A heavily shorted stock is a powder keg waiting for a spark. Every one of those short sellers has to eventually buy back the shares they borrowed to close out their position.
A high short interest of float is the fuel for a short squeeze. A positive catalyst is the match that lights it. Without a catalyst, the fuel can sit there indefinitely.
This dynamic creates an incredible amount of potential energy. If the company drops unexpected good news—a massive earnings beat, a game-changing partnership, a hit product launch—the whole narrative flips. Short sellers scramble for the exits all at once, creating a tidal wave of forced buying. They are all competing for a limited pool of shares in the float, and that can send the price rocketing upward in just hours or days. That's a short squeeze in a nutshell.
The Catalyst Is King
It’s crucial to remember that a high short interest figure alone doesn't guarantee a squeeze. A heavily shorted stock can just keep drifting lower if the bears are proven right. The key is to monitor stocks with high short interest and hunt for that specific event that could change the market's perception and light the fuse.
The practical application of short interest metrics has become central to identifying these opportunities. Traders now look beyond just the raw percentage, incorporating things like short volume ratios to gauge daily sentiment and institutional put/call ratios, since many big funds use options to bet against a company. You can find some great examples of how professional firms rank squeeze candidates on Fintel.io.
Famous Short Squeezes and What We Can Learn
Theory is one thing, but seeing how it all plays out in the real world is where the real lessons are. The whole idea of a short squeeze can feel a bit abstract until you pull apart the mechanics of a few historic blow-ups. By dissecting these famous examples, we can see the direct line between sky-high short interest and explosive, life-changing price moves.
These case studies are perfect illustrations of what happens when extreme bearish sentiment crashes into an unexpected, powerful catalyst. They highlight the raw power of collective action, the panic of forced buy-ins, and the simple physics of supply and demand when the float gets tight.
The GameStop Saga: A Modern Classic
You can't talk about short squeezes without talking about GameStop (GME). Back in late 2020, GME was one of the most hated stocks on the street. Institutional investors were betting heavily against the struggling brick-and-mortar video game retailer, and on paper, it looked like a sure thing. The company’s fundamentals were weak, making it a prime target for short sellers.
The short interest of float for GME climbed to an unbelievable level, at one point soaring past 140%. Think about that for a second. More shares had been sold short than were even available for the public to trade. That's an incredibly dangerous spot to be in for anyone betting against the stock.
The spark that lit the fuse came from a massive, coordinated buying spree by retail traders on platforms like Reddit's WallStreetBets. They spotted the extreme short interest not as a weakness, but as a massive opportunity. Their collective buying pressure started nudging the stock price up, slowly but surely putting the squeeze on the hedge funds.
As GME’s price rocketed from around $17 to nearly $500 in January 2021, short sellers were forced to buy back shares at astronomical losses just to close out their positions. This frantic buying only poured more gasoline on the fire, creating one of the most legendary price spirals in stock market history.
The GME saga was a true perfect storm. It showed everyone just how vulnerable a stock with extreme short interest can be when a determined group of buyers decides to make a move. For a full play-by-play, check out our deep dive on what a short squeeze is in stocks.
Volkswagen: A Squeeze Decades in the Making
Long before GameStop was a twinkle in Reddit’s eye, the Volkswagen short squeeze of 2008 set the gold standard for market-shattering volatility. At the time, hedge funds were shorting Volkswagen in droves, convinced the stock was wildly overvalued in the middle of a global financial crisis. The short interest was high, but the real danger was buried deep within the company's ownership structure.
This squeeze wasn't triggered by a band of retail traders, but by another corporate giant: Porsche.
In a shocking Sunday announcement, Porsche revealed it had quietly gained control of 74.1% of Volkswagen's voting shares through a mix of direct holdings and options contracts. On top of that, the German government held another 20% that wasn't going anywhere. This bombshell meant the actual tradable float had shrunk to less than 6% of the company's total shares.
Here’s the problem: short positions accounted for roughly 12% of VW's outstanding shares. All of a sudden, short sellers needed to buy back twice as many shares as were even available to trade on the open market.
What followed was pure, unadulterated panic. In just two days, Volkswagen's stock price surged over 400%, briefly making it the most valuable company on the planet. This case teaches a critical lesson: understanding the true float and who owns the shares is just as important as the short interest percentage itself.
The Cautionary Tale: High Shorts Don’t Always Squeeze
It's just as important to look at the times when a squeeze didn't happen. Plenty of stocks carry a high short interest of float for months, or even years, without ever seeing that explosive pop. This is what happens when the bears are fundamentally right and no positive catalyst ever shows up to change the story.
Take, for instance, a biotech company that suffers a failed clinical trial for its lead drug. It will almost certainly attract a ton of short interest. But if that company has nothing else promising in its pipeline, there's simply no reason for buyers to step in and fight the downtrend.
Here’s why high short interest is never a guarantee:
- A Correct Bearish Thesis: Sometimes, the short sellers are just right. The company really is in trouble.
- Lack of a Catalyst: Without a piece of unexpected good news—a surprise partnership, a buyout offer, a positive earnings report—there’s nothing to force shorts to cover their positions.
- Sufficient Liquidity: If a stock has a large enough float, even significant buying pressure can be absorbed without causing a major price spike.
These counterexamples are a vital reality check. High short interest tells you there's potential for fireworks, not a promise. It loads the cannon, but you still need a catalyst to light the fuse.
Where to Find Reliable Short Interest Data

Any trading strategy built around short interest of float is only as good as the data fueling it. Let’s be clear: accurate, timely information is everything, but getting your hands on it can be a real challenge. The world of short interest data is basically split into two camps: the official, slow-moving sources and the faster, specialized providers.
Figuring out the difference—and the built-in limitations of each—is non-negotiable. The speed and quality of the numbers you’re looking at can completely change your ability to make a smart move, especially when you're tracking a heavily shorted stock that could pop at any moment.
The Problem with Official Exchange Data
The major exchanges like the NYSE and NASDAQ, along with FINRA, are the official record-keepers for short interest data. They gather this info from all their member firms and then release it to the public twice a month, usually around the middle and end of the month.
Now, this data is rock-solid and comprehensive. No one doubts its accuracy. But its biggest flaw is a massive time lag. By the time this information gets to you, it’s often a week or more out of date. In today's markets, a week is an eternity. This makes the official data more of a historical snapshot than a tool you can actually trade with in real-time.
The bi-monthly reporting schedule of official exchanges means traders are often looking in the rearview mirror. A stock's short interest landscape could completely change between reporting periods, leaving traders unaware of emerging risks or opportunities.
This delay makes it nearly impossible to react quickly. By the time the official numbers confirm a huge spike in short interest, the best part of the trade might have already come and gone.
The Rise of Third-Party Data Providers
To solve this critical data lag, a new breed of specialized third-party data providers has stepped up. These firms don’t bother waiting for the slow official reports. Instead, they pull together data from a whole network of sources to give you something much closer to a real-time estimate.
So, where do they get their information? It's usually a mix of a few key things:
- Securities Lending Data: They’re plugged into the supply and demand for shares being loaned out to short sellers from prime brokers and big institutional lenders.
- Brokerage Data: They collect information from various brokerage firms, tracking the shorting activity of their clients.
- Proprietary Algorithms: They use sophisticated models to estimate short interest based on trading volumes, price action, and other market signals.
This approach gives traders a huge leg up. It transforms short interest from a stale, historical number into a dynamic, actionable metric. The delivery and frequency have gotten incredibly sophisticated to keep up with what modern traders need.
Take, for instance, S3's Short Interest and Securities Finance dataset, which pushes out updates hourly for over 40,000 global securities. This isn't just a guess; it's aggregated from proprietary sources that process over five million transactions a day, blended with feeds from all the major players and regulatory filings. You can get more details on how S3 gathers this high-frequency data. For traders using a platform like ChartsWatcher, integrating this kind of data means you can spot crowding events that signal new opportunities almost as they happen.
By using tools that tap into this high-frequency data, you can stay ahead of the curve. You're able to spot shifts in the short interest of float as they unfold, not weeks after the fact. That's how you build a trading strategy that's responsive and truly effective.
Building a Short Squeeze Watchlist with ChartsWatcher
Knowing the theory behind short interest of float is one thing, but actually turning that knowledge into a profitable trading plan is where the rubber meets the road. This is where a powerful tool like ChartsWatcher becomes your best friend, helping you shift from just learning concepts to actively hunting for the next big short squeeze.
Instead of getting lost sifting through thousands of stocks by hand, you can build a custom screener to do the heavy lifting. The trick is to start with a wide net and then layer on more specific criteria to zero in on stocks with the highest probability of making an explosive move.
The ChartsWatcher dashboard is designed to be a flexible workspace where you can combine screeners, alerts, and charts into one command center for market analysis.
This setup lets you pull together toplists, alerts, and charts into a single, cohesive view, making your analysis way more efficient.
Step 1: Set Your Primary Short Interest Filter
The foundation of any good short squeeze watchlist is, you guessed it, the short interest of float. This is your first and most important filter. It’s how you’ll cut down the entire market into a manageable list of heavily shorted stocks.
Start by setting a minimum threshold. A solid starting point for a high-potential watchlist is a short interest of float above 20%. This simple filter instantly weeds out everything except stocks where a meaningful number of traders are betting against it, creating the "fuel" needed for a potential squeeze.
Step 2: Add Secondary Confirmation Indicators
A high short interest is a must-have, but it’s not enough on its own. The best candidates show other signs of life and building pressure. To really refine your list, you need to add a few secondary filters that look for unusual activity.
Here are a few critical indicators to layer on top of your initial screen:
- High Relative Volume: You're looking for stocks trading at a much higher volume than their daily average. A relative volume of 2.0 or more means the stock is trading at twice its normal pace, a clear signal that interest is surging.
- Positive Price Momentum: A squeeze needs a spark, and that spark is upward price movement. Filter for stocks that are already trading above key moving averages (like the 50-day SMA) or are showing green candles over the last few trading sessions.
- Low Float: While this isn't always a direct screener setting, keep a close eye on the float size of the stocks that pop up. Stocks with a smaller float—say, under 100 million shares—are often more volatile and can squeeze much more dramatically when buying pressure kicks in.
By combining high short interest with high relative volume and positive price momentum, you're not just finding stocks with squeeze potential—you're finding stocks where that potential might be starting to unlock right now.
Step 3: Set Strategic Price Alerts
Once your watchlist is built, the final step is to make it actionable. A list of tickers is pretty useless if you aren't ready to act when the moment is right. This is where setting price alerts becomes your most powerful tool.
For each stock on your list, pull up a chart and identify key resistance levels or recent highs. Then, set an alert in ChartsWatcher to ping you the moment the stock price breaks above that level. This breakout is often the catalyst that forces shorts to start covering, and your alert ensures you know about it the second it happens.
This proactive approach turns your watchlist from a static list into a dynamic trading system, ready to capture opportunities as soon as they appear.
Common Questions About Short Interest
Even after you get the hang of the basics, putting short interest data into practice brings up a lot of questions. Let's tackle some of the most common ones that pop up for traders.
Think of this as a quick-reference guide. Getting these details right is what separates a good guess from an informed trading decision.
What Is a Good Percentage for Short Interest of Float?
This is probably the number one question traders ask, and the honest answer is: context is everything. There’s no single magic number, but there are definitely thresholds that should grab your attention.
As a general rule of thumb, anything below 10% is pretty low. You wouldn't really consider that significant bearish pressure. Once it creeps into the 10% to 20% range, that’s when you start seeing some elevated negative sentiment. It’s a stock worth keeping an eye on.
When the short interest of float gets above 20%, that's when things get interesting. This is high, and it's the level where a stock officially makes it onto a serious short squeeze watchlist. It signals a very crowded trade on the short side.
If you ever see a number above 40%, that's extremely rare and signals a ton of tension. These are the stocks with the most explosive potential for a squeeze if any good news drops.
How Often Is Short Interest Data Updated?
The answer to this question depends entirely on where you're getting your data, and for active traders, this detail is critical.
The official exchanges like the NYSE and NASDAQ, along with FINRA, only publish their comprehensive reports twice a month. This means the data is always looking in the rearview mirror. It's more of a historical snapshot than a tool for making moves today.
On the other hand, specialized platforms give you a much more current view. They tap into securities lending data and use their own models to pump out daily, or sometimes even intra-day, estimates. This is the kind of timely information you need to get a real feel for what's happening right now.
Does High Short Interest Guarantee a Squeeze?
Absolutely not. If you only remember one thing from this guide, make it this. High short interest is a precondition for a squeeze, but it is never, ever a guarantee.
Think of it like this: a high short interest of float is the gasoline. A huge pile of short sellers means there's a huge pool of potential buyers who will be forced to cover their positions. But you still need a spark to light that fuel.
Without a catalyst—a surprise earnings beat, a big partnership announcement, an unexpected FDA approval, or even just a broad market rally—that heavily shorted stock can just keep drifting lower. Sometimes, the bears are simply right.
Ready to turn theory into action? With ChartsWatcher, you can build custom screeners to find high-potential short squeeze candidates and set real-time alerts so you never miss a breakout. Take control of your trading strategy by visiting https://chartswatcher.com.
