A Trader's Guide to Short Float Percentage
The short float percentage gives you a quick, powerful snapshot of market sentiment. It tells you exactly what portion of a company’s publicly traded shares are being bet against by short sellers.
This is a critical number for any trader's watchlist. A high percentage can point to deep-seated problems within a company, but it can also signal a stock that's primed for a massive price surge. Getting a handle on this metric is your first step toward spotting some truly unique trading setups.
What Short Float Percentage Tells You About a Stock

Imagine the stock market as a massive, ongoing debate. You've got buyers on one side, convinced a stock's price is headed up. On the other side, you have sellers who are just as sure it's going down.
The short float percentage is like a public poll of that debate. It shows you exactly how many people are loudly and financially backing the "going down" argument. It's a direct measure of bearish conviction.
To really get it, you need to understand the two pieces that make it up: short selling and the stock's float.
The Building Blocks of Short Float
Let’s break these two concepts down. They’re simpler than they sound.
-
Short selling is when a trader borrows shares of a stock and sells them immediately. The goal is to buy those same shares back later at a lower price, return them to the lender, and pocket the difference. It's a direct bet on a price drop.
-
The stock float is the total number of a company's shares that are actually available for you and me to trade on the open market. It leaves out shares locked up by insiders, governments, or other major controlling groups. This is the real-world supply of shares.
So, the short float percentage is simply the number of shorted shares divided by the stock float. If a company has 10 million shares in its float and 3 million of them have been sold short, the short float percentage is a hefty 30%.
When you combine these two ideas, you get a powerful data point. It’s not just about how many bears are out there; it's about what percentage of the tradable supply they are betting against.
For those who want to explore this metric in even greater detail, this comprehensive guide to short float is an excellent resource.
A Quick Guide to Interpretation
So, what does that percentage actually mean? Is 10% high? Is 40% a screaming signal? While context is everything, here’s a general framework for how traders often interpret these numbers.
Short Float Percentage Quick Interpretation Guide
| Short Float % Range | Market Sentiment | Potential Implication |
|---|---|---|
| 0-10% | Low / Neutral | Very little bearish pressure. Generally seen as normal for most healthy stocks. |
| 10-20% | Moderate / Elevated | A notable number of investors are betting against the stock. Worth investigating the reasons for the pessimism. |
| 20-40% | High / Bearish | Significant bearish sentiment. Suggests potential fundamental issues or that the stock is a popular short target. |
| 40%+ | Extremely High | Extreme pessimism. The stock is heavily shorted and could be a major short squeeze candidate if good news hits. |
Remember, this table is just a starting point. A high short float in a struggling company is very different from a high short float in a company that's simply controversial or in a volatile sector.
Interpreting the Signals: Warning or Opportunity?
This is where the real art of trading comes in, because a high short float can mean two completely opposite things.
-
A Warning Sign: More often than not, a high short float means smart money has sniffed out trouble. It could be anything from declining revenue and weak management to an obsolete product or even accounting games. The crowd is often short for a good reason.
-
An Opportunity: On the flip side, a heavily shorted stock is like a coiled spring. If any unexpected positive news drops—a surprise earnings beat, a clinical trial success, a buyout rumor—the short sellers are forced to buy back shares to cut their losses. This rush of forced buying can trigger a "short squeeze," sending the stock price into the stratosphere.
This dual nature is precisely what makes the short float percentage such a compelling tool. It instantly points you toward stocks where sentiment is at an extreme, and that's where the biggest moves often happen.
The Math Behind Short Float
Figuring out the short float percentage isn't some complex Wall Street secret; it's just simple arithmetic. But don't let the simplicity fool you. This little calculation is one of the most powerful tools a trader has for quickly judging market sentiment.
The formula itself relies on just two key pieces of data to reveal how much bearish pressure a stock is under.
Short Float % = (Number of Shares Sold Short / Stock Float) x 100
In plain English, this tells you what slice of a company’s publicly tradable shares is being used to bet against it.
The Two Core Components
To run this calculation, you first need to grab two numbers.
-
Shares Sold Short: This is the total number of shares that traders have borrowed and then immediately sold on the open market. They're banking on the stock price dropping so they can buy those shares back cheaper later on, return them to the lender, and pocket the difference. It’s a direct measure of bearish activity.
-
Stock Float: This figure is all about availability. It represents the shares of a company that are actually available for you and me to trade on the open market. It importantly excludes shares held by insiders, large institutions, or governments—basically, any shares that are locked up and not circulating freely.
This infographic breaks down how these two pieces fit together.
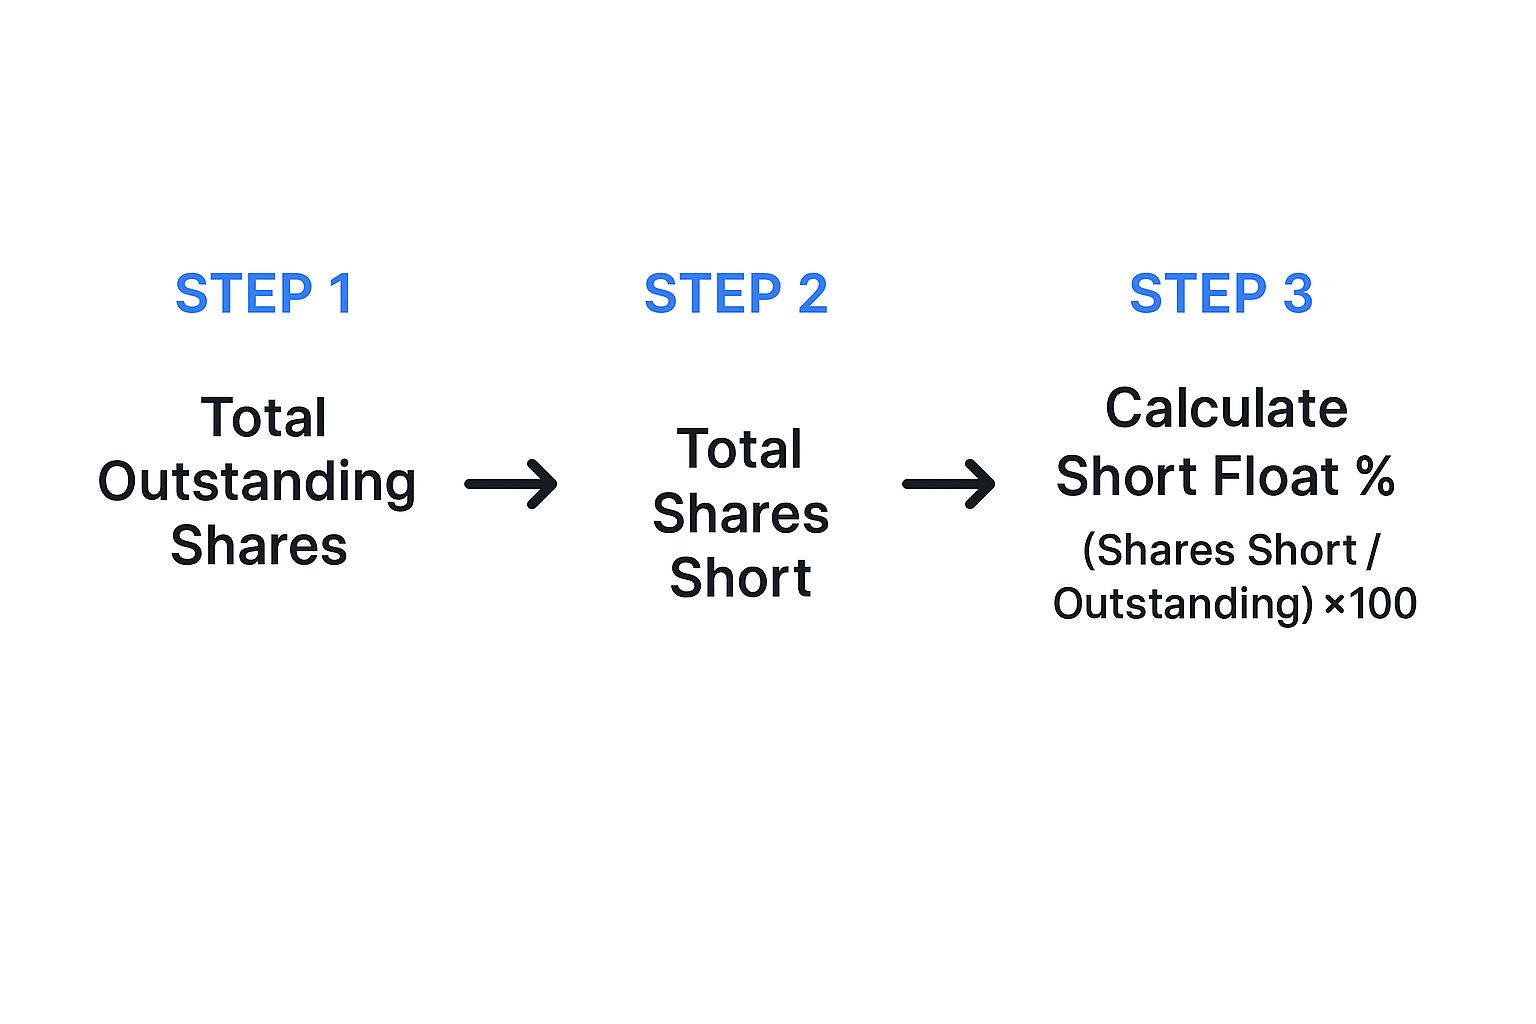
As you can see, it’s a logical flow. You start with the total shares available to the public and then figure out what percentage of that pile has been shorted.
A Practical Calculation Example
Let's put this into action with a made-up company, "Momentum Machines Inc.," to see how it works in the real world.
Here’s the breakdown for Momentum Machines:
- Total Outstanding Shares: 150 million
- Restricted Shares (held by insiders): 30 million
- Shares Sold Short: 18 million
First, we need the stock float. We get that by taking the total shares and subtracting the ones that aren't available for trading.
Stock Float = 150 million (Outstanding) - 30 million (Restricted) = 120 million shares
Now that we have the float (120 million) and the shares sold short (18 million), we can plug them into our formula.
Short Float % = (18 million / 120 million) x 100 = 15%
So, Momentum Machines Inc. has a 15% short float. This would generally be considered a "moderate" or even "elevated" level of negative sentiment. For any trader looking at this stock, that 15% figure is a bright, flashing signal that deserves a much closer look.
Where to Find This Data
The good news is you don't have to go digging for these numbers like a detective. This data is readily available from plenty of reliable sources.
Major exchanges like the NYSE and NASDAQ publish official short interest data twice a month. Better yet, most quality financial data sites and trading platforms—including ChartsWatcher—pull this information for you, displaying the short float percentage right on the stock's profile. You can skip the calculator and get straight to the analysis.
Unpacking the Mechanics of a Short Squeeze

This is where things get really interesting. The short float percentage isn't just a dry statistic; it's the key ingredient for one of the most explosive events in the market: the short squeeze. A high short float on its own simply tells you a lot of people are betting against a stock. But add the right catalyst, and that bearish sentiment can ignite a wildfire of panicked buying that throws all fundamentals out the window.
Think of a crowded theater filled with everyone who shorted the stock. The only way out is a single, tiny exit door, representing the limited number of shares available to buy. Suddenly, someone yells "Fire!"—this is your positive news catalyst. Everyone makes a frantic dash for that one small door at the exact same time. The stampede that follows is the short squeeze.
This isn't just an emotional rush. For short sellers, it’s a matter of financial survival. As the stock price rips higher, their potential losses are, in theory, infinite. They are forced to buy back shares at any price simply to close their positions and stop the financial bleeding. This sudden flood of mandatory buy orders is what creates the violent, upward spiral.
The Anatomy of a Squeeze
A short squeeze unfolds in a predictable, yet chaotic, chain reaction. Each step feeds the next, creating a powerful momentum loop.
- High Short Float Sets the Stage: It all starts with a stock carrying a significant short float, often anything above 20%. This large pool of short-sellers creates a built-in reservoir of future buyers.
- A Positive Catalyst Strikes: This is the spark. It can be any piece of news the market sees as unexpectedly positive—a blowout earnings report, a new product launch, a surprise FDA approval, or even a buyout rumor.
- Initial Price Jump: The catalyst triggers an initial, sharp pop in the stock price as new, optimistic buyers jump in. This move immediately puts many short sellers "underwater" on their positions.
- Forced Buying Begins: As the price climbs, brokers start making margin calls, demanding short sellers deposit more money to cover their growing losses. To stop the pain or avoid the call, shorts start buying back the shares they borrowed. This is called "covering."
- The Feedback Loop Ignites: This is the heart of the squeeze. The covering from short sellers adds massive buying pressure, which pushes the price even higher. This, in turn, trips the stop-losses of other short sellers and triggers even more margin calls, forcing them to cover, too. This self-sustaining cycle of buying is what causes the price to go parabolic.
A Historic Case Study: GameStop
No event demonstrates the raw power of a short squeeze quite like the GameStop saga of early 2021. For months, hedge funds and other institutions had heavily shorted the video game retailer, convinced its brick-and-mortar business was doomed.
The bearish bet was extreme. At its peak, GameStop's short float was an unbelievable 140% of its public float, partly due to synthetic positions created through options. This setup was a powder keg waiting for a match. A group of retail traders on social media spotted this vulnerability and started buying shares in a coordinated effort.
The result was one of the most spectacular short squeezes in modern history. The buying frenzy forced hedge funds to cover their massive short positions at staggering losses, launching GME's stock from under $20 to over $480 a share in just a few weeks.
GameStop was a perfect, albeit extreme, illustration of these mechanics in action. The massive short float was the fuel, the coordinated retail buying was the catalyst, and the explosive price action was the feedback loop. This market analysis of the short float dives deeper into this historic event, cementing the powerful link between a high short float percentage and the potential for these dramatic setups.
How to Interpret High Short Float Levels
A high short float percentage is like a giant flashing sign on a stock, and it’s impossible to ignore. But what is it trying to tell you? Is it a warning of an imminent crash or a flare signaling a potential rocket launch? The truth is, the number itself is just the start of the story.
To make any sense of this metric, you need to understand what "high" really means in the wild. Without some clear benchmarks, you're just guessing. That's why experienced traders have mental categories for short float levels to guide their analysis and keep them from making emotional decisions.
Establishing Your Benchmarks
While every stock has its own unique story, you can use some general tiers to quickly size up the level of bearish sentiment. Think of it like a threat level indicator, shifting from calm to critical.
-
Low (Under 10%): This is the "all clear" zone. A short float percentage in this neighborhood is perfectly normal and doesn't suggest any major, organized bearish pressure. Most healthy companies hang out here.
-
Moderate (10% to 20%): Now things are getting interesting. A float in this range means a notable number of traders are betting against the stock. It’s a yellow flag—time to start asking "why?"
-
High Alert (Over 20%): Once a stock blows past the 20% mark, it’s officially in high-alert territory. This signals serious, widespread pessimism from the market. A stock this heavily shorted is either facing fundamental disaster or has become a powder keg for a short squeeze.
A common rule of thumb among traders is that a short float percentage over 20% is a big red flag for bearish sentiment. But that very same level is what creates the explosive potential for a short squeeze if any good news forces short sellers to buy back their shares. You can see a great analysis of short float metrics and how these situations unfold.
These tiers give you a solid foundation. They let you cut through the market noise and zero in on stocks where sentiment has hit an extreme, setting the stage for a potentially massive price move.
The Crucial Role of Context
A high short float percentage on its own means almost nothing. It's never a standalone signal to buy or sell. The why behind the number is infinitely more important than the number itself.
Think about two different companies, both with a 30% short float.
-
Company A just dropped a disastrous earnings report. Revenue is tanking, debt is piling up, and the CEO just bailed. In this case, the high short float is a completely logical reaction to awful news. The bears are probably right.
-
Company B is a disruptive tech firm with a wild, unproven product. It has zero revenue, so old-school analysts are skeptical. But it’s also rumored to be on the verge of announcing a game-changing partnership. Here, the short interest represents a battle between skepticism and optimism.
In the first scenario, betting against the shorts is like trying to swim up a waterfall. In the second, it could be the opportunity of a lifetime.
Digging Into the "Why"
Once a stock with a high short float lands on your radar, it's time to put on your detective hat. You need to figure out the specific reasons that are attracting so many bears. Usually, it boils down to a few common culprits:
- Poor Fundamentals: This is the most common reason. Look for a history of earnings misses, shrinking profit margins, or a weak balance sheet.
- Sector-Wide Headwinds: Sometimes, it’s not the company but the entire industry that's out of favor. Think of fossil fuel companies during a green energy boom or brick-and-mortar retail in the age of e-commerce.
- Credible Accusations: Nothing attracts short sellers like blood in the water. Allegations of fraud, accounting scandals, or other major problems are a huge magnet for bearish bets.
- Overvaluation Concerns: The company might be perfectly fine, but its stock price may have shot up way too far, way too fast, making it a prime target for a reality check.
By understanding the real reason for the high short float percentage, you can make a much smarter call on whether the bears have it right or if the crowd has created a powerful trading opportunity for you.
Finding High Short Float Stocks With ChartsWatcher

Understanding the theory behind short float is one thing, but turning that knowledge into actual, tradable ideas is where the real work begins. A high short float percentage is just a number on a screen. To find real opportunities, you need a powerful tool that can cut through the noise of thousands of stocks to find the few that meet your specific criteria.
This is exactly why a dedicated stock screener is a trader's best friend. Think of it as a team of tireless research assistants, constantly scanning the market for setups that fit your strategy. Instead of spending hours manually checking charts, a screener automates the discovery process, saving you time and uncovering opportunities you would have almost certainly missed.
Building Your Custom High Short Float Scan
Let’s get our hands dirty and build a custom scan designed specifically to hunt for potential short squeeze candidates using the ChartsWatcher stock scanner. The goal isn't just to find highly shorted stocks, but to build a focused list of names that are actually tradable.
The interface is built to be intuitive, allowing you to stack criteria on top of each other logically.
Our first, and most critical, filter is the short float percentage itself. We need to find stocks where the bears are already piled in, creating that coiled-spring potential for a squeeze.
- In the scanner, navigate to the Filters menu.
- Find and select the Short Float % filter.
- Now, set the parameter to > 20%. This one move tells the screener to ignore everything else and only show us stocks in that "High Alert" zone we talked about earlier.
This single filter is the bedrock of our entire scan, as you can see right here.
By setting this floor, we've instantly cut the entire market down to a much more manageable list of heavily bet-against companies.
Layering Filters For A Robust Strategy
A high short float is a fantastic starting point, but it's not the whole story. Many of these stocks are shorted for a good reason—they might be illiquid penny stocks or just too expensive to trade effectively. We need to add more filters to clean up our results and improve the quality of our list.
Key Insight: The best scans are layered. Each filter you add acts like a finer sieve, catching the junk and letting only the prime candidates fall through into your watchlist.
Here are the essential filters to layer on top of our Short Float % > 20% rule:
-
Average Daily Volume: This is non-negotiable. Liquidity is king. A stock with no volume is a trap, making it impossible to get in or out without wrecking the price. A solid starting point is setting Average Daily Volume > 500,000 shares. This ensures there's enough action to support your trades.
-
Price: You need to trade what fits your account and risk tolerance. Use the Price filter to set a comfortable range, something like $5 to $100. This immediately weeds out the super-speculative penny stocks and the blue-chips that are too pricey for most retail traders.
-
Market Capitalization: Sometimes, the most explosive moves happen in smaller, more nimble companies. You can add a Market Cap filter to focus on small- to mid-cap stocks, for instance, between $300 million and $2 billion.
This kind of flexibility is what makes a powerful screener so valuable. If you want to see how other tools stack up, you can find great information in guides covering the top stock screener apps.
To put it all together, here is a template for a powerful scan you can build in ChartsWatcher to find these potential squeeze plays.
Sample ChartsWatcher Scan For Short Squeeze Candidates
| Filter Name | Parameter Setting | Rationale |
|---|---|---|
| Short Float % | > 20% | This is our core requirement. It targets stocks with significant bearish sentiment. |
| Avg. Daily Volume | > 500,000 | Ensures the stock is liquid enough to enter and exit trades without major slippage. |
| Price | $5 - $100 | Filters out highly speculative penny stocks and overly expensive blue-chips. |
| Market Cap | $300M - $2B | Focuses the search on smaller, more volatile companies where squeezes can be more dramatic. |
By combining these filters, you move from a generic concept—"high short interest"—to a focused, high-potential watchlist tailored precisely to your trading style.
Managing the Risks of High Short Float Trades
A high short float percentage is a classic double-edged sword. Seeing one can be exciting, but ignoring the dangerous side is a recipe for disaster. While the potential for a short squeeze gets all the attention, a high short float is never a simple buy signal on its own.
Often, the "crowd" is shorting a stock for very good reasons. The company's fundamentals might be crumbling, management could be making poor decisions, or the entire sector could be facing headwinds. When you bet against a large group of informed traders, you better have some compelling evidence on your side. Otherwise, it's a high-risk gamble that can get very expensive, very fast.
The Value Trap Scenario
One of the most common pitfalls here is the classic value trap. This is when a heavily shorted stock looks cheap on paper. Traders get tempted to buy in, thinking they've found a bargain before a big rebound. But instead of bouncing, the price just keeps grinding lower as the company’s underlying problems get worse.
In these situations, the high short float isn't fuel for a squeeze; it's a reflection of a grim reality. The short sellers were right all along. Anyone who bet against them is left holding a losing position. This is why relying on a single metric without doing your homework is so dangerous.
Remember, the market can remain irrational longer than you can remain solvent. A high short float might stick around for months or even years as a stock slowly bleeds out, punishing anyone who tries to call a bottom too early.
Debunking the Short Squeeze Myth
It’s a huge misconception that every stock with a high short float is a ticking time bomb, destined for a parabolic squeeze. The truth? Most of them never do. A true short squeeze is a rare event that requires a perfect storm of conditions to even get started.
The single most important ingredient is a powerful, unexpected catalyst. Without a positive news event to shock the market and force short sellers into a panic-covering frenzy, a high short float is just a number on a screen. It’s potential energy that never turns into kinetic action. Waiting for a squeeze without a catalyst is a strategy based on hope, not analysis.
To protect your capital and avoid getting trapped by confirmation bias, you have to look beyond this one data point.
- Due Diligence is Non-Negotiable: Dig into the company. What do its financials look like? How does it stack up against competitors? Who is on the management team? You need to understand why the stock is being shorted in the first place.
- Timing and Catalysts: Look for potential events on the horizon. Upcoming earnings reports, new product launches, or regulatory decisions could be the spark that ignites a real move.
- Risk Management: This is non-negotiable. Always use stop-losses and smart position sizing to limit your downside. No single trade should ever have the power to cripple your portfolio.
For traders aiming to build a more resilient plan, developing a solid risk management framework is an essential first step. Beyond the unique dangers of these trades, understanding the broader principles of investment risk management can seriously fortify your approach. And just for context, it's rare for short float percentages to go much higher than 50% of a company's float—at those extreme levels, the shorting just becomes unsustainable.
Of course. Here is the rewritten section, crafted to sound like an experienced human expert while adhering to all your requirements.
Answering Your Questions About Short Float
Once you start digging into short float, a few practical questions almost always come up. Let's tackle the most common ones to clear up any lingering confusion and get you ready to put this data to work.
Think of this as moving from the textbook to the trading floor.
How Often Is Short Float Data Updated?
This is a big one. Unlike the stock quotes zipping across your screen every second, short interest data has a bit of a delay. The major exchanges, like the NYSE and NASDAQ, gather all the data and then publish it twice a month.
While it's not a live feed, this bi-monthly snapshot is more than enough for traders to track shifts in bearish sentiment. It’s a crucial piece of the puzzle, especially for spotting stocks that might be coiled up for a big move. If you're curious about the specific reporting schedule, you can find more details on how short float data is published.
What Is the Difference Between Short Interest and Short Float?
These two terms sound almost identical and are often mentioned in the same breath, but they tell you very different things. Nailing this distinction is key to getting your analysis right.
- Short Interest: This is just the raw count of shares sold short. Think of it as a simple tally. For instance, a stock might have a short interest of 5 million shares.
- Short Float Percentage: This is where context comes in. It takes that raw number and compares it to the stock's float—the actual pool of shares available for public trading.
Key Takeaway: Short interest tells you how many shares are being bet against. The short float percentage tells you how crowded that bet really is. A 5 million share short interest is a massive red flag for a company with a 10 million share float (50% short float), but it’s barely a blip for a company with a 100 million share float (5% short float).
What Kind of Catalyst Can Ignite a Short Squeeze?
A high short float is like a room full of gasoline fumes. It creates the potential for an explosion, but you still need a match to set it off. A catalyst is that match—an unexpected piece of good news that sends short sellers scrambling for the exits.
Some of the most common catalysts include:
- Positive Earnings Surprise: The company blows past Wall Street's expectations for revenue or profit.
- Major Contract or Partnership: News of a game-changing deal with a big, respected company can instantly change the story.
- Favorable Regulatory News: This is a huge deal for biotech firms, like when a company gets FDA approval for a new drug.
- Buyout Rumors or Offers: Nothing gets shorts covering faster than the prospect of an acquisition, which usually happens at a premium to the current price.
Learning to anticipate these potential catalysts is what separates a good trading setup from a great one, especially when you're hunting for high short float stocks.
Ready to stop searching and start finding? The ChartsWatcher stock scanner empowers you to build custom scans for high short float stocks, filter for liquidity, and pinpoint your next great trade in minutes. Take control of your market analysis with ChartsWatcher today.
