A Trader's Guide to Liquidity in Stocks
Before you even think about placing a trade, there’s one critical factor that can make or break your bottom line: liquidity.
Think of a highly liquid stock like a bustling city market. You can buy or sell instantly, and the prices are stable and predictable. On the flip side, an illiquid stock is like a deserted country road stall—transactions are slow, difficult, and you’ll likely pay a hefty price for the trouble.
Why Stock Liquidity Is a Trader's Most Important Metric

Understanding liquidity in stocks isn't just some academic exercise; it's a core skill that directly hits your trading performance. It dictates how fast you can get in or out of a position and, more importantly, how much you’re losing to hidden costs like slippage.
Slippage is that frustrating moment when the price you actually get is different from the price you expected. In an illiquid market with few buyers and sellers, even a moderately sized order can push the price against you, eating into your profits before the trade has even started.
Before we dive deep, here’s a quick overview of the key concepts we'll be breaking down.
Key Takeaways on Stock Liquidity
| Concept | What It Means for a Trader |
|---|---|
| Bid-Ask Spread | The immediate, built-in cost of trading. A tight spread is good; a wide one is a red flag. |
| Market Depth | Shows how many shares are waiting to be bought or sold at different price levels. Deep markets absorb large orders easily. |
| Trading Volume | The total number of shares traded. High volume usually signals strong interest and good liquidity. |
| Price Impact | How much your own trade moves the stock's price. In illiquid stocks, even small trades can cause big swings. |
| Liquidity Risk | The danger of getting stuck in a position you can't sell, or having to sell at a huge loss. |
This table is just the starting point. Understanding these ideas is what separates novice traders from seasoned professionals.
The Foundation of Efficient Trading
A solid grasp of liquidity protects your capital and makes sure your trading strategy is built on solid ground. It helps you answer crucial questions before risking a single dollar:
- Can I dump this stock quickly if the market turns on me?
- How much is it really going to cost me to get in and out of this position?
- Is there enough action in this stock to handle my trade size without causing a price shock?
Ignoring these questions is a classic rookie mistake. High liquidity offers stability and predictability, while low liquidity is a breeding ground for risk and uncertainty.
Think of it this way: liquidity is the grease in the gears of the stock market. Without enough of it, the machine grinds to a halt, transactions get expensive, and the risk of getting stuck in a bad trade skyrockets.
This guide will demystify stock liquidity, taking you from the basic principles to the advanced tactics the pros use every day. For more on investment strategies from a platform's perspective, the Digest Invest podcast by eToro is a great resource. By the end of this article, you'll have a complete framework for making smarter, more informed trading decisions.
Decoding the Core Components of Market Liquidity

Liquidity isn't some abstract feeling or a vague market mood. It’s a tangible, measurable characteristic built on components you can actually see and analyze. By breaking it down, you can move from just guessing to making informed calls about a stock's tradability.
These components work together, much like the vital signs a doctor checks. No single metric tells the whole story, but combined, they paint a clear picture of how easily and efficiently you can get in and out of a stock.
The Bid-Ask Spread: The Immediate Cost of Trading
The first and most direct measure of liquidity is the bid-ask spread. Think of it as the small, unavoidable fee you pay for the convenience of an immediate transaction. It’s simply the difference between the highest price a buyer is willing to pay (the bid) and the lowest price a seller is willing to accept (the ask).
For example, if a stock's bid is $100.00 and its ask is $100.05, the spread is five cents. This tiny gap represents the profit market makers earn for keeping the market flowing. A tight spread, often just a penny for a behemoth like Apple (AAPL), signals intense competition and tons of liquidity.
On the flip side, a wide spread—say, a $50.10 bid and a $50.50 ask—is a massive red flag. That $0.40 gap means you’d instantly be down that amount per share just by buying at the ask and immediately selling at the bid.
The bid-ask spread is the most fundamental cost of entry and exit. For active traders, a wide spread can silently drain profits, turning a winning strategy into a losing one over time.
Trading Volume: The Pulse of Market Interest
Next up is trading volume, which is the total number of shares that change hands over a set period, usually a day. If the spread is the cost of a trade, volume is the measure of market activity—its pulse.
High volume tells you that tons of people are actively buying and selling, making it easy to find someone to take the other side of your trade.
A stock that trades 50 million shares a day is like a bustling highway; you can merge in and out of traffic with ease. But a stock trading only 10,000 shares a day is a quiet country lane. Trying to shove a big order through is like trying to drive a semi-truck down that lane—you’re going to get noticed and cause a major jam.
High volume is crucial because it typically leads to:
- Tighter Spreads: More competition between buyers and sellers naturally narrows the bid-ask gap.
- Price Stability: A deep pool of participants means one large order is less likely to cause a crazy price swing.
- Faster Execution: Your orders get filled in a snap because there's always someone on the other side.
Getting a handle on these foundational metrics is a great start. To go deeper, you can also check out our detailed guide on what market liquidity is and why it's so critical for traders.
Market Depth: The Hidden Iceberg of Orders
While volume shows you what has happened, market depth gives you a peek into the immediate future. It reveals all the buy and sell orders waiting at different price levels beyond the current best bid and ask, often visualized in a Level 2 order book.
Think of the current bid and ask as just the tip of an iceberg. Market depth shows you the massive, hidden structure of orders sitting just below the surface. A "deep" market has a thick wall of buy orders stacked up below the current price and a thick wall of sell orders above it.
This depth is what gives a market its resilience. It tells you how much buying or selling pressure a stock can take before its price is forced to move in a big way.
- Deep Market: If you need to sell 10,000 shares, a deep market might have enough buy orders sitting at or just below the current bid to soak up your entire order with almost no price impact.
- Thin Market: In a market with poor depth, selling those same 10,000 shares could chew through multiple price levels, causing the stock to tank as your order gets filled at worse and worse prices.
Together, the bid-ask spread, trading volume, and market depth form a powerful framework for sizing up a stock's real liquidity. Each metric offers a unique angle, and a skilled trader learns to read them in concert to gauge risk and opportunity before ever hitting the buy or sell button.
Using Advanced Liquidity Metrics Like a Pro
Moving beyond the basic metrics of volume and spread is what separates proficient traders from the rest of the pack. To really get a feel for liquidity in stocks, you have to start using the tools professionals rely on to see beneath the surface of the day-to-day market chatter.
These advanced metrics give you a much sharper, more nuanced view of how a stock actually behaves. They help answer the big questions: "How intensely is this stock really being traded?" and "What's going to happen to the price if I drop a large order in right now?"
Let's break down these powerful indicators.
Gauging Trading Intensity with Turnover Ratio
One of the most insightful yet often overlooked metrics is the turnover ratio. This simple calculation tells you what percentage of a company’s total tradable shares (its float) changes hands over a certain period, usually a year.
Think of it this way: if a company has 100 million shares available for trading and its annual volume is also 100 million shares, its turnover ratio is 100%. That means, on average, every single share was bought and sold once during the year.
A high turnover ratio signals strong, broad investor interest and active trading—a good sign of healthy liquidity. A low ratio, on the other hand, might suggest that most shares are locked up by long-term investors or institutions who aren't trading. That can mean liquidity is thinner than it appears.
A stock might show decent daily volume, but a low turnover ratio can reveal a hidden trap: the same block of shares is just being passed back and forth by day traders. This creates an illusion of deep liquidity that can vanish the moment you need it most.
Understanding Price Impact: The True Cost of Size
Every single trade, no matter how small, nudges a stock's price. Price impact is the measure of how much a trade—especially a large one—actually moves the market. For anyone trading significant capital, this is a make-or-break concept.
Imagine dropping a huge boulder into a small pond versus dropping it into the ocean. In the small pond (an illiquid stock), the splash is massive, creating huge waves. In the ocean (a highly liquid stock), that same boulder barely makes a ripple.
Figuring out the exact price impact of your order means you need to analyze the order book's depth, a topic we dive into in our guide to understanding Level 2 data. A stock can have a tight bid-ask spread, but if the depth is shallow, a big order will chew through the available shares at the best price and start eating into progressively worse price levels. That's how you get killed by slippage.
Demystifying the Amihud Illiquidity Ratio
For those who want a more technical, standardized measure, the Amihud Illiquidity Ratio is a fantastic tool. The formula itself can look a bit intimidating, but the idea behind it is simple: it quantifies how much a stock’s price moves for every dollar of trading volume.
- High Amihud Value: A high ratio means that even a small amount of trading volume causes a large price swing. This is a classic sign of illiquidity.
- Low Amihud Value: A low ratio tells you the stock can soak up huge amounts of trading volume with minimal price movement, signaling excellent liquidity.
You don't need to calculate this yourself; many professional platforms provide this data. Its real value is giving you a single, standardized number to compare the liquidity of different stocks, cutting through the noise of daily fluctuations.
Analyzing liquidity is also a core focus for global market organizations. The World Federation of Exchanges (WFE), for instance, publishes over 350 different market data indicators. A key one is the Median Simple Spread, which measures the average bid-ask difference to provide a direct gauge of market liquidity. You can find more about these global market indicators on the WFE website.
These advanced metrics give you the tools to assess liquidity with professional precision, helping ensure you never get stuck in a trade you can't get out of.
How Liquidity Risk Can Silently Drain Your Portfolio
Knowing what liquidity is is one thing. Truly understanding its danger is another entirely. This brings us to liquidity risk—the hidden trap where you can't sell an asset when you need to without taking a massive hit on the price. It's the trader's nightmare scenario where the "sell" button feels like it’s just for show.
Picture this: you own a hefty position in a small biotech company. One morning, they announce a failed clinical trial, and sheer panic erupts. The stock price nosedives, but what’s worse is that the buyers have completely vanished. You're trapped. Every time you try to sell, you just push the price down even further. That, right there, is liquidity risk in action.
The Two Faces of Liquidity Risk
Liquidity risk isn’t just a niche problem; it’s a universal threat that shows up differently depending on how you trade.
For a day trader, this risk is a constant, immediate threat. Their entire strategy is built on tiny margins and split-second execution. A sudden liquidity vacuum means they can't dump a losing trade fast enough, turning what should have been a small, controlled loss into a portfolio-crushing disaster. Slippage goes through the roof, and what looked like a perfect setup just moments ago disappears into thin air.
For a long-term investor, the danger is more subtle but just as potent. They might be sitting on a large position in a company they believe in, only to realize too late that the stock is thinly traded. When it's finally time to sell—maybe to fund retirement or rebalance their portfolio—they discover their own sell order is big enough to crash the price. They’re then forced to bleed out their shares at a huge discount over weeks, or even months.
Liquidity risk is the market's ultimate trap door. It creates a situation where the price you see on the screen is purely theoretical because there’s no one on the other side willing to honor it at the volume you need.
This isn’t just a theoretical worry for retail traders; it’s a core concern for global financial institutions. The entire structure of global liquidity has changed. International credit to non-bank borrowers, for instance, has ballooned to 38% of global GDP, mostly through debt securities. This signals a massive shift where bond investors, not traditional banks, are now the main liquidity providers. You can dive deeper into these global liquidity indicators from the Bank for International Settlements (BIS).
Common Causes of Vanishing Liquidity
So, what makes the pool of buyers and sellers suddenly dry up? A few key events can trigger a liquidity crisis for a single stock or even the entire market.
- Negative Company-Specific News: A terrible earnings report, a regulatory crackdown, or a major product failure can make buyers disappear overnight.
- Sudden Market Shocks: Broader events, like geopolitical turmoil or a surprise economic report, can trigger a "flight to safety." Investors dump anything considered risky, and liquidity evaporates from all but the biggest, most stable stocks.
- Low Institutional Ownership: Stocks that aren't widely held by big funds and institutions often lack a reliable base of buyers and sellers, making them extremely vulnerable to sudden liquidity drops.
Spotting these warning signs is a survival skill. Before you even think about entering a position—especially in a smaller or lesser-known company—you have to assess not just the profit potential, but the potential of getting trapped.
To make this crystal clear, let's compare the characteristics of a highly liquid stock versus an illiquid one.
High Liquidity vs Low Liquidity Stock Characteristics
The table below breaks down the key differences you can spot to tell if a stock has healthy liquidity or if it's a potential trap waiting to spring.
| Characteristic | High Liquidity Stock (e.g., AAPL) | Low Liquidity Stock (e.g., a penny stock) |
|---|---|---|
| Bid-Ask Spread | Extremely tight, often just a penny. | Wide and unpredictable, costing you money on every trade. |
| Daily Volume | Millions or tens of millions of shares. | A few thousand shares, sometimes less. |
| Market Depth | Thick order book with many large orders at various prices. | Thin order book; one large order can wipe out levels. |
| Slippage | Minimal for most retail-sized orders. | Significant, even on small trades. |
| Price Impact | A large order has a minor, temporary effect on the price. | Even a small market order can send the price tumbling. |
| Execution | Orders fill instantly at or very near the quoted price. | Fills can be slow, partial, or at a much worse price. |
Ultimately, recognizing these signs is your best defense. A stock with a wide spread, a thin order book, and low volume is waving a giant red flag. Ignoring it means you're not just risking a loss on the trade itself—you're risking the ability to get out at all.
Smart Strategies for Trading in Any Liquidity Environment
Knowing the theory behind liquidity is one thing. Applying it when your money is on the line is a whole different ballgame. Truly successful trading happens when you can move from theory to action, navigating the market with a specific playbook for every situation. It's not enough to just label a stock "liquid" or "illiquid"; you need to know exactly how to behave in each environment.
Trying to use the same execution strategy for every trade is a rookie mistake that can get very expensive, very fast. The strategies you use—or fail to use—can shield you from hidden costs, reduce your footprint, and ultimately make or break your profitability. In the diverse world of stock liquidity, a one-size-fits-all approach is a guaranteed recipe for disappointment.
Your First Line of Defense: Choosing the Right Order Type
The most basic decision you'll make is what kind of order to send to the market. But don't mistake "basic" for "unimportant." This choice has huge consequences that change dramatically depending on the stock's liquidity.
In a highly liquid stock with a paper-thin spread and a deep order book, a market order is usually a safe bet. You’re telling your broker to buy or sell at whatever the best available price is right now. With tons of buyers and sellers, you can be confident your order will fill instantly at a price extremely close to what you see on your screen.
But try that same move in an illiquid stock, and you’re basically writing a blank check to the market. The bid-ask spread is a chasm, and the order book is sparse. Your market order can suffer from brutal slippage, getting filled at a far worse price than you ever expected as it eats through the few available shares.
For illiquid names, the limit order is your best friend. It’s your primary defense against overpaying or selling for too little. You set a specific price you’re willing to transact at (or better), putting a hard cap on your risk. The tradeoff? Your order might not get filled if the price moves away from your limit. But that’s a small price to pay to avoid a disastrous execution.
The Art of Slicing: How to Hide in Plain Sight
So what do you do when you need to trade a position that's a big chunk of the stock's average daily volume? Dumping a massive order on the market all at once is like setting off a flare in the dark. You’ve just announced your intentions to everyone, and you can bet they’ll start trading against you, pushing the price away from you. This is known as adverse price impact.
To fly under the radar, pros use a technique called order slicing.
Slicing is the simple but powerful practice of breaking one large order into many smaller ones and executing them over a period of time. It lets you participate in the market without drowning the available liquidity at any given moment.
Imagine you need to buy 50,000 shares of a stock that typically trades just 200,000 shares per day. Instead of one monster order, you could slice it into 50 separate orders of 1,000 shares each. You can then feed these smaller "iceberg" orders into the market throughout the day.
This approach gives you a few critical advantages:
- Reduced Market Impact: Smaller chunks are easily absorbed by the market's natural flow, creating minimal price ripples.
- Anonymity: You don’t signal your full hand, which keeps others from front-running your trade.
- Better Average Price: By spreading your execution across the day, you often achieve an average price closer to the true daily average.
Automated Execution with VWAP and TWAP Algorithms
Slicing orders by hand works, but it can be tedious and time-consuming. This is where algorithmic trading strategies step in, acting as your own personal automated trader to execute large positions as efficiently as possible. Two of the most common workhorses here are VWAP and TWAP.
1. Volume Weighted Average Price (VWAP): A VWAP algorithm is smart. Its goal is to get your order filled at or near the stock's volume-weighted average price for the day. It intelligently carves up your large order and executes the pieces in proportion to the actual trading volume as it unfolds. It will trade more aggressively when volume is high (like the market open and close) and back off during the quiet midday lulls.
2. Time Weighted Average Price (TWAP): A TWAP algorithm is simpler and more methodical. It breaks a large order into smaller, equal-sized pieces and executes them at regular intervals over a specific time period, no matter what the volume is doing. For instance, it might buy 1,000 shares every five minutes between 10 AM and 3 PM. This is great for stocks with less predictable volume patterns or when you just want to maintain a steady, consistent presence.
By mastering order types, slicing, and these automated algorithms, you can adapt your execution style to fit any stock's liquidity profile. You’ll turn a potential trading hazard into just another manageable part of your plan.
Finding and Analyzing Liquid Stocks with Modern Tools
Knowing the theory behind liquidity is one thing, but putting it into practice is where you actually make money. Moving from concepts to real-world trading means getting your hands on platforms that can scan, filter, and alert you to the market's ever-changing liquidity landscape in real-time.
Specialized software is designed to cut through the noise. Instead of manually checking stocks one by one, you can build a dashboard that constantly screens the market for your ideal liquidity profile. This means setting up dynamic toplists that automatically surface stocks with high average volume, tight bid-ask spreads, and deep order books.
This infographic breaks down a common workflow for executing trades with minimal price impact—a process that modern tools can easily automate.
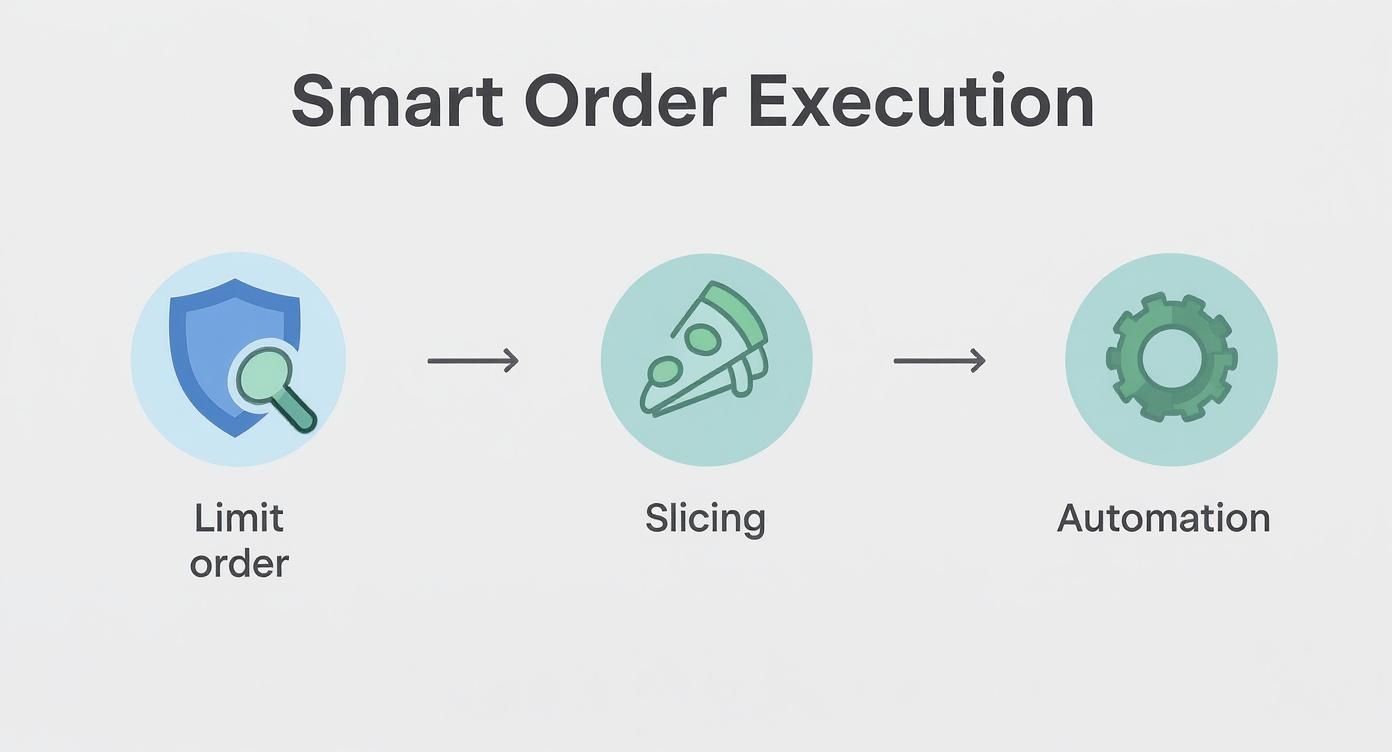
The process is simple: use limit orders for protection, slice large trades to avoid spooking the market, and automate the whole thing for maximum efficiency.
Setting Up Your Liquidity Dashboard
The real power of these tools lies in customization. You can create specific alerts to act as an early warning system. For example, setting an alert for a sudden drop in a stock’s average volume or an unusual widening of its spread can warn you that liquidity is drying up before you get trapped in a bad position.
This proactive approach flips the script, letting you react to problems before they cost you money. It’s all about building a system that brings the best, most liquid opportunities directly to you. In today's market, traders can also leverage AI tools for research to find and analyze these stocks more efficiently.
Another critical piece of the puzzle is learning to read Level 2 data, or the order book. Think of this as your visual guide to market depth. A healthy, liquid stock will have thick layers of buy and sell orders stacked up at various price levels, signaling that it can absorb large trades without the price getting knocked around.
Monitoring the order book is like looking beneath the ocean's surface. The current price is just what's visible, but the real strength and stability of a stock's liquidity lie in the massive, unseen depth below.
Tools like ChartsWatcher are built specifically for this kind of granular analysis. Below is an example of a configurable dashboard that pulls together charts, toplists, and alerts into one view.
This kind of setup allows a trader to watch multiple liquidity metrics across dozens of stocks at once, turning a flood of raw data into actionable insights. By applying simple filters for volume and spread, you can instantly isolate ideal trading candidates and steer clear of illiquid traps, connecting every concept we've discussed directly to your trading screen.
Of course. Here is the rewritten section, crafted to sound like it was written by an experienced human expert, following all your provided instructions and examples.
Let's Tackle Some Common Liquidity Questions
Once you get the hang of the basics, you start running into those tricky real-world questions that can trip up even seasoned traders. Let's clear up some of the most common points of confusion about stock liquidity.
Can a Great Company Have an Illiquid Stock?
You bet. It's a classic trap. A company can be posting record profits with a fortress-like balance sheet, but if only a tiny fraction of its shares are available for public trading (what we call a "low float"), or if it's simply off Wall Street's radar, its stock can be painfully illiquid.
This is a frustrating paradox for traders. You've found a fundamentally solid business, but the stock itself is a nightmare to trade. You'll see massive bid-ask spreads and barely any shares changing hands each day. For an active trader, that kind of stock is often more trouble than it's worth, no matter how good the underlying company is.
How Does a Stock's Liquidity Affect its Options?
This is a big one. For options traders, the liquidity of the underlying stock isn't just a minor detail—it's everything. Stocks that trade millions of shares a day, like the big tech names, usually have options markets to match. That means you get tight bid-ask spreads on the contracts, making it cheap and easy to get in and out of your positions.
On the flip side, trying to trade options on an illiquid stock is just asking for trouble. The contracts often have ridiculously wide spreads and zero trading volume. Not only does this make them expensive to trade, but it can literally trap you. Imagine having a winning position you can't sell because there are simply no buyers out there.
Think of it this way: the liquidity of the underlying stock is the foundation. A shaky foundation means an untradable options market. Never ignore it.
What's a "Liquidity Trap" in Trading?
In the trading world, a "liquidity trap" is that sinking feeling you get when you're stuck in a stock and can't get out without tanking the price yourself. The buyers have vanished. You're holding a position, and there's nobody on the other side of the trade to take it off your hands.
This usually happens when some unexpected bad news hits, or a panic erupts around that specific stock. Suddenly, you're holding a rapidly falling asset, and every attempt to sell just pushes the price down further. You're forced to either watch it crater or sell at progressively worse prices just to escape.
Are All ETFs Super Liquid?
Nope. This is a huge misconception that catches a lot of people off guard. Sure, the big ETFs that track major indexes like the S&P 500 are some of the most liquid instruments on the planet. But there are thousands of niche ETFs out there that can be shockingly illiquid.
An ETF's liquidity comes from two sources: its own trading volume and, just as importantly, the liquidity of the assets it holds inside. So, an ETF that invests in, say, thinly traded small-cap stocks from an emerging market can have the same wide spreads and low volume problems as any other illiquid stock. Always check before you trade.
Stop guessing and start mastering liquidity analysis. ChartsWatcher gives you the professional-grade scanning, alerts, and order-book tools needed to pinpoint the most liquid stocks and sidestep those costly traps. Make smarter, more informed trading decisions by visiting https://chartswatcher.com today.
