A Trader's Guide to Level 2 Data
Ever feel like you’re flying blind when you trade? Like you’re missing a huge piece of the puzzle? You're not alone. Most traders get their start using standard Level 1 data, which gives you the basics: the highest bid price, the lowest ask price, and the last price a trade went through. It's useful, but it's like looking at the tip of an iceberg. You can see what’s on the surface, but you have no clue what’s lurking underneath.
This is exactly where Level 2 data gives you a massive edge. It takes you below the surface to reveal the entire order book, offering a real-time, detailed look at the true supply and demand for a stock. It’s often called market depth, and if you want to dive deeper into the concept, our guide on what is market depth and how to read it is a great place to start.
Simply put, Level 1 data is the storefront price. Level 2 data takes you into the warehouse, showing you every single buy and sell order waiting in line to be filled, and at what price.
Unlocking Market Depth with Level 2 Data
So what does this "warehouse view" actually look like? Level 2 data splits the order book into two sides, giving you a clear picture of the market's intentions.
Seeing Beyond the Current Price
On one side, you have all the buyers, and on the other, all the sellers.
-
The Bid Side: This column is your window into demand. It lists all the pending buy orders lined up at different prices below the current market price. You can see not just the best bid, but all the bids behind it.
-
The Ask Side: This column represents supply. It shows every pending sell order stacked up at various prices above the current market price.
Instead of seeing just one price on each side, you get a full ladder of orders. This lets you spot where big clusters of buying or selling interest are building up. Understanding the gap between the best bid and ask is also fundamental, which you can learn more about in this great piece on What Is Bid-Ask Spread in Trading?.
By analyzing the size and price levels of these orders, traders can gauge potential support and resistance zones long before they show up on a standard price chart. It’s the difference between reacting to what the market did and anticipating what it’s about to do.
To help visualize the difference, here’s a quick breakdown:
Level 1 vs Level 2 Data at a Glance
This table offers a simple comparison, showing how much more information you get by moving from the standard view to a market depth view.
| Feature | Level 1 Data (Standard) | Level 2 Data (Market Depth) |
|---|---|---|
| Bid Price | Shows only the single highest bid price. | Shows a ranked list of all bid prices. |
| Ask Price | Shows only the single lowest ask price. | Shows a ranked list of all ask prices. |
| Order Sizes | Shows the volume available at the best bid/ask. | Shows volume for all bids and asks at every price level. |
| Market Makers | No information on who is buying or selling. | Identifies the specific market makers behind the bids/asks. |
| Market Insight | Basic, surface-level view of the current price. | Deep, transparent view of supply and demand dynamics. |
As you can see, the jump from Level 1 to Level 2 is like going from a black-and-white photo to a high-definition video.
The Impact on Market Efficiency
This transparency doesn't just help individual traders; it makes the entire market healthier. With more visibility into supply and demand, liquidity often improves and spreads tend to tighten.
It's not just theory. A 2019 study by the London Stock Exchange Group found that stocks with accessible Level 2 data saw their average daily trading volume jump by 22%. Even better, the research noted that the bid-ask spread for these stocks narrowed by an average of 15%, signaling a more competitive and efficient market for everyone involved.
This peek into the underlying order flow is what separates amateurs from professionals. It’s how they turn raw numbers into smart, actionable intelligence.
Decoding the Order Book Like a Pro
Looking at Level 2 data for the first time is like staring at a foreign language—a dizzying wall of constantly shifting numbers and codes. But once you get the hang of it, that screen transforms into a clear story about market sentiment, giving you a real-time map of the trading battlefield.
The order book is split into two sides. The ‘bid’ side shows the visible demand from buyers, while the ‘ask’ side shows the available supply from sellers. Think of it as an auction where everyone has to show their cards.
The Key Players: Market Makers
Behind most of these orders are market makers, large financial institutions or trading firms whose job is to keep the market flowing by providing liquidity. They’re required to post both buy (bid) and sell (ask) prices at the same time for a security, making sure there's always someone to trade with.
You can spot these players by their unique four-letter market participant identifiers (MPIDs) listed next to each order. You’ll frequently see codes like:
- ARCA (Archipelago/NYSE)
- NSDQ (Nasdaq)
- EDGX (Cboe EDGX Exchange)
- BATS (BATS Global Markets)
Knowing which market maker is behind a huge order gives you critical context. Certain firms are known for specific trading styles, and learning to recognize their patterns can give you a serious edge in reading the order flow.
Identifying Support Walls and Resistance Ceilings
The real magic of Level 2 data is seeing the collective weight of all these orders. When you spot a massive number of buy orders stacked up at a specific price, often from a single market maker, you've found what traders call a "support wall."
This is where the difference between Level 1 (just the best bid and ask) and Level 2 (the full depth) becomes crystal clear.
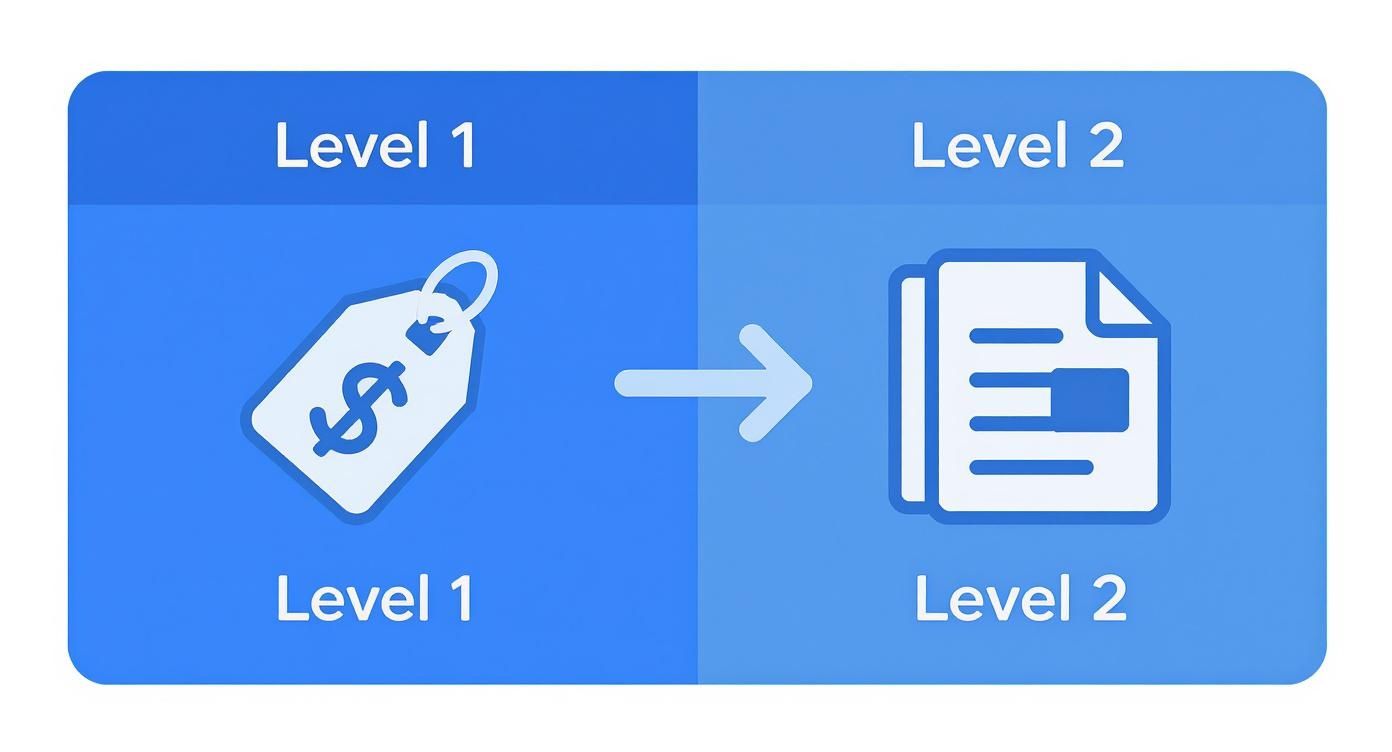
This graphic perfectly illustrates how Level 2 adds a crucial dimension, showing you the entire queue of orders that Level 1 completely hides.
This wall of bids acts like a floor. It suggests the price is unlikely to drop below that level because of the immense buying pressure waiting to soak up any sell-offs.
On the flip side, a large cluster of sell orders piled up at a price above the current market creates a "resistance ceiling." This is a heavy wall of supply that the price will struggle to break through. For scalpers and day traders, these walls and ceilings are high-probability zones to plan trades around.
Algorithmic Trading and the Need for Speed
The speed at which you get this data is everything. That's why Level 2 has become an indispensable tool for algorithmic and quantitative traders. According to a 2021 report, over 70% of institutional trading desks in the U.S. and Europe now use Level 2 feeds to power their execution algorithms.
The same report found that the average latency for data delivery from major exchanges is between 5 and 100 milliseconds—a tiny window that can make or break high-frequency strategies.
For a peek into how this works in decentralized markets, where liquidity pool depth acts much like an order book, check out resources like Dexscreener, a guide to DeFi trading. Learning to decode this information quickly helps you start thinking like the market's biggest players.
Putting Level 2 Data to Work: Practical Trading Strategies
Knowing what the numbers in a Level 2 window mean is one thing. Actually using them to make money is a whole different ball game. This is where the rubber meets the road—translating the order book's raw data into real, actionable trading signals.
These strategies aren't about predicting the future with 100% certainty. Instead, it’s all about spotting high-probability setups where the visible supply and demand are clearly tilted in your favor. Let's get into a few of the most effective methods that pro traders use every single day.
Strategy 1: Trading the Walls
One of the most straightforward ways to use Level 2 is by "trading the walls." As we've touched on, these walls are massive stacks of buy or sell orders parked at a single price, creating obvious support and resistance levels right there in the order book.
A huge bid wall acts like a support floor, showing intense buying interest that can stop a stock's price from falling further. On the flip side, a massive ask wall is a resistance ceiling, signaling a heavy supply of shares that can halt a rally dead in its tracks. Scalpers and other short-term traders absolutely love hunting for these formations.
How to Pull It Off
- Spot the Wall: Your first job is to scan the Level 2 window for a price level with a crazy-high number of shares on either the bid or ask side. It should stick out like a sore thumb compared to the orders around it.
- Plan Your Entry: If you see a support wall, you might place a buy order just a penny or two above that wall's price. The beauty here is that your risk is crystal clear—if that wall starts to break, you know your idea was wrong and can get out fast.
- Set Your Exits: Your profit target could be the next visible area of resistance, like a smaller ask wall or a key technical level on the chart. Your stop-loss goes just below the bid wall you're trading against.
This approach can offer a fantastic risk-to-reward ratio. Why? Because your potential downside (the distance to your stop-loss) is tiny compared to your potential upside.
Strategy 2: Mastering Order Flow Analysis
While Level 2 shows you what traders intend to do, the Time & Sales window (often called "the tape") shows you what they're actually doing. The tape is a live, running log of every single trade that executes, showing the price, time, and number of shares. The real magic happens when you combine these two data streams. This is the heart of order flow analysis.
This technique is all about validation. For instance, you might see a giant bid wall on Level 2, but if the tape is lighting up with a relentless flood of big red (sell) prints at that price, it means sellers are aggressively eating through that wall. It might not hold for long.
A classic trick is "spoofing," where a trader places a huge order they have no intention of filling, just to manipulate the price. Watching the tape helps you sniff this out. If a giant bid disappears the second the price gets near it—without any corresponding trades on the tape—it was almost certainly a spoof.
By watching both, you can answer the single most important question for a day trader: Are buyers or sellers more aggressive right now? If you see asks getting smacked and large green prints flying by on the tape, that's your confirmation of bullish momentum.
Strategy 3: Reading the Spread for Liquidity
The bid-ask spread is simply the gap between the highest price a buyer will pay (bid) and the lowest price a seller will take (ask). Level 2 gives you a high-definition picture of this spread and the order depth behind it, which is your best real-time indicator of a stock's liquidity.
-
Tight Spreads: A tiny gap between the bid and ask, backed by large order sizes on both sides, signals high liquidity. This is great news. It means you can jump in and out of positions easily with minimal slippage—the costly difference between the price you clicked and the price you actually got.
-
Wide Spreads: A huge canyon between the bid and ask, especially with tiny order sizes, screams low liquidity. Trading these stocks is like walking on a tightrope. A single market order can send the price soaring or plummeting, leading to disastrous fills.
Before you ever place a trade, a quick glance at the Level 2 spread tells you if the stock is even worth your time. Scalpers, for example, almost exclusively trade stocks with super tight spreads to keep their transaction costs down. It’s a simple, two-second check that can save you from a world of financial pain.
How to Choose the Right Level 2 Data Provider
For any serious short-term trader, getting your hands on high-quality Level 2 data is non-negotiable. But stepping into the world of data providers can feel like navigating a minefield. The right feed sharpens your edge; the wrong one leads to costly mistakes. It all boils down to finding the right balance between three things: cost, speed, and market coverage.
The first big choice is whether to stick with the data feed your broker offers or subscribe to a dedicated third-party provider. Platforms like thinkorswim or Interactive Brokers often bundle Level 2 access, which is certainly convenient. But professional third-party feeds are built for one thing and one thing only: delivering the fastest, most complete data possible.
Evaluating Data Speed and Latency
For a day trader or scalper, speed isn’t just a feature—it’s everything. Latency, the tiny delay between a market event happening and the data popping up on your screen, can be the difference between a profitable scalp and a losing trade. A lag of even a few hundred milliseconds means you're looking at an old, outdated picture of the order book.
When you're shopping around, look for terms like "direct feed" or "low latency." These services often have their gear physically located right next to the exchange servers to slash delays. A beginner might not notice the difference, but a high-frequency trader absolutely will.
The goal is to see what’s happening as close to real-time as you can get. In a market where prices change in the blink of an eye, any lag puts you at a huge disadvantage against the algorithms and pros who are paying top dollar for premium speed.
Assessing Market and Exchange Coverage
Heads up: not all Level 2 data feeds are created equal. A cheaper service might only show you the order book from a single exchange, like the NASDAQ. This gives you a dangerously incomplete picture of the real supply and demand for a stock. It's like trying to judge traffic by only looking at one street.
A complete market view requires data from all the major exchanges and Electronic Communication Networks (ECNs) where a stock is trading. You need to see the full depth of the order book, including all the bids and asks from market makers on ARCA, BATS, EDGX, and the rest.
Make sure any provider you're considering offers what’s known as TotalView or a similar full-book feed. This comprehensive data is what you need to accurately spot support and resistance walls and truly understand a stock's liquidity landscape. Trading without it means you're flying with massive blind spots.
Comparing Costs and Value
Finally, you have to weigh the cost against the value you're getting. Those "free" data feeds from your brokerage? The cost is often just baked into your commissions or other account fees. Dedicated data providers usually charge a monthly subscription, which can run anywhere from under a hundred to several hundred dollars.
Ask yourself these key questions:
- Does this provider give me the full market depth I need? (Look for TotalView or equivalent).
- Is the latency low enough for my style of trading? (This is critical for scalping).
- What’s the total monthly bill, including any separate exchange fees?
Think of investing in a premium Level 2 data feed as an investment in your trading business. Skimping on this critical tool just to save a few bucks a month can end up costing you a whole lot more in missed opportunities and bad trades.
Combining Level 2 Data With Trading Scanners
On their own, trading scanners and Level 2 data are incredibly useful. But when you fuse them into a single, seamless workflow, you’re operating on a different level. This is how pros build a system for not just finding high-probability setups, but truly understanding the story behind a stock’s movement.
Think of your scanner as the discovery engine. It’s your bloodhound, sniffing through thousands of stocks in real-time to flag the few that meet your exact criteria—maybe it's a massive volume spike, a clean breakout, or a stock hitting new daily highs. An alert is great, but it’s just the start. It tells you what is moving, but it doesn't tell you why.
The Scanner to Level 2 Workflow
This is where you bring in Level 2 data as your validation tool. It’s a simple, but brutally effective, two-step process that helps you filter out the market noise and sidestep those frustrating false signals.
- Configure Your Scan: First, you dial in your scanner to hunt for specific opportunities. For example, you might build a scan for stocks punching through a key resistance level on 3x their average volume.
- Validate with Level 2: The instant your scanner dings with an alert, you don't just blindly jump in. You immediately pull up that stock’s Level 2 quote to get a raw look at the order book.
This workflow transforms a generic alert into a piece of actionable intelligence. You stop chasing blinking lights and start confirming the real supply and demand dynamics that are actually driving the price.
Reading the Story Behind the Alert
By cross-referencing a scanner alert with the order book, you can answer critical questions that a simple price chart could never tell you. This split-second analysis is what separates a move with real conviction from a fleeting head fake.
Let's walk through a couple of real-world scenarios:
- The Breakout Alert: Your scanner flags a stock breaking through a long-term resistance level. A quick glance at the Level 2 data reveals that the ask side is incredibly thin—there are hardly any sellers left. That’s a powerful confirmation that the path of least resistance is higher.
- The Dip-Buying Alert: A stock on your watchlist pulls back to a major support level. You check its Level 2 and see a massive wall of bids stacked right at that price. This tells you that big buyers are stepping in to defend that level, making it a much higher-probability entry.
This screenshot from ChartsWatcher gives you an idea of how a trader might set up their screen, with a scanner feeding them ideas on one side and the detailed chart and order book ready for inspection on the other.
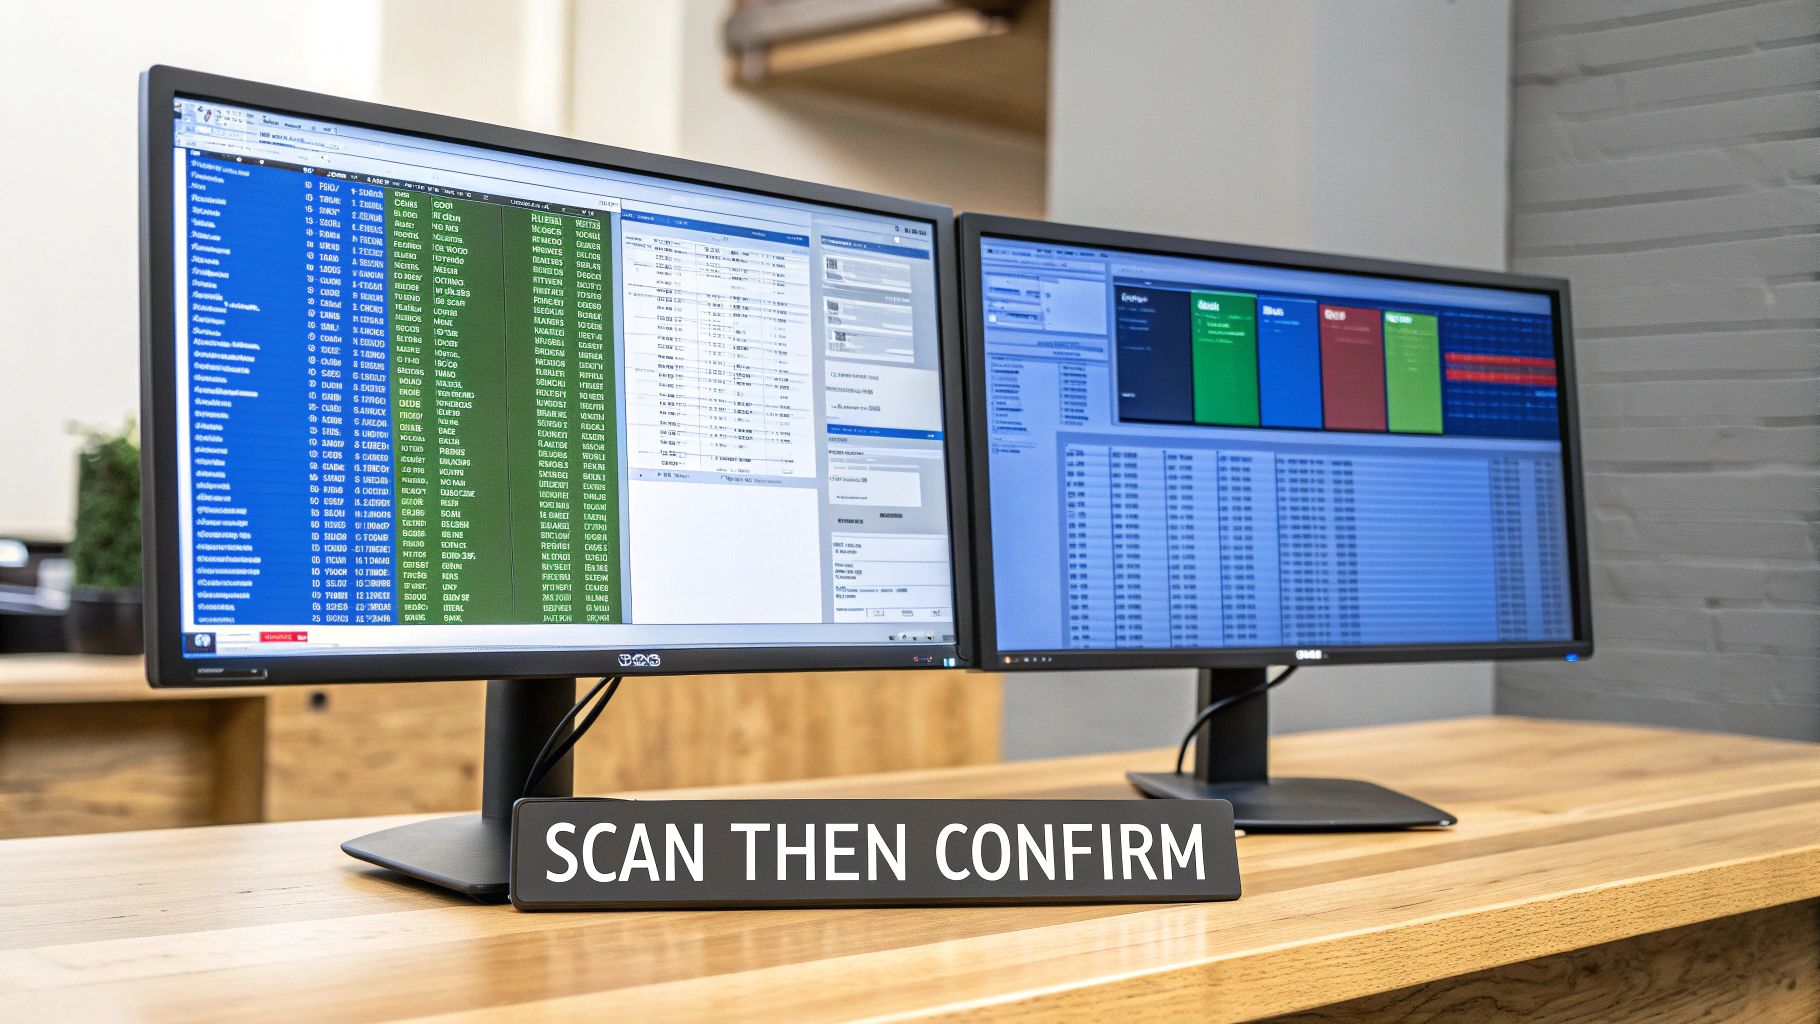
This kind of setup allows you to execute that scan-then-validate workflow instantly, turning raw alerts into confirmed trading opportunities.
By demanding this second layer of confirmation from the Level 2 data, you dramatically increase the precision of your trades. It’s the difference between guessing that a move is real and seeing the proof in the order book.
Integrating these two tools is a fundamental skill for anyone serious about day trading. To really master the first step in this process, check out a trader’s guide to real-time stock scanning, which dives deep into setting up effective scans. Ultimately, using scanners for discovery and Level 2 for confirmation helps you trade with more discipline and a whole lot more confidence.
Common Questions About Level 2 Data
When you start peeling back the layers of the market with a tool like Level 2, questions are bound to pop up. It's a firehose of information, and it's totally normal for new concepts to feel a bit tricky at first.
Let's tackle some of the most frequent questions traders have. Think of this as a quick way to clear up any confusion and get you more comfortable using market depth in your day-to-day trading.
Can Level 2 Data Predict Exact Price Movements?
No, and this is a critical point to understand. Level 2 data is a tool for reading probabilities, not a crystal ball. It gives you a real-time snapshot of the supply and demand landscape, which offers powerful clues about potential short-term direction and where the big battles might be fought.
For example, a massive wall of buy orders at a certain price suggests strong support, but it's never a guarantee. If a huge, motivated seller comes in with enough shares to sell, they can chew right through that wall. Always use Level 2 as one piece of the puzzle, alongside your charts, volume analysis, and overall strategy.
Think of Level 2 as a weather forecast for the market. It shows you the current conditions and tells you there's an 80% chance of rain, but it can't promise you a downpour at exactly 2:15 PM. It gives you an edge, not a certainty.
What Is Spoofing and How Can I Spot It?
Spoofing is a flat-out illegal and manipulative tactic. It's when a trader places a large order with zero intention of ever letting it get filled. Their only goal is to create a fake sense of supply or demand to trick other traders into making a move.
The best way to spot it is by watching your Level 2 screen and the Time & Sales window together. You might see a monster bid suddenly appear, making it look like there's huge buying interest. But the second the price gets near it, poof—it vanishes. If you check the tape, you'll see very few, if any, shares actually traded at that price. That was the spoofer, trying to bait people before pulling their order.
Is Level 2 Data Useful for Long-Term Investors?
For the most part, no. The real power of Level 2 data is in its microscopic, real-time view of the market. This makes it incredibly valuable for short-term traders—like scalpers and day traders—who are trying to profit from tiny, moment-to-moment shifts in supply and demand.
If you're a long-term investor holding stocks for months or years, these second-by-second flickers are just noise. Your decisions are based on the big picture: a company's fundamental health, its earnings, industry trends, and the wider economy. The momentary imbalances in the order book just don't factor in.
Do I Need Level 2 Data to Be a Successful Trader?
That really depends on your style. It's absolutely not a requirement for every profitable trader, but for some strategies, it's pretty much essential.
- For scalpers and momentum day traders: Yes, Level 2 is almost a non-negotiable tool. It provides the granular detail needed to make split-second entry and exit decisions based on the flow of orders.
- For swing traders or trend followers: Many successful traders in this camp never look at a Level 2 screen. They're focused on price action and technical indicators on much longer timeframes, like daily or weekly charts.
Ultimately, Level 2 data is a specialized instrument. Success comes from mastering the right tools for your strategy, not from trying to use every tool out there.
Ready to stop reacting to the market and start anticipating its next move? ChartsWatcher provides the powerful, real-time scanning tools you need to find opportunities, which you can then validate with Level 2 data for a complete trading workflow. Get the edge you need by visiting https://chartswatcher.com today.
