A Trader's Guide to Higher Lows and Lower Highs
Before you get tangled up in complex indicators or fancy strategies, you first have to learn the language of the market. Price action itself tells a story, and the most fundamental plot points are higher lows and lower highs. They are the absolute DNA of any trend.
Understanding the DNA of Market Trends

Think of an uptrend as climbing a mountain. Every time you push upward, you reach a new peak—that’s a higher high. Then, you pause to catch your breath and find a solid foothold. Crucially, that foothold is at a higher elevation than your last one. That’s your higher low.
This simple structure tells you everything. It shows that even when sellers manage to push the price down for a bit, buyers jump back in with even more conviction, refusing to let the price fall back to its previous starting point. They are defending higher and higher ground.
A downtrend is the exact opposite, like descending into a valley. Each slip downward creates a new bottom (lower low). When you try to scramble back up, you just can’t reach the height you were at before. That failed attempt is a lower high, and it’s a clear signal that sellers are in control, overwhelming any buying pressure at progressively lower price points.
The Psychology Behind the Patterns
These patterns aren’t just squiggles on a chart. They are the footprints of collective trader psychology, revealing the real-time battle between bulls and bears.
- Higher Lows (HL): This is a picture of rising confidence. Buyers are so eager to get in that they are willing to pay more during every little dip. It’s pure optimism and a sign that demand is strong.
- Lower Highs (LH): This shows fading enthusiasm. Buyers just don't have the muscle to push the price past its previous peak, revealing serious hesitation. It suggests sellers are getting more aggressive and the rally is running out of steam.
By learning to spot these simple structures, you stop just looking at a chart and start reading it. You can see the story of market direction and strength instead of just random noise.
To give you a quick reference, here’s a breakdown of what these simple patterns are telling you about the market's mood.
Quick Guide to Trend Indicators
| Pattern | Market Indication | Trader Psychology | Next Likely Move |
|---|---|---|---|
| Higher Lows | Bullish Uptrend | Buyers are confident and buying the dips. | Price will likely attempt another higher high. |
| Lower Highs | Bearish Downtrend | Sellers are in control and selling rallies. | Price will likely attempt another lower low. |
Understanding these dynamics is your foundation for interpreting more complex market behavior.
Why This Foundation Matters
Once you can instinctively identify these patterns, you gain an immediate edge. You can filter out the distracting noise and focus on the one thing that truly matters: the underlying trend.
This skill is the bedrock of nearly every successful technical trading strategy out there. Whether you’re a simple trend-follower or hunting for complex reversals, it all starts here. For a deeper dive, you can check out our post on how to identify market trends in our complete guide. It’s about learning to hear the market’s rhythm before you ever place a trade.
How to Spot an Uptrend with Higher Lows

While flashy new highs grab all the headlines, the real workhorse of a strong uptrend is the humble higher low. Think of it as the market catching its breath before the next push higher. Each time the price pulls back but finds its footing above the previous dip, it’s a massive clue about who’s in control.
This pattern isn’t just a random squiggle on a chart; it’s a footprint left by confident buyers. It shows that even when sellers manage to push prices down, buyers are jumping back in earlier and with more conviction. They aren't waiting for the old support levels. This rising floor of demand is what gives an uptrend its staying power.
The Anatomy of a Healthy Uptrend
Seeing a chart go up isn't enough. A real, sustainable uptrend has a specific rhythm—a repeating structure that confirms the bulls are firmly in charge. The classic definition of an uptrend is a series of both higher highs and higher lows.
Let's break down what you're looking for on the chart:
- Initial Low (L1): This is the bottom, the trough where the upward journey begins.
- First Higher High (H1): From L1, the price rallies to a new peak, showing the first sign of buying pressure.
- First Higher Low (L2): Here’s the key moment. The price pulls back from H1 but stops and turns around above L1. This is your confirmation that buyers successfully defended a higher price level.
- Second Higher High (H2): Fueled by the successful defense at L2, the price rallies again, this time breaking past the old peak (H1). This seals the deal, completing the first full cycle of a confirmed uptrend.
This H1 > L2 > H2 structure, where L2 > L1, is the foundational blueprint of a bullish market. Each new higher low acts as another step on the staircase, reinforcing the trend's strength.
A higher low is the market’s vote of confidence. It signifies that dip-buyers are more aggressive than sellers, creating a rising tide of support that lifts the asset price.
Practical Steps for Identifying Higher Lows
Training your eye to spot these pivots is a core trading skill. It's about looking past the day-to-day static and focusing on the significant turning points, often called swing lows. The simplest way to see the trend is to connect these swing lows with a line.
It's also worth noting that higher lows without higher highs can signal trouble. This pattern often marks a frustrating sideways market that chews up traders. For a classic example, look at the Dow during the 1966-1982 secular bear market. It repeatedly formed higher lows between 600-800 points but failed to break the 1966 high of roughly 1,000 until 1983. That was a 17-year stretch of frustration for anyone waiting for new highs. You can see this play out on Guggenheim Investments' interactive chart.
Mastering this concept goes hand-in-hand with other essential charting skills. If you want to get better at visualizing these trends, check out our guide on how to draw trend lines effectively. After all, a solid uptrend line is just a visual representation of the higher lows we're talking about here.
Reading the Warning Signs in Lower Highs
Just as higher lows signal a healthy, climbing market, the appearance of lower highs is the first whisper of trouble ahead. Think of it like a mountain climber who can't quite reach their last peak—it's a clear sign that upward momentum is fading. This pattern is a critical warning for traders that buying pressure is drying up, and sellers are quietly starting to take control.
Each lower high tells a story of exhaustion. It represents a rally that simply ran out of steam, a failed attempt by buyers to push prices past the previous summit. When you see this happen, it means sellers are getting more aggressive at lower and lower price points, building a ceiling the market can no longer punch through.
At first, this shift in power can be subtle. The uptrend might still look okay on the surface, but the failure to forge a new higher high is the first crack in the foundation. It’s your cue to start paying very close attention, as this could be the beginning of a distribution phase before a real downtrend kicks in.
The Psychology Behind Fading Momentum
When lower highs start printing on a chart, it reveals a huge psychological shift in the market. The blind optimism that had traders buying at any price has been replaced by hesitation and doubt.
- Fading Enthusiasm: Buyers who were once confident are now getting cautious. They’re no longer convinced the asset is worth more than its last peak.
- Growing Seller Confidence: On the flip side, sellers see this hesitation as their green light. They start unloading positions at prices lower than the last high, confident that there isn't enough buying power left to absorb their shares.
- Confirmation with Volume: The real nail in the coffin is seeing declining volume on the rally that forms the lower high. If the price tries to move up but does so on weak volume, it’s a massive red flag. There's just no real conviction behind the move.
A lower high is a clear signal that the balance of power is shifting. It’s the market telling you that the path of least resistance may soon be downward.
This pattern is a classic precursor to major trend reversals. For a brutal real-world example, look no further than the Nasdaq Composite during the dot-com bust. After peaking at 5,048 in March 2000, the index formed a series of devastating lower highs, first at 4,200 and then at 3,300. These were glaring warnings of intense distribution, even as some dip-buyers were lured in by the temporary bounces. Ultimately, this structure preceded a staggering 78% collapse. Analysis from that time showed that rallies on contracting volume of 30-50% were a giveaway that sellers had taken over. You can find more insights on how volume confirms price action on LiteFinance.
Translating Lower Highs into Actionable Trades
Spotting lower highs isn't just a chart-gazing exercise; it gives you clear, actionable signals to manage risk and even capitalize on a potential downturn. It helps you move from being reactive to proactive.
If you're already in a long position, a lower high is your signal to start protecting profits. That could mean one of two things:
- Tightening a Stop-Loss: Move your stop-loss up to just below the most recent higher low. This locks in gains and protects your downside if things turn south.
- Exiting the Position: Take your profits off the table completely. The uptrend's strength is now in question, so it might be time to get out while the getting is good.
For traders looking to go short, the formation of a lower high offers a beautiful, strategic entry point. The plan is simple: wait for the lower high to be confirmed, then enter a short trade. Place your stop-loss just above that new, lower peak. This defines your risk clearly from the get-go and positions you perfectly to profit if the downtrend plays out. This structure of higher lows and lower highs is the language of the market, and learning to interpret these warnings is essential for survival.
Putting Pattern Recognition into Practice
Spotting higher lows and lower highs on a chart is one thing. Actually turning that skill into a profitable, repeatable trading strategy? That's a completely different ballgame. This is where the rubber meets the road—transforming your analysis into a concrete plan for entering trades, managing your risk, and knowing when to take your profits.
Without a solid playbook, even the sharpest chart analysis can fall apart, leading to missed opportunities or, worse, impulsive decisions. The goal here is to build a set of simple, non-negotiable rules that dictate your actions. This way, every trade becomes a calculated move based on the market structure you see, not a gut feeling.
Crafting a Long Trade Strategy in an Uptrend
When a stock is consistently carving out a series of higher lows, it’s a clear signal that buyers are in control and stepping in at progressively higher prices. Your job is to find a smart, low-risk entry point to ride that bullish wave. Patience is everything; you have to wait for the market to give you the green light rather than jumping the gun.
Here's a straightforward game plan for executing a long trade:
- Identify the Structure: First things first, confirm a clear uptrend is in play. Look for at least two consecutive higher lows and higher highs. This sets the stage and confirms the bullish context.
- Wait for the Pullback: A healthy uptrend rarely moves in a straight line up. It breathes. Wait for the price to pull back and form what looks like it could be the next higher low.
- Pinpoint Your Entry Trigger: This is critical. Don't buy while the price is still dropping. The real entry trigger happens only after the price finds support and starts to turn back up, confirming the higher low. A classic trigger is the price breaking above the high of the previous small reversal candle.
- Set Your Stop-Loss: Think of this as your eject button. Place your stop-loss order just below the new higher low you just identified. If the price breaks that level, the uptrend structure is broken, and your trade idea is officially invalidated. This defines your exact risk from the get-go.
- Define Your Profit Target: Your initial target should give you a good risk-to-reward ratio, ideally 2:1 or better. For instance, if your stop-loss is $1 below your entry, your first target should be at least $2 above it. A logical place to look is just below the previous higher high.
The best entries in an uptrend are rarely at the absolute bottom of a dip. They're found in that moment of confirmation, right as the price proves the buyers are still in charge and ready to make the next push.
Executing a Short Trade in a Downtrend
The logic for a short trade is simply the mirror opposite of a long one. Here, the goal is to capitalize on the selling pressure signaled by a series of lower highs. Once again, discipline and confirmation are your best friends.
The chart below breaks down how an uptrend can lose steam and roll over into a downtrend. That first lower high is the crucial warning shot.
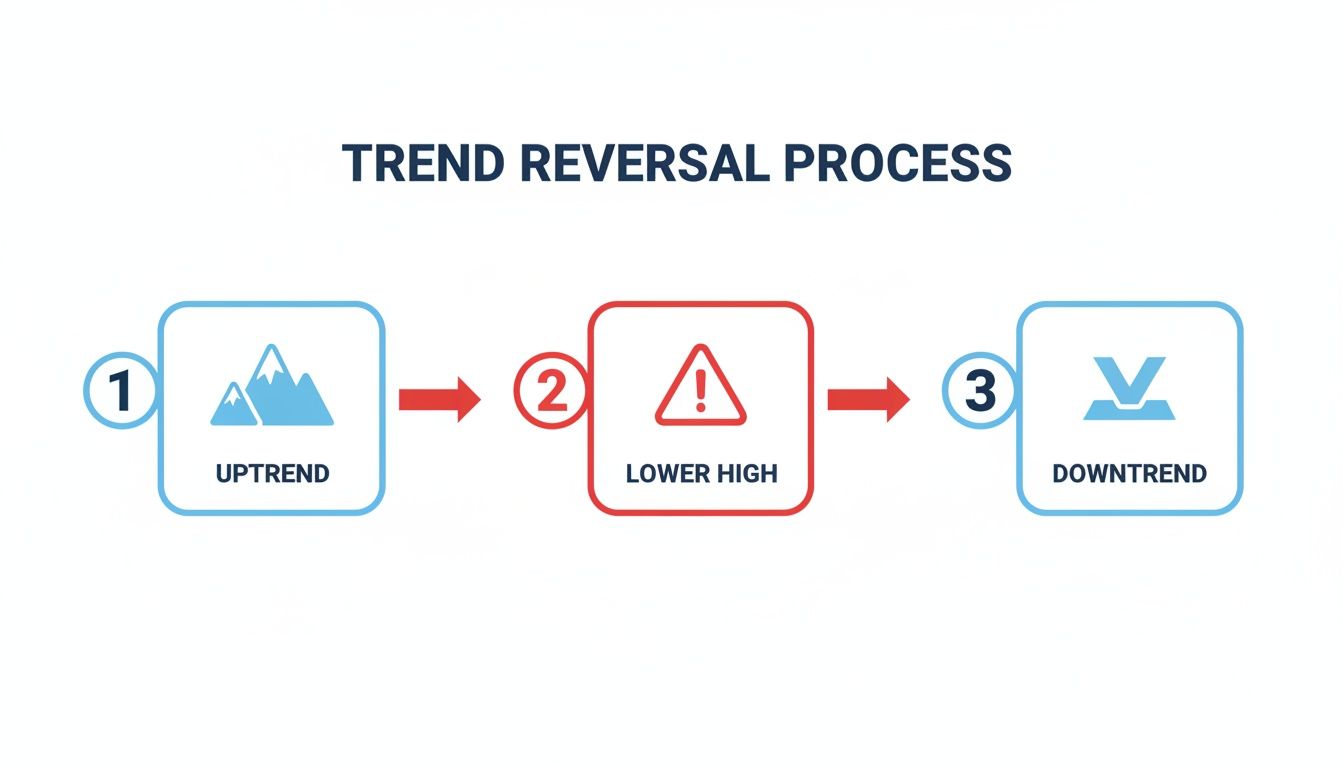
This visual drives home the point: the failure to make a new high is the pivot point where control can shift from buyers to sellers.
To short a stock based on this structure, follow these steps:
- Confirm the Downtrend: Find a clear pattern of lower highs and lower lows. This tells you the bears are in control.
- Anticipate the Rally: Wait for a counter-trend bounce where the price moves up, trying to challenge the previous high. This is where you expect a new lower high to form.
- Wait for the Entry Signal: Your trigger comes when the rally fizzles out and the price begins to roll over. Go short once the price breaks below the low of a recent reversal candle, confirming that sellers have successfully defended that area.
- Place Your Stop-Loss: Set your stop-loss just above the peak of the newly formed lower high. If the price breaks this level, the downtrend is in jeopardy, and it's time to get out and limit the damage.
- Set Your Profit Target: Shoot for a risk-to-reward ratio of at least 2:1. A logical first target for a short trade is the area just above the previous lower low.
Trading Strategy Blueprints
To make this crystal clear, here’s a side-by-side comparison of the long and short strategies. Think of these as your go-to blueprints for trading with the trend.
| Strategy Component | Long Trade (Uptrend) | Short Trade (Downtrend) |
|---|---|---|
| Market Condition | Confirmed series of higher lows and higher highs | Confirmed series of lower highs and lower lows |
| Ideal Entry Point | On the bounce after a pullback confirms a new higher low | On the rollover after a rally confirms a new lower high |
| Entry Trigger | Price breaks above a small reversal candle's high | Price breaks below a small reversal candle's low |
| Stop-Loss Placement | Just below the newly formed higher low | Just above the newly formed lower high |
| Initial Profit Target | Just below the previous higher high (aim for >2:1 R/R) | Just above the previous lower low (aim for >2:1 R/R) |
| Core Goal | Capitalize on buying pressure and upward momentum | Capitalize on selling pressure and downward momentum |
By converting the simple concept of higher lows and lower highs into a strict set of rules, you move from just watching the market to actively engaging with it in a disciplined, strategic way.
Finding Trading Setups with ChartsWatcher
Let's be honest, nobody has time to manually flip through hundreds of charts looking for that perfect higher low or lower high setup. It’s a surefire way to burn out, get screen fatigue, and miss the exact opportunities you’re hunting for.
This is where technology gives you a massive edge. Instead of doing all the grunt work yourself, you can automate the entire discovery process. It’s about trading smarter, not harder, by letting a powerful platform do the heavy lifting.
Automating Your Search for Trends
The real trick is to translate the visual patterns we’ve been talking about—the stair-stepping price action—into a set of rules a computer can follow. With a dedicated scanner like ChartsWatcher, you can build custom filters that pinpoint stocks forming the exact trend structures you want to trade, right as it happens.
This completely changes the game. You stop being a passive observer, hoping to stumble upon a good setup, and become an active hunter with a system that brings the best opportunities directly to you.
Imagine scanning the entire market in seconds for stocks that are:
- Primed for a Bullish Move: Just bounced off a new higher low and are starting to turn back up.
- Showing Bearish Weakness: Just printed a lower high and are beginning to roll over.
That’s the kind of automation that frees up your time and mental capital, so you can focus on analyzing the best setups instead of finding them.
Think of a custom scan as your personal trading assistant, working 24/7. It filters out all the market noise and only taps you on the shoulder when a stock’s price action demands your attention.
Building Your Custom Scanner in ChartsWatcher
A good scan is more than just one rule. You need to layer several conditions together to weed out the mediocre setups and isolate the A+ candidates. You don’t just want any stock forming a higher low; you want one with signs of real strength and momentum behind it. The key is combining raw price action with other technical indicators for confirmation.
Here’s a quick guide to setting up a basic scan for bullish higher low setups:
- Define the Core Price Action: Start with the pattern itself. Set up a filter that looks for a stock whose most recent low is clearly higher than its previous major swing low.
- Add a Trend Filter: You only want stocks that are already in a healthy uptrend. An easy way to do this is to add a moving average filter—for example, requiring the price to be trading above its 50-day moving average.
- Throw in a Volume Condition: Big moves are backed by big money. Add a filter to ensure volume is above its 20-day average. This helps confirm institutional interest and tells you the move has conviction.
- Set Price and Liquidity Rules: To avoid penny stocks and illiquid names you can’t easily trade, set minimums for price and average daily volume. This keeps your focus on quality stocks.
Once you’ve built your scan, it will constantly work in the background, generating a dynamic list of stocks that fit your exact trading plan.
The screenshot below gives you a sense of what a ChartsWatcher dashboard can look like. You can monitor multiple custom scanners and watchlists at the same time, keeping a pulse on specific patterns across the market.
This kind of setup allows you to see how patterns like higher lows and lower highs are playing out across different sectors in real-time.
Creating Real-Time Alerts for Immediate Action
A scanner is great for building a watchlist, but real-time alerts are what trigger your trades. In ChartsWatcher, you can turn any scan you create into an active alert. The moment a new stock meets your criteria, you get a notification. No more being glued to your screen all day.
You can get these notifications sent via email, desktop pop-ups, or to your phone. When a high-probability setup based on a higher low or lower high finally materializes, you'll be the first to know. This speed is a huge advantage, letting you pull up the chart, do your final analysis, and execute the trade without missing the move.
Common Questions About Trend Trading
Even after you get the hang of trend dynamics, questions always pop up when you're staring at a live chart. Let's tackle some of the most common ones traders have about using higher lows and lower highs. Getting these right will sharpen your edge and really hammer home the core ideas of trading with the trend.
How Many Swings Does It Take to Confirm a Trend?
This is a classic. How many pivots do you need before you can confidently say, "Alright, we're in a trend"? While two points technically make a line, relying on just two swings in the market is asking for trouble.
Most seasoned traders want to see more proof. A good rule of thumb is to wait for at least three confirmed swing points. For an uptrend, that means you'd spot an initial low, a higher high, and then a second confirmed higher low. That third point is your validation—it tells you the move has real momentum and isn't just random noise or a market 'head fake'.
Being patient like this filters out a ton of bad signals. It ensures you're trading a pattern with proven strength, not jumping on some potential trend that dies before it even gets going.
Can I Use These Patterns on Any Timeframe?
Absolutely. The beauty of price action—like higher lows in an uptrend or lower highs in a downtrend—is that it's fractal. That's just a fancy way of saying these patterns work the same and are driven by the same human psychology, no matter what chart you're looking at.
- Day Traders: On a 5-minute chart, a series of higher lows signals a strong intraday move, perfect for a quick scalp or momentum trade.
- Swing Traders: On a daily chart, the same pattern can map out a trend lasting days or weeks, setting up a solid multi-day position.
- Long-Term Investors: On a weekly or monthly chart, higher lows can confirm a powerful bull market that runs for years, guiding major investment decisions.
The timeframe itself isn't the key; it's how you adapt your tactics to it. A higher low on a 5-minute chart demands a much tighter stop-loss and a quicker profit target than one developing on a weekly chart. The concept is identical, but the scale of risk and reward changes completely.
The market speaks the language of trends consistently, whether it’s over a few minutes or a few years. A great trader is just someone who learns to interpret it and adjust their strategy for their chosen timeframe.
What Are the Biggest Mistakes People Make?
Knowing the theory is one thing, but executing perfectly when your money is on the line is a whole different ball game. Traders often stumble into a few common traps when trading with higher lows and lower highs.
The single biggest pitfall is impatience. So many traders jump the gun, trying to predict where the pivot will form instead of waiting for the market to confirm it. This almost always leads to getting in too early and getting stopped out for a needless loss.
Another huge mistake is ignoring volume. A higher low forming on weak, drying-up volume is way less convincing than one that forms with a big surge of buying pressure. Volume is the ultimate confirmation of conviction.
Finally, setting your stop-loss way too tight is a classic rookie error. You have to give the trade room to breathe. The logical spot is just below the higher low that validated your entry (for a long) or just above the lower high (for a short). Patience and confirmation are your best friends here.
How Do I Know if It’s a Reversal or Just a Pause?
This is probably the trickiest part of reading a chart. After a strong run, is the price just catching its breath before the next leg up, or is it about to turn around and go the other way? The structure of the highs and lows holds the answer.
A consolidation phase—a period of sideways chop—is often marked by both higher lows and lower highs converging. The price range gets squeezed tighter and tighter, like a spring coiling up. This usually forms a textbook chart pattern like a symmetrical triangle, wedge, or rectangle.
A true trend reversal, however, is all about a clean break of the old structure. In a strong uptrend defined by a series of higher lows, the first real red flag is the creation of a lower low. That one move violates the core rule of the uptrend and signals that sellers have finally wrestled control from the buyers, at least for now.
Ready to stop hunting for trends and start having them delivered to you? ChartsWatcher provides powerful, customizable scanners and real-time alerts to pinpoint high-probability setups based on higher lows and lower highs across the entire market. Automate your analysis and trade smarter by visiting https://chartswatcher.com to get started.
