A Trader's Guide to Finding and Trading Unusual Volume Stock
An unusual volume stock is simply a company whose shares are trading hands at a much higher rate than normal. Think of it as a sudden, massive spike in activity compared to its recent daily average. This is a critical signal for traders because it often means institutional investors—the big players—are making moves based on breaking news or an upcoming event before the story fully hits the mainstream.
Understanding What Drives Unusual Volume in Stocks
When a stock suddenly sees a surge in volume, it's like the market is shining a huge spotlight on it. These spikes are almost never random. They're usually triggered by something significant that's grabbed Wall Street's attention.
By learning to read these signals, you're tapping into a core trading principle: significant volume often precedes significant price action. It’s your early warning system.
The Catalysts Behind the Surge
So, what causes a stock's trading volume to suddenly multiply? The reasons can vary, but they almost always point back to new, impactful information hitting the market. Figuring out these triggers is your first step in separating a real trading opportunity from just random market noise.
Some events are classic volume drivers. We've put together a quick breakdown to help you connect the dots when you see a spike.
Common Catalysts Behind Unusual Stock Volume
This table breaks down the key events that typically cause a stock's trading volume to spike, helping you quickly understand the story behind the numbers.
| Catalyst Type | Description | Typical Impact on Stock |
|---|---|---|
| Earnings Reports | A company announces quarterly or annual financial results that dramatically beat or miss analyst expectations. | High volume and high volatility as investors react to the news. Big beats can lead to gaps up, while misses can cause sharp sell-offs. |
| Regulatory News | Key decisions from government bodies like the FDA. This is huge for biotech and pharmaceutical stocks. | Can be explosive. An approval can send a stock soaring, while a rejection can cause it to collapse instantly on massive volume. |
| Mergers & Acquisitions (M&A) | News of a company being acquired by another, or two companies merging their operations. | The target company's stock usually jumps toward the buyout price on heavy volume. The acquirer's stock might dip slightly. |
| Analyst Upgrades/Downgrades | A respected Wall Street analyst changes their rating (e.g., from "Hold" to "Buy") or price target on a stock. | Can trigger a strong, short-term move as institutional funds and retail traders follow the analyst's lead. |
| Product Launches/News | A major new product announcement, a clinical trial update, or a significant contract win. | Positive news can generate intense buying pressure and volume, especially if the development is seen as a game-changer for the company. |
| Macroeconomic Data | Broader economic reports like inflation (CPI), employment numbers, or Federal Reserve interest rate decisions. | Tends to affect entire sectors or the market as a whole, driving volume in ETFs and bellwether stocks. |
Understanding what's behind the volume surge is the most important part of the puzzle. It tells you whether the move is backed by something real or just speculative chatter.
Take Delcath Systems Inc. (NASDAQ: DCTH), for example. It gave us one of the most jaw-dropping examples of unusual volume in action. In a single day, this biotech firm's trading volume exploded by a mind-boggling 13,568% compared to its average. The trigger? FDA approval for its innovative Hepzato Kit device. This wasn't just a flicker on the screen—the stock price shot up 91% that same day, creating huge profits for traders who spotted the volume spike early. You can dive deeper into how volume predicts price on ChartsWatcher.com.
Key Takeaway: Unusual volume isn't just a number—it’s a story. Every spike has a cause. Your job as a trader is to figure out that cause fast to decide if the stock's move has real momentum.
This is precisely where tools like ChartsWatcher come in. It’s built to catch these moments in real-time, matching up volume alerts with news feeds so you can connect the dots instantly. This helps you tell the difference between a fundamentally driven rally and speculative hype, which is absolutely crucial for making smart trades and avoiding expensive traps.
Building a Scanner That Finds the Real Movers
Alright, now you know why stocks pop on big volume. Let's get to the fun part: building the engine that actually finds these opportunities before everyone else does.
A well-tuned stock scanner is your single most important tool for spotting unusual volume in real-time. The generic, out-of-the-box settings just won't do. You need to dial in your filters to be sharp enough to find quality setups but not so narrow that you miss the hidden gems.
Think of it like casting a specialized net. Your goal is to catch the big, fast-moving fish—the ones driven by institutional money—while letting all the small, insignificant ones swim right on by. This comes down to focusing on a few proven criteria that signal genuine, heavy-handed interest.
Nailing Your Core Scan Criteria
The foundation of any powerful scanner rests on just a few key metrics. These are the non-negotiables that will instantly cut through the market noise and give you a manageable list of stocks showing significant activity.
-
Relative Volume (RVOL) > 3.0: This is your MVP. An RVOL of 3.0 means a stock is trading at 300% of its normal volume for that specific time of day. It's the clearest signal you can get that something unusual is happening right now. This filter alone will isolate stocks with a massive surge in interest.
-
Average Volume > 200,000 shares: Liquidity is everything. Requiring a stock to trade at least 200,000 shares on an average day helps you avoid illiquid traps. In these low-volume names, just one or two big orders can whip the price around, making it a nightmare to get in or out of a trade cleanly.
-
Price Range: This is entirely up to your personal trading style and account size. A great starting point is to filter for stocks between $5 and $100. This immediately gets rid of the highly manipulated penny stocks and also sidesteps those super high-priced stocks that can tie up too much capital in a single trade.
A scanner without a strong RVOL filter is like a fishing net with giant holes. It will let the most important opportunities—the stocks with massive institutional conviction—slip right through.
Refining Your Scan with Secondary Layers
Once the core filters are locked in, you can add a few secondary layers to really sharpen the quality of your results. These extra indicators help confirm the strength of a move and weed out random, directionless spikes in volume.
A simple but effective addition is a moving average filter. For example, requiring the current price to be trading above its 20-period SMA ensures you're looking at stocks that already have some bullish momentum. This little tweak increases the odds that the volume surge you're seeing will lead to a sustained push higher. If you want to explore more advanced setups, check out our comprehensive guide to real-time stock scanning.
For ChartsWatcher users, setting this up is dead simple. Just open a new "Alerts" window and plug these criteria in.
You'd set Relative Volume >= 3, Average Volume >= 200000, and then define your price range. You can save this exact configuration and have it running every single morning. It's how you turn a chaotic sea of market data into a clean, actionable list of trading ideas.
How to Interpret Volume Spikes in Different Market Conditions
Spotting a massive volume spike is easy. Anyone can see it. The real skill is knowing what it actually means right now, in this market.
A huge surge in trading activity is absolutely not a universal "buy" signal. In fact, its meaning is deeply tied to the market’s current mood. Misreading that context is one of the fastest ways I’ve seen traders get trapped on the wrong side of a move.
Think of it like this: a sudden downpour during a long drought is a fantastic sign. But that same downpour in the middle of a flood is a catastrophe. The event is the same, but the context changes everything. A stock popping on unusual volume behaves very differently in a roaring bull market versus a nervous, choppy one.
Bull Market vs. Bear Market Signals
In a strong bull market, seeing a stock break out on 5x its average volume is often a powerful confirmation. It’s a sign that big money is confidently stepping in, and the trend has the fuel to keep running. The volume is like gasoline on an already burning fire.
Now, flip the script. During a market correction or a full-blown bear market, that same volume spike can be a trap. It might signal capitulation—that final, panicked wave of selling right before a potential bottom. Or, it could just be a "dead cat bounce," a brief, sucker's rally that quickly rolls over and traps anyone who bought the dip.
In a bull market, high volume often confirms the trend. In a bear market, high volume often marks a point of exhaustion or reversal. This distinction is critical for survival.
The Influence of Market Cap and Sector
The story the volume tells also changes based on the type of company. A volatile, small-cap biotech stock might see a 5x volume surge and explode 30% on news of a clinical trial. It happens all the time.
But a blue-chip name like Skyworks? When it saw a 5.49x volume increase, that coincided with a much more measured 5.83% gain. During the bull run after the 2023 Fed pivots, volume confirmed momentum in 65% of cases. But in corrective phases, those same spikes preceded drops 55% of the time as traders dumped their positions.
You can see more real-time data on these movers over at TradingView's unusual volume scanner.
This simple flowchart shows a great starting point for setting up your own scanner to catch these opportunities.
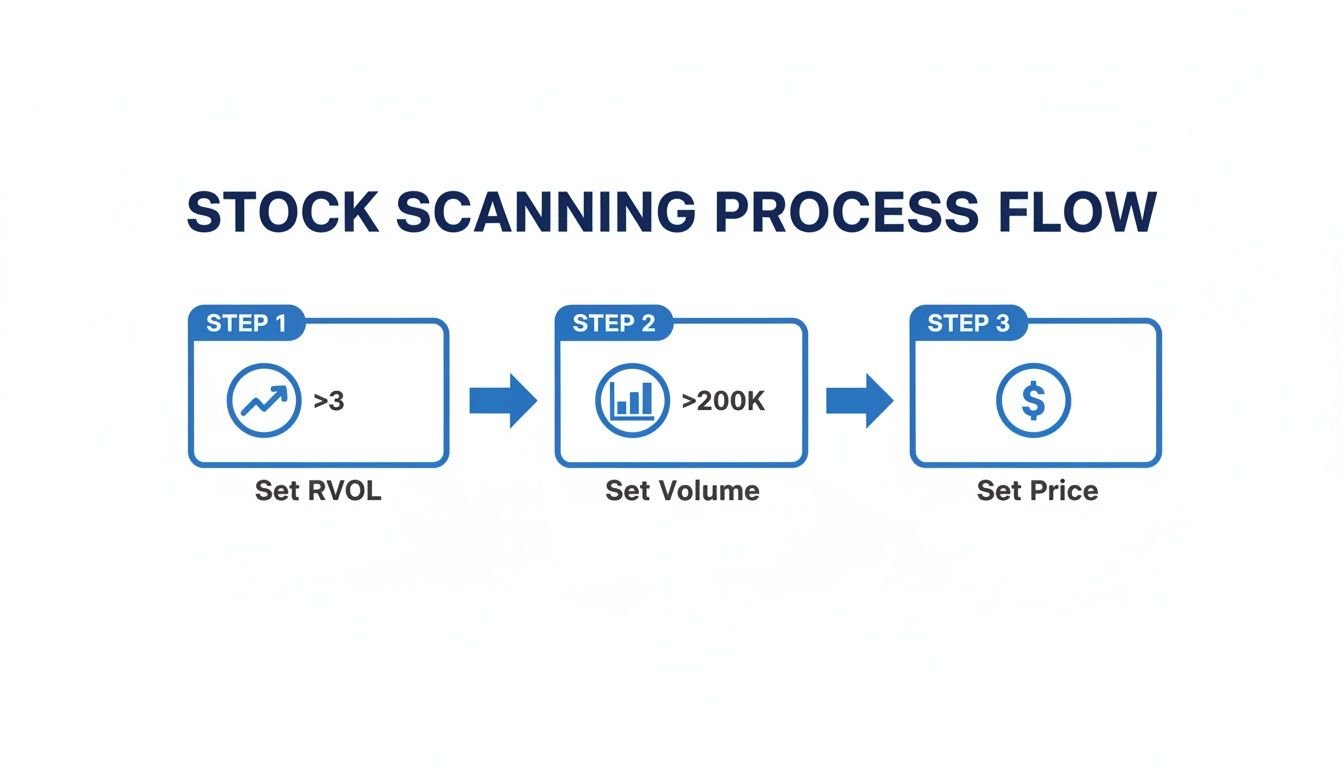
By setting these minimums for Relative Volume (RVOL), absolute volume, and price, you immediately cut through the noise and zero in on stocks with truly significant activity.
Tying News Directly to Volume
To really understand what's going on, you have to connect the volume spike to its catalyst—instantly.
This is where I rely on ChartsWatcher. It syncs my news feed directly with my volume alerts, so when a stock pops, I immediately see the headline that lit the fuse. This is the only way to separate a real, news-driven event from just random noise.
- Meaningful Event: FDA approval, an earnings surprise, a merger announcement. These moves have legs.
- Random Fluctuation: A huge block trade, some algorithmic quirk, or unfounded rumors. These moves often fizzle out fast.
Without that direct link between volume and news, you’re just gambling. To sharpen this skill, you can learn more about how to master the relative volume indicator. Once you can read the market condition and pinpoint the catalyst, you stop seeing numbers and start seeing the real story behind the trade.
Trading Strategies for Unusual Volume Stocks
Spotting an unusual volume stock is only half the battle. The real work—and the part where you actually make money—is in the execution. Having a handful of clear, battle-tested strategies is what separates traders who profit from volatility from those who just get burned chasing it.
So, let's shift from identifying these stocks to actually trading them. We'll walk through a couple of specific, repeatable setups that are built for the fast-paced nature of high-volume movers. Remember, every good trade needs defined entry triggers, logical profit targets, and hard stop-losses. No exceptions.
The High-Volume Breakout
This is a classic for a reason. The high-volume breakout is a pure momentum play focused on stocks that are finally punching through a stubborn resistance level. That massive surge in volume is your confirmation that the move has real power behind it.
Think about a stock that’s been trading sideways for weeks, bumping its head against $50 but never managing to break through. Then, one morning, some good news hits, and it blasts through $50 on 5x its average relative volume (RVOL). That's your signal.
- Entry Trigger: You enter the moment the price decisively clears that $50 resistance. Don't front-run it; wait for the confirmation.
- Stop-Loss Placement: Tuck your stop-loss just below the breakout level, maybe at $49.50. This gives the trade a little wiggle room but protects you if it’s a fakeout.
- Profit Target: For an initial target, you could aim for the next major resistance level or use a simple risk/reward ratio like 2:1. If you're risking $0.50 per share, you’d be looking to sell around $51.
The Gap-and-Go Play
This strategy is all about capitalizing on pre-market catalysts, like a killer earnings report, that cause a stock to open way higher than where it closed the previous day. The game here is to trade the momentum that kicks in right at the opening bell.
Let’s say a stock closes at $25, but thanks to that earnings beat, it’s set to open at $28. In the first few minutes after the market opens, the volume is already 10x what's normal.
The first few minutes of trading establish what's called the opening range. A common tactic is to wait for the first five-minute candle to close and then enter a long position if the price breaks above the high of that candle. This tells you the initial buying frenzy has follow-through. Your stop-loss goes just below the low of that same candle, defining your risk right from the start.
By running a strategy against past market conditions, you can see what actually works, refine your parameters, and build the confidence to act decisively when a real-time opportunity appears.
Building Confidence Through Backtesting
How do you really know if these strategies will work for you? You test them. Backtesting is the process of applying your trading rules to historical market data to see how they would have performed in the past.
Using the backtesting feature in ChartsWatcher, for instance, you could simulate the high-volume breakout strategy across thousands of stocks over the last six months. This data-driven approach gives you priceless insights. You'll discover what RVOL threshold works best and what the average win rate looks like. It’s this process that turns a cool idea into a sharp, reliable trading plan. For those who want to go even deeper, some traders integrate forecasting models into their analysis. You can learn more about that by Mastering Time Series Forecasting Methods.
This approach takes the emotion and guesswork out of your trading. You stop gambling on "hot" stocks and start executing a system that has a statistical edge. It’s probably the single biggest step you can take toward becoming a consistently profitable trader.
Trade Execution and Risk Management Tactics
Spotting a great setup on a stock with unusual volume is just the beginning. The real test—and where you make or lose money—is in the execution. These stocks can be wildly volatile, which opens the door to frustrating problems like slippage, where your entry price is way worse than you clicked for, and wide bid-ask spreads that can put you underwater the second you enter a trade.
You have to approach this environment differently. Forget about piling in with your full position all at once. I always prefer to scale into a position. By starting with a smaller chunk, you can get a feel for the price action and confirm the move before you’re fully committed. This approach really helps soften the blow of a poorly timed entry. And please, use limit orders. A market order in a volatile stock is an invitation for disaster; a limit order gives you total control over your entry price, period.
Defining Your Risk Before You Enter
Here’s probably the most critical rule in trading volatile names: you absolutely must know your exit point for a losing trade before you even think about hitting the buy button. A perfect entry means nothing if you don't have a disciplined plan to cut a loser. Without it, a small mistake can quickly snowball into a massive loss.
The good news is that the price action itself will give you logical spots to place your stop-loss. Here are a couple of methods I rely on:
- Below the Breakout Candle: If a stock is pushing through a key resistance level, I'll place my stop just under the low of the candle that made the break. If the price falls back below that, the breakout has failed, and I want out.
- The Prior Swing Low: For a stock that's already in a nice uptrend, setting your stop below the most recent swing low is a smart move. It gives the trade enough room to handle normal pullbacks without getting shaken out prematurely.
Key Takeaway: A stop-loss isn't a suggestion—it's your unbreakable rule. The difference between a professional risk manager and a gambler is the discipline to honor that stop-loss every single time, no questions asked.
Locking in Profits with Trailing Stops
Once a trade starts working in your favor, your job shifts from managing risk to protecting your profits. This is where a trailing stop becomes your best friend. It’s a dynamic order that automatically moves up as the stock price climbs, locking in gains while still giving the trade room to run higher.
You can set it to trail by a fixed percentage, like 10%, or you can tie it to a technical indicator like the 20-period EMA. As the stock marches upward, your stop follows it, acting as a safety net against a sudden reversal.
This is especially vital in sectors known for explosive, news-driven moves. Think about small-cap biotechs. We’ve all seen it: a company announces positive Phase II trial results, and trading volume explodes, sparking a 30%+ rally in a couple of days. That sudden surge in interest can shatter normal liquidity. You can actually discover more insights on high-volume movers at MarketBeat to see these patterns in action. In that biotech scenario, a trailing stop would have automatically captured a huge chunk of that gain for you.
Common Questions About Trading Unusual Volume
Stepping into the world of unusual volume trading always brings up a few key questions. It's only natural. Getting straight answers can help you build a solid strategy and, more importantly, avoid those classic rookie mistakes. Let's tackle the big ones.
What Is a Good Relative Volume to Look For?
Most active day traders I know won't even glance at a stock unless its Relative Volume (RVOL) is 3.0 or higher. Think of that as your baseline. It means the stock is trading at least three times its normal volume for that specific time of day, which is a clear signal that something is up.
Now, when you see RVOL pushing past 5.0, that's when things get really interesting. That often points to a serious, news-driven catalyst that could power a sustained run. But don't get hung up on one magic number. Context is everything. On a slow, choppy summer afternoon, even an RVOL of 2.0 might be enough to catch your eye.
The real key is to never look at RVOL in a vacuum. A high number has to be paired with a clean chart pattern and a real, verifiable news story.
How Do I Avoid Getting Caught in a Pump and Dump?
Learning to spot these is one of the most critical skills you'll ever develop. It's not as hard as it sounds if you know what to look for.
First and foremost: verify the catalyst. Is there a real press release about a contract win, an earnings beat, or an FDA approval? A legitimate move is always tied to tangible news you can find from a reputable source. Pump and dumps, on the other hand, are fueled by sketchy social media hype and anonymous accounts promising you the moon.
Next, just watch the price action. It tells a story.
- Pump and dump schemes often look like a single, near-vertical spike in the first few minutes of the market open. It’s unnatural and frantic.
- That spike is almost always followed by an equally brutal collapse as the insiders who pumped it up start dumping their shares on anyone naive enough to be buying.
Real institutional buying is more orderly. You'll see pullbacks, consolidation, and a steadier climb. If a move feels panicked and too good to be true, it’s a giant red flag telling you to stay away.
What Time of Day Offers the Best Opportunities?
No question about it, the "golden hours" are the first 90 minutes of the trading day, from 9:30 AM to 11:00 AM ET. This is when the big institutions are putting their money to work based on overnight news, which creates the massive volume and volatility we're looking for. The trend for the rest of the day is often set in this window.
There's another burst of activity in the final hour (3:00 PM - 4:00 PM ET), what traders call the "power hour." Volume picks back up as everyone adjusts their positions before the close. The midday hours, from roughly 11:00 AM to 2:30 PM, are usually dead. It's often called the "lunchtime lull" for a reason—it's choppy, quiet, and a tough time to find clean setups.
Ready to stop guessing and start trading with a data-driven edge? ChartsWatcher provides the real-time scanners, custom alerts, and backtesting tools you need to find and trade unusual volume stocks like a professional. Start your free trial today at chartswatcher.com and see the difference for yourself.
