A Trader's Guide to Finding and Trading Gapping Up Stocks
You wake up, grab your coffee, and pull up your pre-market scanner. To your surprise, a stock you’ve been watching closed at $50 yesterday but is already trading at $57 before the opening bell even rings.
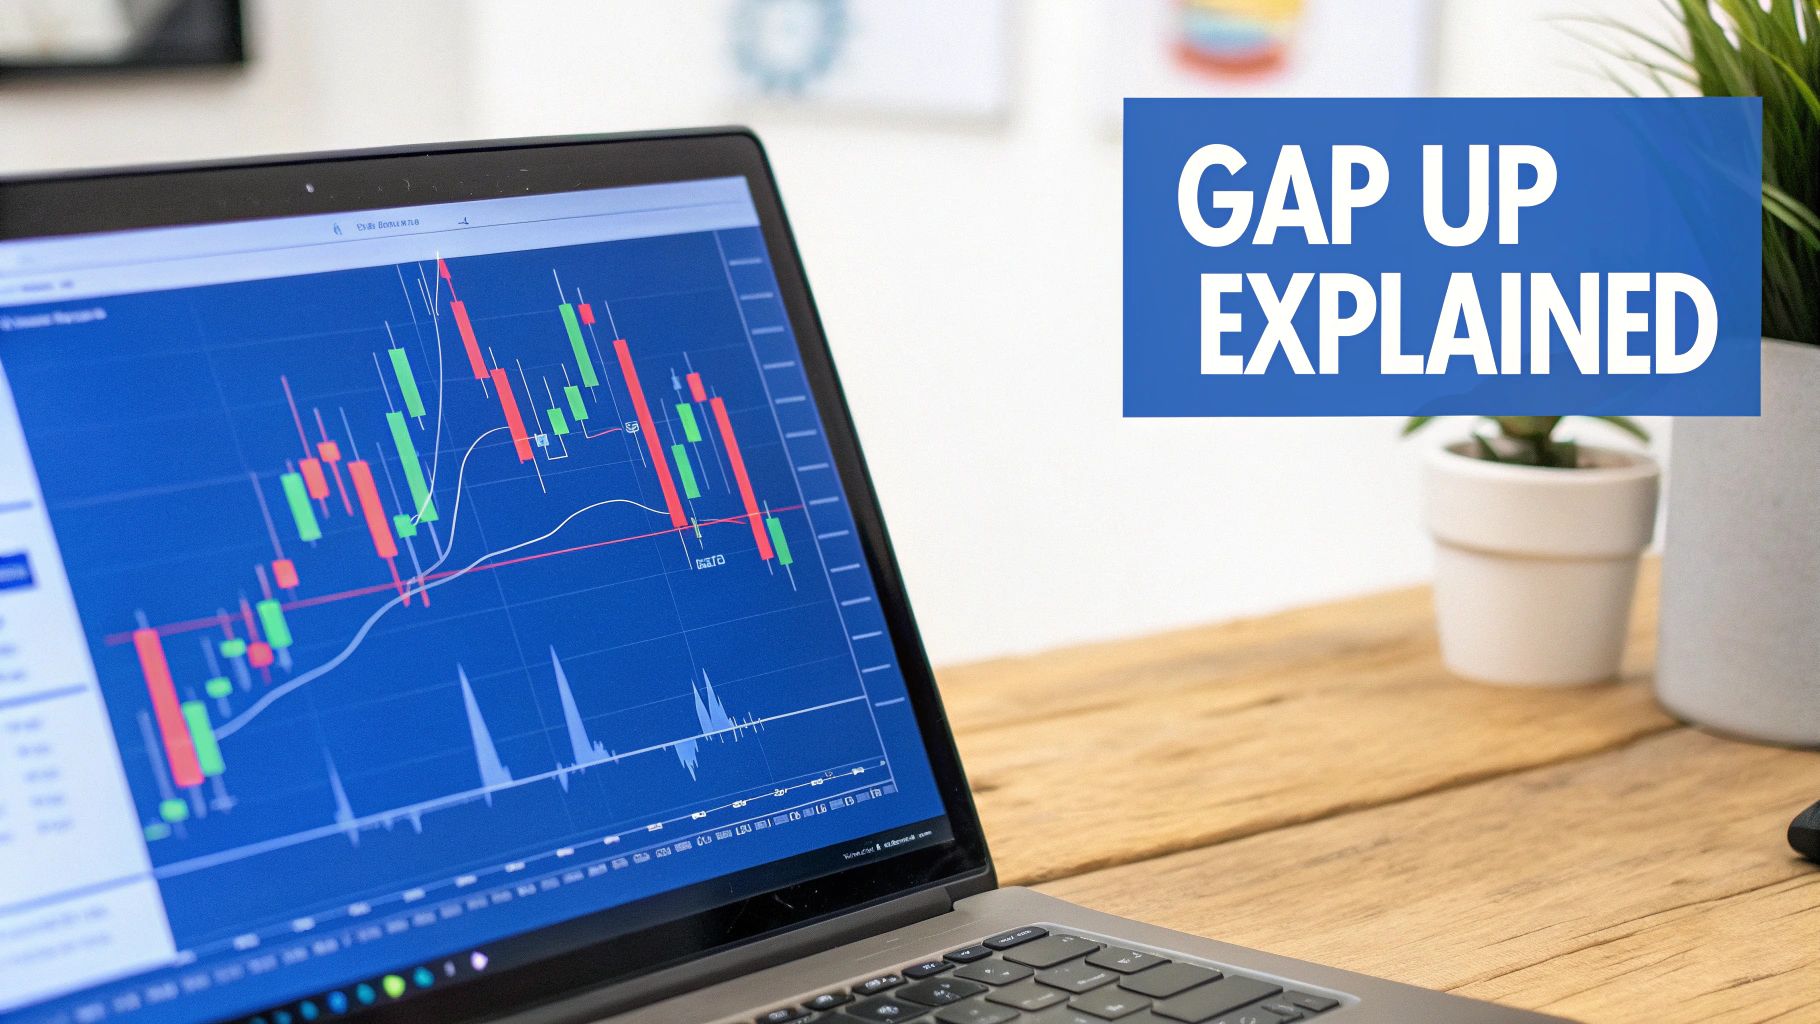
That 15% jump out of nowhere? That’s what we call a gap up.
A stock gapping up simply means it opens for trading at a significantly higher price than where it closed the previous day, leaving a literal "gap" on the price chart. This isn't random. These powerful moves are almost always a reaction to some kind of significant news or event that happened overnight, dramatically changing how investors see the company.
Understanding Why Stocks Gap Up
That empty space on the chart where no trades occurred is crucial. It represents a massive, instant imbalance between buyers and sellers. The demand to buy the stock suddenly overwhelmed the available supply at previous price levels, forcing the price to open much higher to find new sellers.
For traders, these gaps can signal some of the most explosive and profitable opportunities of the day. But before you even think about placing a trade, you have to understand the "why" behind the move. That’s the first—and most important—piece of the puzzle.
The Catalysts Behind the Gap
The reason why a stock gapped up is everything. The strength, validity, and potential for the move to continue all hinge on the quality of the news that caused it. A flimsy press release won't have the same staying power as a blockbuster earnings report.
As a trader, your first job is to become a news detective. You need to quickly figure out if the gap is built on a solid foundation or just hot air.
I’ve put together a table of the most common catalysts that you'll see driving these pre-market moves. Getting familiar with these will help you instantly gauge the potential strength of a gap.
Common Catalysts Driving Stock Gaps
| Catalyst Type | Description | Typical Impact | Example Scenario |
|---|---|---|---|
| Earnings Reports | A company reports quarterly results that blow past Wall Street’s expectations. | Very High | $META beats on revenue and user growth, causing a 20% gap up. |
| Mergers & Acquisitions | News breaks that a company is being bought out by another, usually at a premium. | High | $PFE announces it will acquire $SGEN for $229 per share; $SGEN gaps up to near that price. |
| Clinical Trial Data | A biotech or pharma company announces positive (or negative) results for a key drug trial. | Extreme | A small-cap biotech firm announces FDA approval for a new cancer drug, leading to a 150% gap up. |
| Product Launches | A company unveils a truly innovative new product or service with massive market potential. | Medium to High | $AAPL announces its Vision Pro headset, generating excitement and a gap up the next day. |
| Analyst Upgrades | A major, well-respected analyst upgrades a stock's rating and price target. | Low to Medium | A Goldman Sachs analyst upgrades $NVDA from "Hold" to "Buy," causing a smaller 3-5% gap up. |
Knowing the catalyst helps you filter out the noise and focus on gaps with real conviction behind them.
The core principle is simple: The more impactful the news, the more likely the gap will attract institutional money—the kind of capital that sustains a trend throughout the day and beyond.
Professional Gaps vs. Novice Gaps
Over the years, I’ve learned to make a critical distinction between what I call a "professional gap" and a "novice gap." It’s a concept that will save you a lot of headaches and money.
A professional gap is the real deal. It’s driven by a powerful, fundamental catalyst like a massive earnings beat or a buyout offer. You'll see huge pre-market volume, and it attracts the big players: mutual funds, hedge funds, and other institutions. These gaps often lead to a clean, sustained trend higher.
On the flip side, a novice gap is often a trap. It’s fueled by flimsy news, a junk press release, or social media hype. These moves are dominated by retail traders piling in with FOMO (fear of missing out). They often fail spectacularly, reversing hard right after the open in what traders call a "gap and crap."
Learning to spot the difference is essential. It’s how you avoid the traps and focus your energy only on high-quality gapping up stocks that have the best odds of working in your favor.
The Mind Game Behind Stock Gaps
A gap on a chart is much more than just empty space. It’s a powerful signal—a window into the collective psychology of the market. To trade gaps well, you have to understand what’s happening in those overnight hours that causes prices to leap, because it reveals the raw, unfiltered emotions that truly drive the market.
When a stock gaps up, it represents a sudden, almost violent shift in how the market perceives its value. This creates a massive imbalance between buyers and sellers before the opening bell even rings.
That imbalance is where our opportunity comes from. An intense psychological battle is already raging in the pre-market. On one side, you’ve got traders who held the stock overnight and woke up to a pile of unexpected profits. On the other side? A swarm of sidelined traders watching the stock soar, gripped by a powerful and dangerous emotion: FOMO (Fear Of Missing Out).
This dynamic creates incredible pressure right at the open. The immediate price action is often a brutal tug-of-war between the profit-takers looking to cash out and the chasers desperate to get in.
The Two Big Movers: FOMO and Loss Aversion
Human emotion is the fuel that ignites volatility, especially in gapping stocks. When traders see a stock already up 25% before the market opens, logic tends to go out the window. FOMO is a primal instinct for traders; it compels them to buy at any price, terrified of missing an even bigger move. This initial buying panic is what creates the explosive follow-through we see in classic "Gap and Go" plays.
But there’s another powerful force at play: loss aversion. This is the psychological principle that the pain of losing is twice as powerful as the pleasure of winning. Think about the traders who were short the stock. They are now in a world of hurt, forced to buy back shares at a much higher price to cut their losses. Their panicked buying adds even more fuel to the fire.
It's this chaotic clash of greed, fear, and panic that makes the first 30 minutes of the trading day so incredibly potent.
A stock gap is a consensus shock. The market has collectively screamed that the old price was wrong. The new price is being discovered in real-time, fueled by the most basic human emotions. Your job isn’t to get swept up in the hysteria, but to read it.
Why Do Gaps Sometimes Fill?
One of the most debated topics in trading is the "gap fill." This is the tendency for a stock’s price to reverse after the initial surge and drop back down to "fill" the empty space on the chart, returning to the previous day's closing price. So, what’s the psychology here?
It's actually pretty simple. If that initial buying frenzy isn't supported by serious, sustained volume (think institutional money), the FOMO-fueled rally runs out of gas. Fast.
The early buyers start to take profits. As the price begins to dip, it triggers a chain reaction of selling from others who now fear the gap was just a trap. This selling pressure can be enough to drive the stock all the way back down, closing the gap completely. Whether a gap holds and runs or fails and fills often comes down to the strength of the news catalyst and the volume behind the move.
Market Asymmetries: Good News vs. Bad News
Interestingly, the market doesn't treat all news equally. Behavioral finance has long shown that markets tend to react far more strongly to negative news than to positive news. This isn't just a theory; it's backed by hard data.
A deep-dive study covering over 2,600 U.S. stocks for a decade found that price adjustments to bad news (gapping down) were significantly larger than the moves for good news (gapping up). This lines up perfectly with the principle of loss aversion.
But the study also found a profitable quirk: after gapping up on positive news, stocks often continued to drift higher throughout the day. This presents a clear, repeatable pattern for traders to exploit. You can read more about these asymmetrical market reactions in the full study.
This is where a good scanner becomes your best friend. The screenshot below from ChartsWatcher shows a pre-market scanner doing the heavy lifting.
You can see how it instantly sorts stocks by their gap percentage, pre-market volume, and price. This allows a trader to cut through the noise and focus only on the high-quality setups. Building that kind of intuition, and pairing it with a powerful tool, is what separates traders who react to the market from those who anticipate its next move.
How to Build Your Pre-Market Gapper Scanner
Theory is one thing, but making money in the markets comes down to having a practical, repeatable process. This is where your pre-market scanner shines. It’s the tool that cuts through thousands of stocks to give you a clean, manageable watchlist of high-potential gapping up stocks before the chaos of the opening bell.
A poorly built scanner will just flood you with low-quality noise. A well-built one, however, becomes your secret weapon, delivering curated opportunities right to your screen. Let's get practical and set up a professional-grade gapper scanner from scratch, focusing on the filters that matter.
Setting Your Core Scanning Criteria
Your scanner is only as good as the rules you feed it. Vague parameters are a recipe for disaster, leaving you with a cluttered list of junk stocks. We need to be specific and intentional to find the true movers.
Every solid gapper scan I've ever built starts with these non-negotiable filters:
- Minimum Gap Percentage: This is your first line of defense against market noise. I like to set a baseline of >2% to ensure I'm only looking at stocks making a meaningful move. Anything less than that is often just random fluctuation.
- Minimum Pre-Market Volume: This is probably the most critical filter of all. High pre-market volume is your confirmation of genuine interest. A gap on low volume is a trap waiting to happen. I use 50,000 shares as an absolute minimum, but I get much more interested when I see 100,000+ shares traded. That’s often a sign that bigger players are involved.
- Price Range: You want to avoid the wild west of penny stocks and the slow, plodding nature of super high-priced stocks. Sticking to a range of $5 to $100 keeps you in a sweet spot of stocks with enough liquidity and volatility for day trading.
These three filters alone will clear out the vast majority of junk. From here, we can layer on more specific criteria to really sharpen our focus. And if you're looking to build more complex trading tools, getting expert help when choosing the right fintech development company is a smart move that can save you a lot of headaches.
Sample Gapper Scanner Configuration
To pull this all together, here’s a sample "recipe" for a powerful gapper scanner. Think of this as a solid starting point that you can—and should—tweak to fit your own trading style and risk appetite.
This table breaks down a typical setup I might use, explaining not just the "what" but the "why" behind each setting.
| Filter Parameter | Suggested Setting | Rationale for This Setting |
|---|---|---|
| Gap Percentage | Greater than 3% | Filters for significant moves that indicate a real catalyst is at play. |
| Pre-Market Volume | Greater than 100,000 | Confirms strong interest and liquidity, reducing the risk of "traps." |
| Price | Between $10 and $150 | Focuses on stocks that are liquid enough for easy entries/exits. |
| Relative Volume | Greater than 2.0 | Shows the stock is trading at least twice its normal volume for that time. |
| Float | Less than 100 Million | Lower float stocks tend to be more volatile and can make bigger moves. |
Of course, once you've got this foundation, you can get even more granular. For a deeper dive into the specifics, check out our detailed guide to build your winning gap up stock screener in ChartsWatcher.
This whole process—from the initial imbalance to the inevitable FOMO it creates—is a psychological rollercoaster.
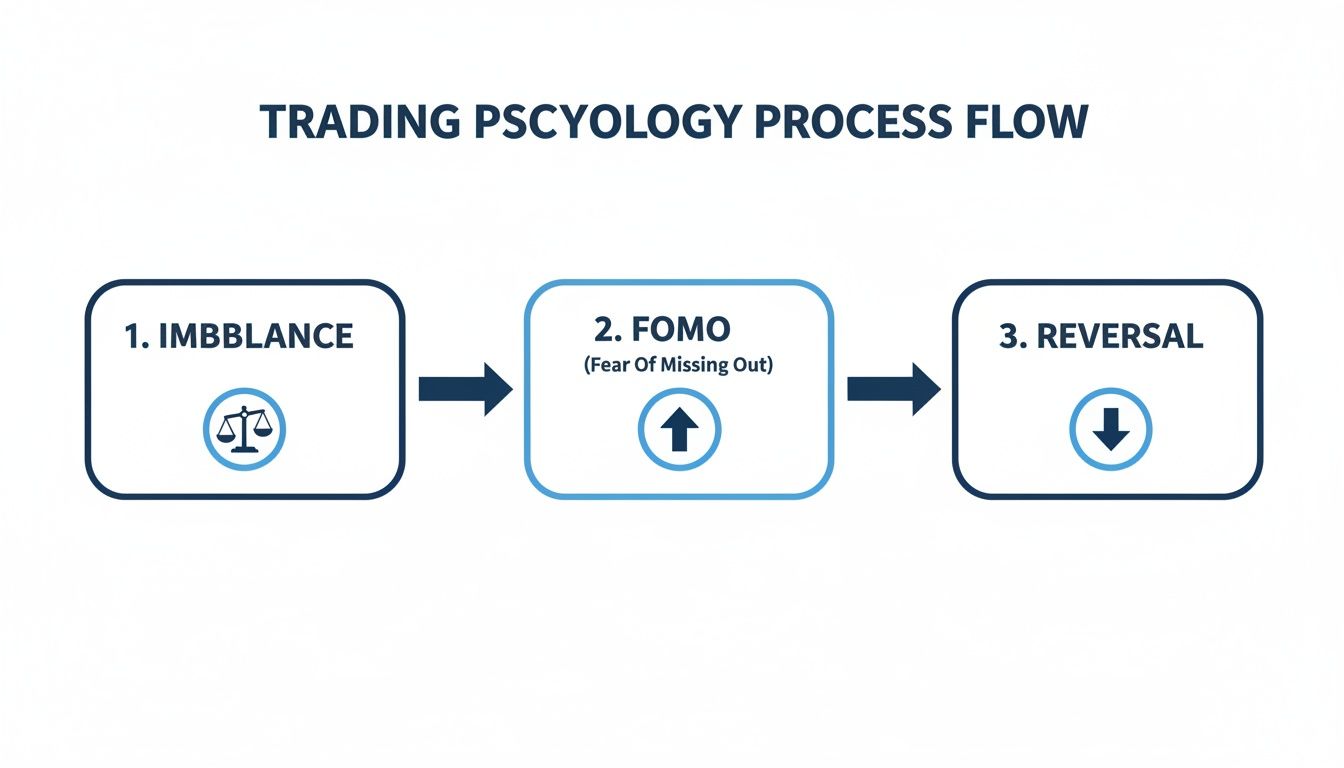
Understanding this emotional cycle is what will keep you grounded when your scanner serves up a hot, fast-moving stock that feels too good to be true.
A great scanner doesn't find trades for you; it finds opportunities. It's your job to apply strategy and discipline to those opportunities. Your scanner is the tool, but you are the trader.
By setting up these specific, data-driven filters, you turn your scanner from a simple list into an intelligent assistant. You're no longer staring at an overwhelming sea of tickers each morning. Instead, you're greeted with a curated, actionable list of the day's most promising gapping stocks.
High-Probability Gap Trading Strategies
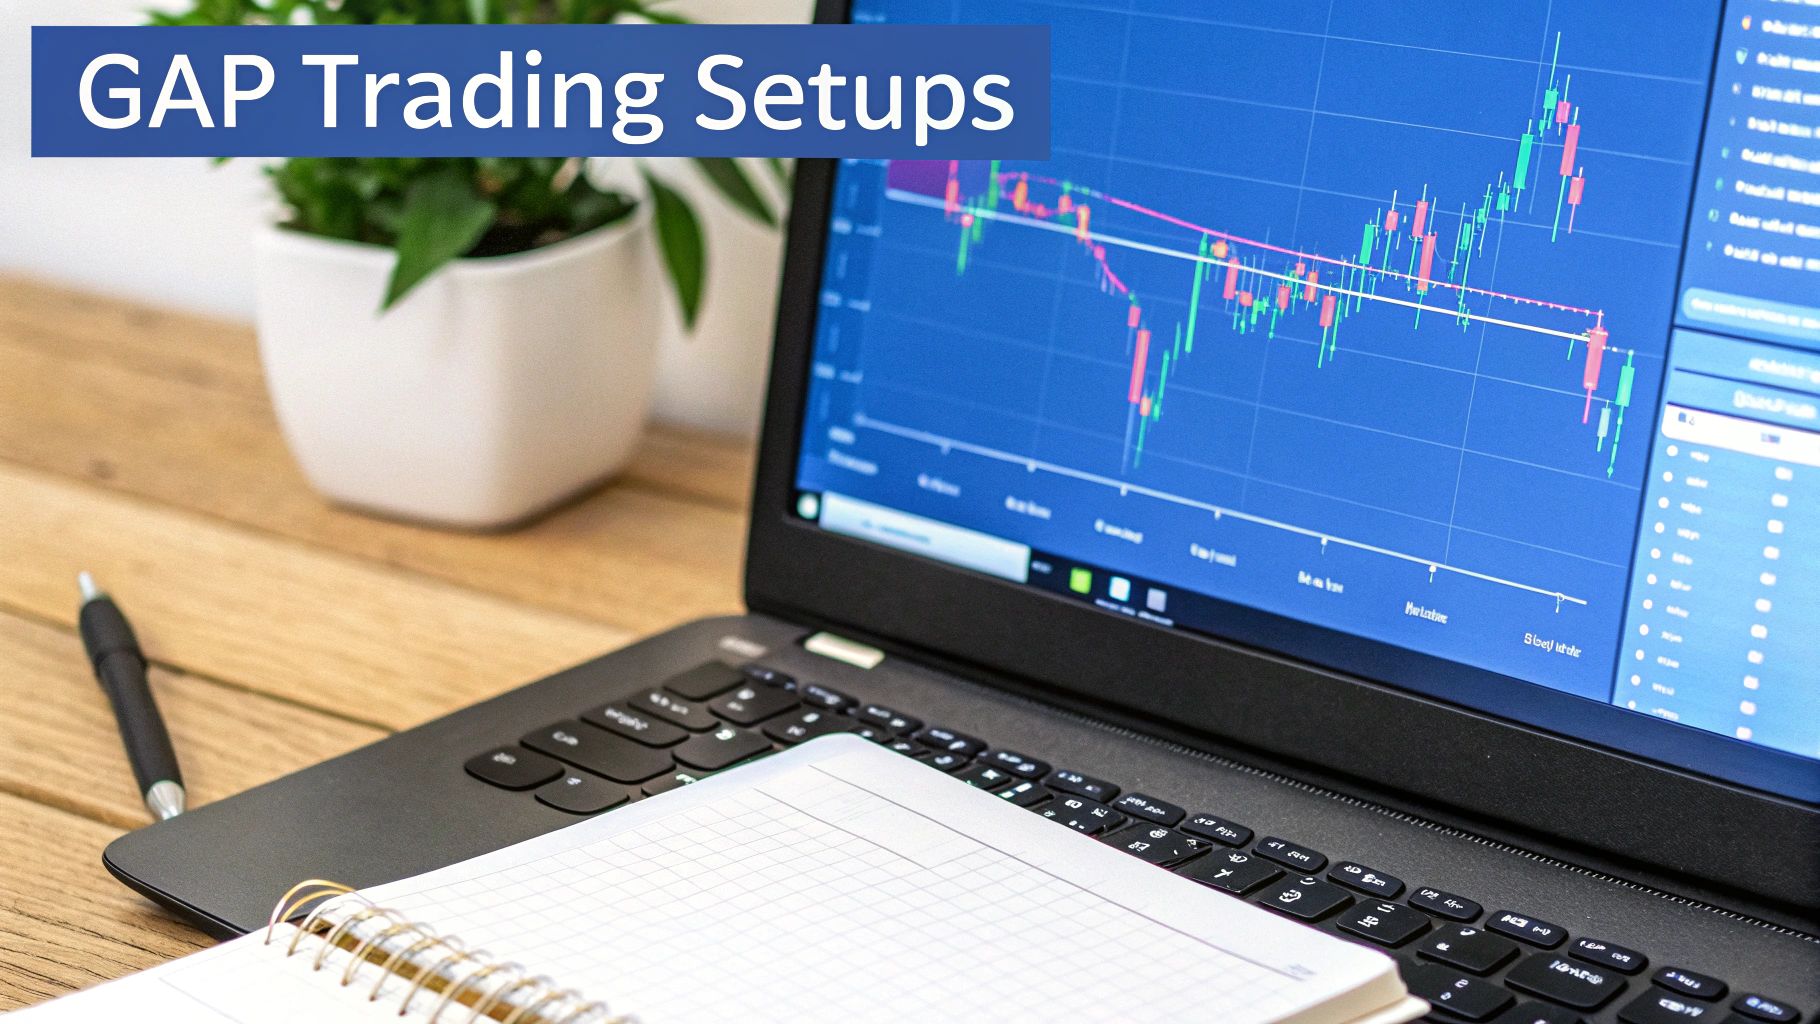
Once your scanner serves up a curated list of gapping stocks, the real work begins. Pinpointing the opportunity is only half the battle; the other half is executing a proven strategy with unwavering discipline. You can't trade all gappers the same way. The context—what’s the catalyst? how’s the pre-market volume? what’s the overall market doing?—tells you which approach gives you the best shot at success.
Let's break down three core strategies that should be in every gap trader's playbook. Each has its own specific entry triggers, risk management rules, and profit targets. If you can master these setups, you'll be ready to handle the different "personalities" you'll encounter in stocks gapping up.
The Classic Gap and Go
This is the quintessential momentum strategy, built for stocks showing overwhelming strength before the bell even rings. The idea is simple: buy the stock as it breaks out from its initial morning consolidation, riding the wave of buying pressure that often follows a powerful gap.
The perfect candidate for a Gap and Go has a few key ingredients:
- A powerful, undeniable catalyst, like a massive earnings beat that blows away expectations.
- Extremely high pre-market volume, often north of 500,000 shares.
- The stock is gapping up into "blue sky" territory (all-time highs) or is clearing a major resistance level on its daily chart.
The entry trigger here is usually a breakout above the pre-market high or the high of the opening range (the first 5 or 15 minutes of trading). Your stop-loss goes right below the opening range low. This setup is all about capturing a quick, explosive move as sidelined buyers jump in.
Remember, the Gap and Go is a pure momentum play. If the stock chops around and fails to break out with authority and volume, the setup is dead in the water. Any hesitation is a huge red flag.
The Gap Fill Reversal
Not every stock that gaps up is destined for the moon. Many gaps, especially those built on flimsy news or pure hype, are prime candidates for a reversal. The Gap Fill strategy is designed to profit from this fading momentum by shorting the stock as it weakens, with the goal of it falling back toward the previous day's closing price.
This setup works best when you spot these conditions:
- A weak or questionable catalyst that doesn't really justify the size of the gap.
- The stock gaps directly into a major resistance level on the daily or weekly chart.
- You see selling pressure right at the open, with bearish candlestick patterns like a shooting star forming on the 5-minute chart.
For this trade, the entry trigger is often a break below the opening range low. You'd place your stop-loss just above the high of the day. Your primary profit target? The price level where the gap started—the prior day's close.
The Opening Range Breakout
The Opening Range Breakout (ORB) is a more versatile strategy that simply lets the market tell you which way to go. Instead of trying to predict whether the gap will continue or fail, you just wait for the stock to establish an initial balance in the first few minutes of trading.
This "opening range" is typically defined by the high and low of the first 5, 15, or 30 minutes. From there, the plan is straightforward:
- For a long trade: You enter when the price breaks decisively above the opening range high.
- For a short trade: You enter when the price breaks decisively below the opening range low.
Your stop-loss is placed on the opposite side of the range. The ORB is a powerful approach because you're waiting for confirmation from the market before you put any capital at risk. It's a more patient, and often safer, way to play the open than trying to guess the direction right at the bell.
These setups aren't just theories; they reflect real market dynamics that play out every day. Even broad market indexes follow these patterns. For instance, historical data on the SPDR S&P 500 ETF (SPY) reveals its 12 largest gap-up moves over the last three years averaged a +2.0% gain. Gaps like these are often tied to major economic news, giving traders clear breakout or fade opportunities based on the follow-through momentum. You can find more details on SPY's historical gap moves and their statistical outcomes.
No matter which strategy you choose, success comes down to disciplined execution. Always define your entry, stop-loss, and profit target before you even think about clicking the buy or sell button. That pre-defined plan is your best defense against the emotional decisions that wreck so many traders in fast-moving markets.
Mastering Your Risk and Validating Your Edge
Finding a perfect gap setup is a rush, but that feeling is worthless without a bulletproof risk management plan. Let’s get one thing straight: profitable trading isn’t about hitting a few home runs. It’s about managing your losses so you can survive long enough for your strategy to actually work.
This is what separates the pros from the amateurs. Before you even dream about the profit potential, you need to know exactly what you’re willing to lose and be okay with it. This isn't just a friendly tip; it's the bedrock of a long-term trading career.
Non-Negotiable Risk Principles
Your best defense against blowing up your account is a set of rules you never, ever break. These principles need to become muscle memory, protecting you from making emotional, heat-of-the-moment mistakes.
The most important one? The 1% rule. This is a cornerstone of modern trading for a reason. It simply means you never risk more than 1% of your total trading capital on a single trade. If you have a $30,000 account, your max loss on any given position is $300. Period.
This rule forces you to prioritize capital preservation over chasing profits. It ensures that a string of losses—which happens to everyone—won’t knock you out of the game.
Risk management is the only thing you have complete control over in the market. You can't control if a stock goes up or down, but you can always control how much you're willing to lose if you're wrong.
Thinking about risk in a structured way is a universal skill. For a broader perspective, it's interesting to see how large organizations handle complex threats. For example, looking into the world of enterprise AI risk management shows how robust frameworks are built to mitigate high-stakes vulnerabilities, offering lessons that can be applied even to personal trading.
Validating Your Strategy with Backtesting
So, how do you know if your gap trading ideas actually have an edge? You test them. Backtesting is your strategy’s flight simulator—it’s the process of running your trading rules against historical market data to see how they would have performed in the past.
A solid backtesting routine takes you from a hunch to data-driven confidence. By digging into past performance, you can answer the questions that matter:
- What’s my strategy's win rate? (How often does it win?)
- What’s the average risk-to-reward ratio? (How much do I make on winners vs. lose on losers?)
- What's the profit factor? (Total profits divided by total losses. Anything over 1.5 is generally a good sign.)
Historical data on earnings gaps, for instance, is a goldmine for backtesting. A look at a stock like Apple (AAPL) reveals post-earnings gaps average 3.9%, with 61% of them resolving higher. The S&P 500, on the other hand, tends to fill its gaps about 60% of the time within six months.
The Power of a Trading Journal
If backtesting is about validating your strategy, a trading journal is about improving the trader. It is, without a doubt, the single most powerful tool for self-improvement you have.
Logging every single trade—the good, the bad, and the ugly—forces you to be honest with yourself.
Your journal needs to be more than just entry and exit prices. Write down why you took the trade, how you were feeling, and what you did right or wrong. Over time, this log will expose your psychological leaks, like cutting winners short or letting losers run. This kind of self-awareness is what turns a good strategy into consistently profitable trading.
For a deeper dive into building a robust testing process, check out our complete guide on how to backtest trading strategies like a pro.
Got Questions About Trading Gappers?
As we wrap up this guide, let's hit some of the most common questions that pop up when traders first dive into the fast-and-furious world of gapping stocks. These are the "what-if" scenarios and sticking points just about everyone runs into. Getting these sorted will help lock in the core lessons and let you trade with more confidence.
Think of this as the final check on your trading plan before you put real money to work.
What Is the Best Time of Day to Trade Gapping Stocks?
The real action—the highest volume and the cleanest moves—almost always happens in the first 30 to 90 minutes of the session. This window, from 9:30 AM to 11:00 AM ET, is what many of us call the "golden hour," and for good reason. It’s when the overnight holders are taking profits right as new buyers are jumping in, creating that explosive tug-of-war that gap strategies thrive on.
Trying to trade gappers after this period gets dicey. Volume usually craters, the price action gets choppy and unpredictable, and you see a lot more fake-outs. Most pros I know focus all their energy here and then step away, knowing the best, highest-probability setups are likely in the rearview mirror.
How Do I Differentiate a Strong Gap from a Weak One?
Telling a solid gap from a flimsy one is a skill you'll hone with screen time, but there are definitely a few tells to look for every morning. A strong gap—the kind you actually want to trade for a continuation move—usually checks three boxes.
- A Powerful Catalyst: The news behind the gap is a big deal. Think blowout earnings, a major buyout, or a huge FDA approval. It’s undeniable.
- Heavy Pre-Market Volume: You want to see real institutional footprints, which means volume ideally over 100,000 to 200,000 shares.
- A Clean Technical Breakout: The stock is gapping above a key resistance level on the daily chart or, even better, into blue-sky territory (all-time highs). There’s no overhead supply to slow it down.
On the flip side, a weak gap is often a trap waiting to spring. It might be driven by a fluffy press release, have paper-thin pre-market volume, and open right into a wall of resistance from the daily chart. These are fueled by hype and are the perfect candidates for a "Gap Fill" reversal play.
The story and the volume tell you almost everything you need to know about the quality of a gap. Always start there. If the news is weak and the volume is thin, the odds are already stacked against a sustained run.
Can Gapping Stocks Be Used for Swing Trading?
Absolutely, but you have to completely shift your mindset from day trader to swing trader. A day trader is trying to scalp the initial morning volatility. A swing trader is looking for a multi-day, sometimes multi-week, move. The secret is spotting when a gap represents a true, fundamental change in a company's story.
If a stock gaps up on truly game-changing news and then closes the day near its high on massive, climactic volume, that’s a huge signal. It tells you that big institutions are likely just starting to build their positions. A swing trader might look to enter near the close of that first powerful day, placing a stop-loss just below the day's low, aiming to ride the follow-through momentum for days to come.
What Is the Biggest Mistake Traders Make with Gappers?
Without a doubt, the single most destructive mistake is chasing the stock at the market open because of FOMO. Seeing a stock screaming higher by 30% in the pre-market triggers that primal fear of missing out, causing traders to frantically hit the buy button at 9:30:01 AM. More often than not, they get filled at the absolute high of the day.
A pro never chases. They wait. They let the initial chaos settle down and wait for a structured, low-risk entry to form. This could be a pullback to a support level like VWAP, or a clean breakout above the opening range high. In the world of gapping stocks, patience isn't just a virtue—it's your best defense against emotional, account-killing trades.
Ready to stop guessing and start building a data-driven edge? ChartsWatcher provides the powerful, customizable scanning and backtesting tools you need to find high-probability gapping stocks every morning. Build your professional-grade scanner and start trading with confidence by visiting https://chartswatcher.com.
