A Trader's Guide to Engulfing Candlestick Patterns
When you stare at a candlestick chart, you’re not just looking at prices. You’re watching a story unfold—a visual account of the constant tug-of-war between buyers (the bulls) and sellers (the bears). Sometimes, one side has a clear advantage, pulling the price steadily in one direction and creating an obvious trend.
But what happens when the momentum suddenly flips? What does it look like when one side gets completely overpowered?
That’s where engulfing patterns come in. They are one of the most powerful and easy-to-spot signals that a reversal might be just around the corner. An engulfing pattern isn’t just a minor price change; it's a dramatic sign that the group that was in control has lost its grip, and the opposition has taken over with overwhelming force.
A Financial Tug-of-War
Think about a downtrend where sellers are confidently dragging the price lower. Each red candle is another win for their team. Then, out of nowhere, a massive green candle appears. It doesn’t just stop the sellers' progress—it completely swallows their last effort. This is the bullish engulfing pattern. It’s like the buyers’ team suddenly yanked the rope so hard the sellers were pulled right off their feet.
Conversely, imagine an uptrend where the bulls are marching prices higher. A huge red candle forms, completely engulfing the prior green candle. This is the bearish engulfing pattern, a clear signal that the bears have staged a successful ambush and the buyers' advance has been brutally stopped.
These patterns are more than just shapes on a chart; they are a clear visualization of market psychology in action. They capture a moment of capitulation for one side and a moment of triumphant dominance for the other.
This infographic captures the "tug-of-war" concept perfectly, showing how these patterns represent a decisive shift in market control.
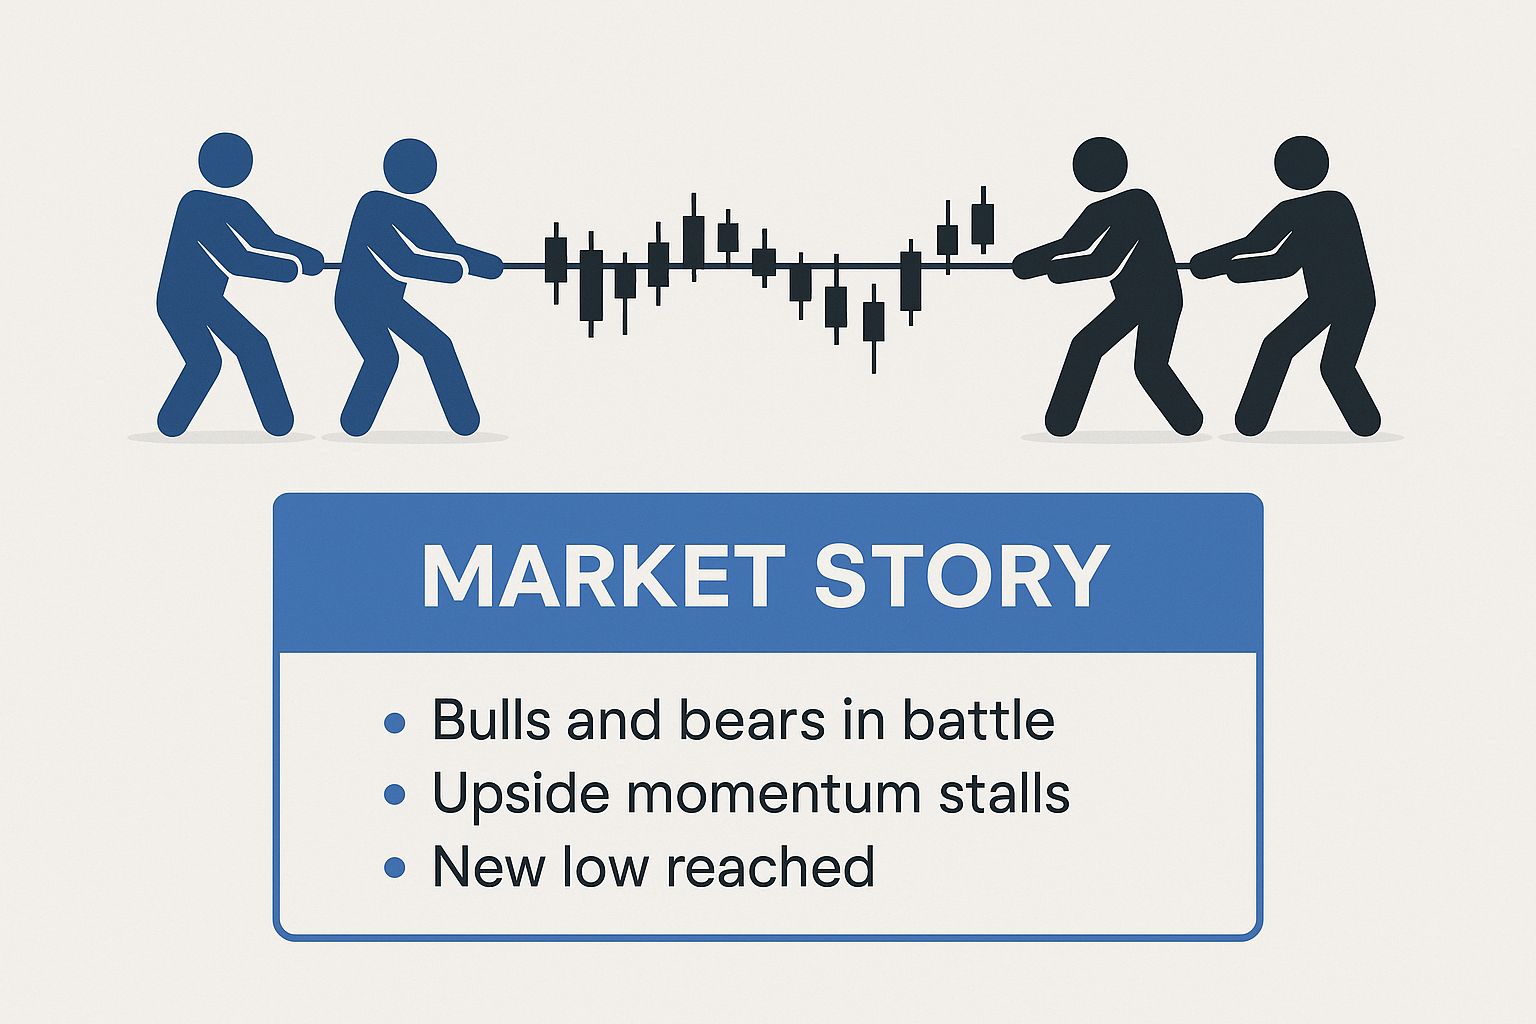
As the image shows, an engulfing pattern is a visual confirmation that the balance of power has dramatically and suddenly changed hands.
Engulfing Patterns Quick Reference Guide
To make identification even easier, here's a quick side-by-side comparison of the two patterns. Think of it as your cheat sheet for spotting these reversals in the wild.
| Characteristic | Bullish Engulfing Pattern | Bearish Engulfing Pattern |
|---|---|---|
| Prior Trend | Appears during a downtrend | Appears during an uptrend |
| Candle 1 | A small bearish (red) candle | A small bullish (green) candle |
| Candle 2 | A large bullish (green) candle | A large bearish (red) candle |
| Key Feature | The body of the 2nd candle completely engulfs the body of the 1st candle | The body of the 2nd candle completely engulfs the body of the 1st candle |
| What It Signals | Potential bottom reversal (start of a new uptrend) | Potential top reversal (start of a new downtrend) |
This table helps you quickly distinguish between the two, focusing on the context of the trend and the colors of the candles involved.
Why Do These Patterns Matter?
Learning to spot these visual cues is a fundamental skill for any trader. They act as an early warning system, helping you anticipate potential market tops and bottoms before they are obvious to everyone else. By identifying and interpreting these signals, you gain a much clearer view of the underlying price action.
Of course, before diving into the specific strategies for trading these patterns, you need a solid grasp of the basics. If you need a refresher, check out our complete guide to understanding candlestick graphs. It covers the anatomy of a candle and how to read its story, which will make spotting engulfing patterns feel like second nature.
How to Spot a Bullish Engulfing Pattern
Among all the candlestick patterns out there, the bullish engulfing is one of the most powerful and visually obvious reversal signals a trader can find. It tells a clear story of a sudden, decisive shift in market control, showing the exact moment buyers completely overwhelmed sellers after a downtrend.
Think of it like a tug-of-war. One team has been steadily losing ground, getting dragged through the mud. Then, in a single, powerful heave, they not only stop their retreat but pull the entire opposing team off their feet. That’s a bullish engulfing pattern in a nutshell.
This two-candle formation gives you a strong hint that selling pressure has finally dried up and a new wave of buying demand is crashing in. For traders, spotting this signal early can mean getting into a new uptrend before the rest of the market catches on. But to use it right, you have to know its specific parts and the context where it appears.
The Anatomy of the Pattern
At its heart, the bullish engulfing pattern is made up of two back-to-back candlesticks. Each one tells a critical part of the reversal story.
-
Candle 1: The Seller’s Last Stand: The first candle has to be a bearish (red) one, appearing during an established downtrend. It's often a smaller candle, hinting that the sellers are running out of steam.
-
Candle 2: The Buyer’s Takeover: The second candle is the main event—a large bullish (green) candle. It needs to open at or even below the previous candle's close and then close well above the previous candle's open.
The key feature is that the real body of the second (bullish) candle must completely "engulf" the entire real body of the first (bearish) candle. This shows, in no uncertain terms, that buyers didn't just fight off the sellers; they completely reversed all of the previous day's losses and then some, seizing total control.
A true bullish engulfing pattern isn't a gentle nudge in the other direction. It's an overwhelming show of force that signals a deep psychological shift in the market—sellers have given up, and buyers are stepping in with conviction.
Core Identification Criteria
Not every big green candle after a small red one makes the cut. To keep from getting faked out by minor price blips, traders rely on a strict checklist. Ignoring these rules is a fast track to misreading the market.
For a pattern to be considered a valid bullish engulfing, it must meet these conditions:
-
An Established Downtrend: The pattern has to show up after a clear period of falling prices. A bullish engulfing pattern that forms in the middle of a choppy, sideways market just doesn't carry the same weight. Context is everything.
-
The Right Candle Structure: The first candle is bearish, following the trend. The second candle is bullish, signaling the change in direction. Simple as that.
-
The Engulfing Action: This is non-negotiable. The body of the second (bullish) candle has to completely swallow the body of the first (bearish) one. The wicks aren't as important, but the relationship between the real bodies is what defines the pattern.
-
Confirmation and Volume: While not technically part of the pattern's definition, smart traders always look for confirmation. A spike in trading volume on the day of the engulfing candle adds a ton of credibility. It proves the buyers' takeover was backed by real money and broad participation.
Mastering the Bearish Engulfing Pattern
Just as the bullish engulfing pattern signals a potential turnaround at the bottom, its powerful counterpart, the bearish engulfing pattern, acts as a critical warning sign at the peak of an uptrend. This two-candle formation tells the dramatic story of a sudden, violent shift in market control where sellers ambush the buyers and seize command.
Think of an army steadily marching up a hill, gaining ground with each step. Their confidence is high. Then, out of nowhere, a much larger opposing force charges down, not just stopping their advance but completely overwhelming their position. That’s the bearish engulfing pattern in action—a clear signal the upward battle is likely lost.
For a trader, this pattern is a major red flag that buying momentum has evaporated and a wave of selling pressure is taking over. Spotting it early can give you the chance to get out of long positions or even consider short entries before a significant downtrend gets going. But to use it effectively, you have to know its anatomy and what gives it real power.
Anatomy of a Bearish Reversal
The bearish engulfing pattern is made up of two specific candles that show up after a solid price run-up. Each candle plays a key part in the reversal story.
-
Candle 1: The Buyer's Last Push: The first candle has to be bullish (green), keeping the uptrend alive. It often has a smaller body, which can be an early hint that the buyers' conviction is starting to fade.
-
Candle 2: The Seller's Ambush: The second candle is where the real action is. It's a large bearish (red) candle that opens at or slightly above the first candle's close, but then slams down to close well below the first candle's open.
The defining feature is that the real body of the second (bearish) candle must completely "engulf" the real body of the first (bullish) one. This isn't just a small setback for buyers; it's a total rout. Sellers didn't just push back—they forcefully erased all of the previous day's gains and then some, showing they are now overwhelmingly in control.
A true bearish engulfing pattern marks a moment of capitulation for the bulls. The psychological blow is huge, as it shows sellers have stepped in with enough force to absorb all the buying interest and slam the market into reverse.
Key Criteria for Identification
Not every big red candle after a green one is a true bearish engulfing pattern. Experienced traders use a strict checklist to filter out market noise and focus only on high-probability setups.
1. A Clear and Established Uptrend Context is everything. A bearish engulfing pattern carries the most weight when it appears after a sustained uptrend, because it signals that the trend might finally be out of gas.
2. The Correct Candle Structure The first candle must be bullish, going along with the trend. The second candle must be bearish, showing the dramatic flip in sentiment.
3. The Engulfing Action This is the non-negotiable rule. The body of the second (bearish) candle has to completely swallow the body of the first (bullish) candle. The wicks can sometimes poke out, but it's the relationship between the real bodies that defines the pattern.
4. Confirmation with Volume For extra confirmation, traders love to see a spike in trading volume on the day the bearish engulfing candle forms. High volume means a lot of traders were involved, which adds serious credibility to the reversal signal.
This pattern is well-respected for its high success rate in calling trend reversals. In fact, the Bearish Engulfing pattern shows a bearish reversal rate of about 79%, making it one of the more reliable signals you can find. You can explore more detailed performance stats and read the full analysis on trading strategies.
Trading Strategies for Engulfing Patterns
Spotting a bullish or bearish engulfing pattern is a great skill to have, but it's really only half the battle. The real work begins when you have to turn that observation into a solid, repeatable trading plan. A pattern is just a signal; a strategy tells you exactly how to act on it, where to cut your losses, and when to take your profits.
Without a clear framework, it's easy to jump the gun or hang on too long, turning what could have been a winning setup into a frustrating loss. This section lays out an actionable blueprint for trading these powerful reversal signals, covering everything from the entry trigger to risk management.
Pinpointing Your Entry
The single biggest mistake traders make? Entering the trade while the engulfing candle is still forming. Trust me, market sentiment can flip on a dime. What looks like a monster engulfing candle mid-session can easily shrink into nothing by the close.
The golden rule is simple: wait for the engulfing candle to close.
This simple act of patience confirms that the buyers (for a bullish engulfing) or sellers (for a bearish one) truly held control for the entire period. Once that candle is locked in, you can plan your move. A straightforward approach is to place a market order right at the open of the very next candle, getting you into the trade just as the new momentum kicks off.
Setting a Strategic Stop-Loss
Every single trade needs a stop-loss. Period. It's your safety net—the predetermined point where you admit the trade isn't working out and get out to protect your capital. The good news is that with engulfing patterns, placing your stop is pretty intuitive.
-
For a Bullish Engulfing Pattern: The stop-loss goes just below the low of the big bullish candle. That level is where buyers mounted their strongest defense. If the price breaks below it, the whole bullish idea is likely dead.
-
For a Bearish Engulfing Pattern: Place your stop-loss just above the high of the big bearish candle. This marks the peak of seller aggression. If the price pushes past that high, the bears have lost control, and it's time to close the short.
Getting your stop-loss placement right is non-negotiable for smart risk management.
Establishing Clear Profit Targets
Knowing when to cash out is just as critical as knowing when to get in. A common and highly effective method is to use a risk-to-reward ratio, which ensures your potential profits are worth the risk you're taking.
A good starting point is a 1:2 risk-to-reward ratio. This means you're aiming to make at least twice the amount you're risking on the trade.
Example: You go long after a bullish engulfing pattern. The distance from your entry to your stop-loss is $1. A 1:2 risk-to-reward ratio means you’d set your profit target $2 above your entry price.
This disciplined approach helps take the emotion out of your exit strategy and builds consistency over the long run. Of course, you can also use other technical levels, like nearby support or resistance zones, as logical places to take profit.
The Critical Role of Confirmation
An engulfing pattern is a strong clue, but it's never a guarantee. False signals are a reality of trading, especially in choppy or low-volume markets. To stack the odds in your favor, you need to look for confirmation from other indicators. Think of it as getting a second opinion before making a big decision.
Two of the best confirmation tools out there are volume analysis and oscillators.
1. Volume Confirmation A big spike in trading volume on the day the engulfing candle forms is one of the strongest confirmations you can get. High volume shows conviction. It tells you that a lot of money and participants were behind that move, giving the reversal signal much more weight. Our guide on trading with volume provides a modern guide to market analysis is a fantastic resource if you want to really dig into this concept.
2. Oscillator Confirmation Oscillators like the Relative Strength Index (RSI) are great for measuring momentum and spotting overbought or oversold conditions.
-
A bullish engulfing pattern becomes much more compelling if it shows up when the RSI is in oversold territory (usually below 30). This alignment suggests that the selling pressure is exhausted and a bounce is likely.
-
A bearish engulfing pattern gets a major credibility boost when it forms while the RSI is overbought (usually above 70). This hints that buying momentum is running out of steam and the market is primed for a pullback.
By layering confirmation on top of pattern recognition, you start to filter out the weak, low-probability signals. This transforms pattern spotting from a guessing game into a methodical and disciplined trading strategy.
Avoiding the Common Traps and Leveling Up Your Strategy
It’s easy to get excited when you spot a clean-looking engulfing pattern. But here’s the hard truth: these patterns aren't magic bullets. They are signals of probability, not certainty. Treating them like a crystal ball is one of the fastest ways to burn through your trading account.
To really make these patterns work for you, you have to move beyond just spotting them. You need to understand their nuances, the common pitfalls, and most importantly, the market story they're telling.
One of the most dangerous traps is confirmation bias. This is our brain's tendency to see what we want to see. Imagine a stock has been tanking for weeks. A trader, desperate for the bleeding to stop, might see the first big green candle and immediately call it a bullish engulfing pattern, even if it doesn't quite fit the rules. This isn't trading; it's wishful thinking.
A pro stays objective. They treat every pattern as just one piece of the puzzle, something to be weighed and validated, not blindly followed.
Market Context is Everything
Where an engulfing pattern shows up is just as important—if not more important—than the pattern itself. A signal in a messy, sideways market is mostly noise. But a signal at the end of a long, obvious trend? That’s something to pay attention to.
Think of it like a "Falling Rocks" sign on the highway. If you see that sign at the base of a massive, rocky cliff, you hit the brakes. If you see the same sign on a flat, open prairie, you'd just be confused. It's meaningless without the right context.
- In a Strong Trend: When an engulfing pattern appears after a stock has been screaming higher or plunging lower for days on end, it often signals exhaustion. This is a high-probability setup because it hints at a major shift in momentum. The old trend is running out of steam.
- In a Ranging Market: In a sideways market, prices are just bouncing between support and resistance with no real conviction. An engulfing pattern here might just be a minor ricochet off one of those levels, not the beginning of a whole new move.
Ignoring the broader market structure is a classic rookie mistake. Before you even think about trading a single candle, zoom out and get a feel for the bigger picture.
Why Some Engulfing Patterns Fizzle Out
Not every textbook-perfect engulfing pattern works. Far from it. Understanding why they fail is what separates the consistently profitable from the perpetually frustrated.
The most common reason for failure is a lack of follow-through. A bullish engulfing pattern is a great start, but it needs other buyers to jump in on the next candle to keep the party going. If they don't show up, the signal dies on the vine.
Another huge piece of the puzzle is volume.
A truly powerful engulfing candle should pop on a big spike in trading volume. This surge shows that there's real money and conviction behind the reversal. If you see a giant engulfing candle form on weak, below-average volume, that's a massive red flag.
Low volume suggests there isn't broad participation. The move could just be a "head fake" caused by a single large order instead of a genuine change in market sentiment, making the signal far less reliable.
Exploring Rarer, More Powerful Variations
Beyond the standard patterns, there are less common variations that can pack an even bigger punch precisely because they're so rare. One of these is the Last Engulfing Top. It's a specific bearish reversal pattern that, while you won't see it often, can be an incredibly potent sign of a market peak.
Its scarcity is its strength. When a pattern doesn't show up often, traders tend to take it more seriously when it finally does. For example, a 20-year statistical analysis of the S&P 500 found that the Last Engulfing Top made up just 3.16% of all identified candlestick patterns. You can discover more insights about these pattern statistics and see for yourself how rarity can correlate with reliability.
By developing a more critical eye, you can start filtering out the noise and focusing only on the A+ setups. This means always checking the market context, demanding volume confirmation, and knowing why some patterns are doomed to fail. This disciplined approach is what separates the traders who get lucky once in a while from those who build lasting success.
Frequently Asked Questions About Engulfing Patterns
Even with a solid grasp of the mechanics, it's totally normal to have some lingering questions about engulfing patterns. Trading is a game of nuance, and the deeper you go, the more you realize every little detail can make a difference. Let's tackle some of the most common questions traders have to help lock in your understanding.
How Reliable Are Engulfing Candlestick Patterns?
This is the million-dollar question, isn't it? While no single pattern is a crystal ball, engulfing patterns are widely seen as one of the more dependable reversal signals out there. Their power comes from the simple, dramatic story they tell: a sudden, overwhelming shift in market sentiment. When a huge candle completely swallows the one before it, that’s a powerful visual that’s hard to ignore.
But here’s the key: their reliability shoots up when you get confirmation. Think of the pattern as an initial flare, not the final order to attack.
The real magic of an engulfing pattern happens when it's backed up by other signals. A pattern on its own is just an interesting observation. A pattern confirmed by a spike in volume and an overbought RSI? Now that's an actionable trading setup.
If you're into stats, a major study that crunched data from thousands of markets over decades found that an engulfing pattern pops up roughly every 37 candles. The same study reported a confirmation rate of about 67.3%, meaning the price continued in the pattern's direction a good chunk of the time. For a deeper look at the performance metrics, you can check out more on these engulfing pattern findings.
What Timeframe Is Best for Trading Engulfing Patterns?
Engulfing patterns show up on every chart, from the frantic one-minute to the calm weekly. As a general rule, though, their significance and reliability grow with the timeframe.
Here’s a quick way to think about it:
-
Lower Timeframes (e.g., 1-minute, 5-minute): You'll see these patterns all the time, but many will be market "noise" or false alarms. They can work for scalpers, but you need lightning-fast reflexes and iron-clad risk management.
-
Higher Timeframes (e.g., 4-hour, Daily, Weekly): These patterns are rarer, but they carry a lot more weight. A daily bullish engulfing pattern means an entire day's worth of trading ended with buyers decisively crushing the sellers. That’s a much stronger statement than a five-minute blip. These are the signals swing and position traders live for.
For most traders, the daily and 4-hour charts are the sweet spot. They give you a good feel for these patterns without getting bogged down by the noise of lower timeframes.
Can Engulfing Patterns Signal Trend Continuation?
Absolutely. While they're famous as reversal signals, engulfing patterns can be powerful signs of trend continuation, especially after a quick pullback.
Picture a strong uptrend. The price dips for a day, forming a small red candle. The very next day, a massive green candle not only engulfs that red candle but also pushes to a new high. In this case, the bullish engulfing pattern isn't reversing anything—it's screaming that the pullback is over and the bulls are back in charge with a vengeance. It’s a classic sign that buyers saw the dip as a discount and jumped in hard. As always, context is king.
What Is the Difference Between an Engulfing Pattern and an Outside Bar?
You'll often hear these terms used interchangeably, but there's a small technical distinction that chart purists and some platforms care about. The core idea is the same: one candle’s range completely dwarfs the previous one.
-
Engulfing Pattern: This is all about the real bodies. For a bullish engulfing pattern, the body of the second (green) candle must completely cover the body of the first (red) one. The wicks don't matter as much.
-
Outside Bar (or Outside Day): This is a broader term. Here, the entire price range of the second candle—from its high to its low, including the wicks—must completely contain the prior candle's entire range.
In the real world, many engulfing patterns are also outside bars, and the trading psychology is virtually identical. The classic engulfing definition just puts a special emphasis on the battle between the open and close prices, which the real body represents.
Ready to stop searching for patterns and start finding them? ChartsWatcher provides an advanced scanning platform that can automatically detect engulfing candlestick patterns across thousands of stocks in real-time. Customize your screens, set precise alerts, and let our tools do the heavy lifting so you can focus on making smarter trades. Visit us at https://chartswatcher.com to see how you can upgrade your market analysis today.
