A Trader's Guide to Double Top and Double Bottom Patterns
The double top and double bottom are classic reversal patterns, some of the first ones any serious trader learns to spot. For good reason. They’re reliable, they show up across all markets and timeframes, and they tell a clear story about a potential shift in momentum.
Think of them visually: a double top looks like the letter 'M' and signals a potential end to an uptrend. A double bottom forms a 'W' shape, suggesting a downtrend might be losing steam and ready to reverse.
Decoding the Market's Story
To really trade these patterns well, you have to look past the simple M and W shapes. What you're actually seeing is a visual record of a fight between buyers and sellers. These patterns don't just happen; they form because the market is testing a key price level and failing to break through, causing a shift in control.
Understanding this underlying psychology is what separates consistently profitable traders from those who just see shapes on a chart. You're reading the market's narrative.
The Anatomy of a Reversal
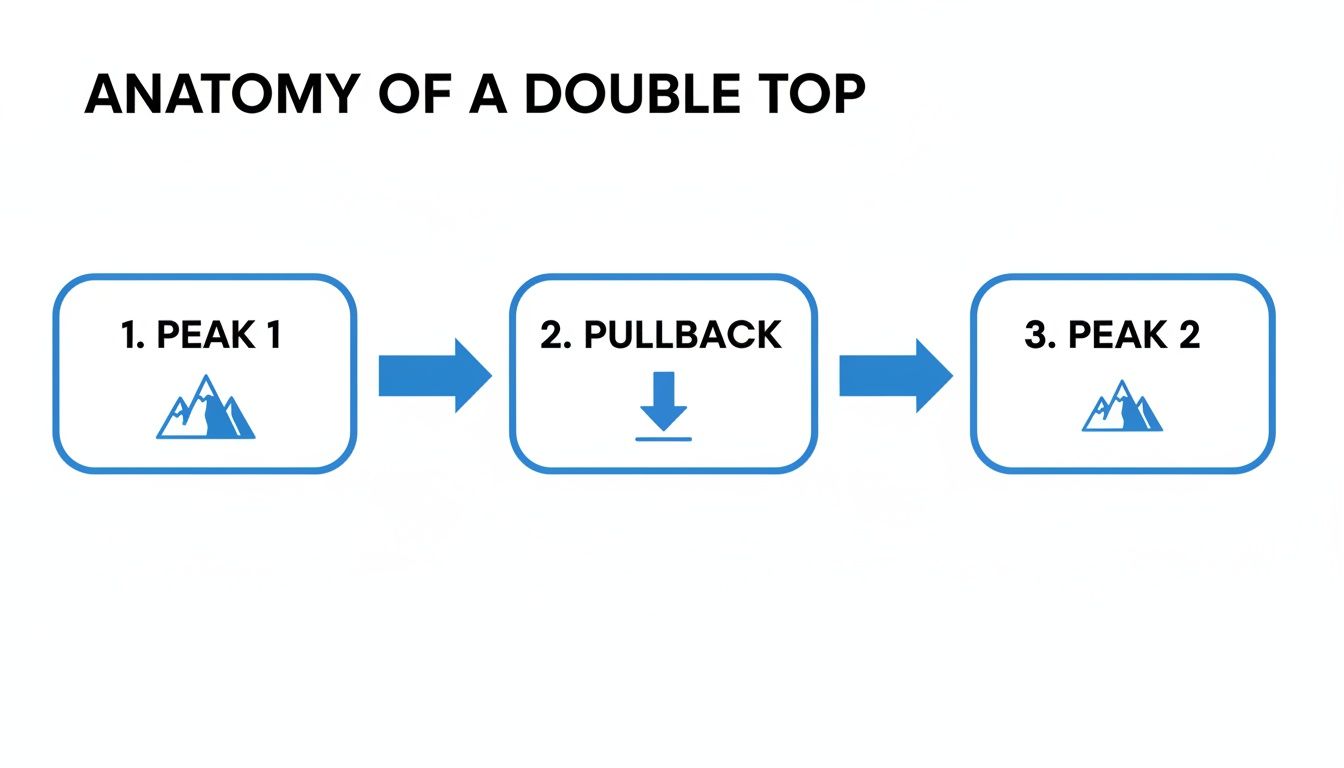
Let's break down a double top. An asset is in a nice, clean uptrend. Buyers are firmly in control, pushing prices higher. Then, they slam into a wall of resistance, forming the first peak. Sellers might step in, or maybe early buyers just decide it's time to take profits. Either way, the price pulls back to a support area, which we call the neckline.
This is where it gets interesting. The bulls try to mount another charge. They push the price back up toward that first peak, but they just don't have the same firepower. The rally stalls out at or near the same resistance level, forming a second peak. That failure is a huge red flag—it tells you the buying pressure is drying up.
The final nail in the coffin is when the price breaks below the neckline. That's your confirmation. Sellers have wrestled back control, and the trend is likely to reverse.
A double bottom is simply the mirror image of this story, showing a bullish comeback after a prolonged downtrend.
Key Takeaway: A double top isn't just two highs; it's a failed attempt to make a new high. A double bottom isn't just two lows; it's a failed attempt to make a new low. This failure is the core of the reversal signal.
To help you distinguish a true pattern from random noise, here is a quick cheat sheet comparing the key characteristics of each.
Double Top vs Double Bottom Key Characteristics
| Characteristic | Double Top (Bearish 'M') | Double Bottom (Bullish 'W') |
|---|---|---|
| Prior Trend | A clear uptrend | A clear downtrend |
| Shape | Resembles the letter 'M' | Resembles the letter 'W' |
| Signal | Bearish Reversal | Bullish Reversal |
| Confirmation | Price breaks below the neckline | Price breaks above the neckline |
| Psychology | Buying momentum is exhausted | Selling pressure is exhausted |
This table provides a great snapshot, but let's quickly go over the individual components that give these patterns their structure and meaning. Getting these right is crucial for confirmation.
- Prior Trend: This is non-negotiable. A double top has to form after an uptrend. A double bottom must come after a downtrend. Without that context, the pattern is meaningless.
- First Peak/Trough: This sets the stage. It's the initial high-water mark for the bulls (in a double top) or the low point for the bears (in a double bottom) that the market is about to re-test.
- Intermediate Pullback: The bounce or drop from that first peak/trough is what forms the neckline. The size of this pullback can sometimes give you a clue about how strong the opposing side is.
- Second Peak/Trough: This is the moment of truth. The failure to push past the first peak or below the first trough is the signal that the prevailing trend is running out of gas.
- Neckline Break: This is your trigger. A solid, convincing break of the neckline validates the entire pattern. For many traders, this is the primary signal to enter a trade.
By internalizing these components, you're not just spotting a pattern—you're reading the tape and understanding the story the market is telling you. This deeper comprehension is absolutely essential before you can start building a strategy around identifying and trading these powerful setups.
How to Identify High-Probability Setups
Spotting a potential double top or double bottom is just the start. Let's be honest, you'll see M- and W-shaped squiggles all over your charts, but most of them are just market noise. The real skill is learning how to filter out the junk and focus only on the A-grade setups.
This means looking past the basic shape and digging into the details that give the pattern its predictive power. The relationship between the two peaks (or troughs), the depth of the pullback, and the time it takes for the pattern to form are all critical clues. A weak, rushed, or sloppy structure is a classic recipe for a false signal that traps eager traders.
This is what a textbook double top should look like as it forms, from the first peak to that all-important neckline break.
You can see the story playing out visually: buying pressure gets exhausted as the second peak fails to push higher, setting the stage for a reversal. Understanding this sequence is the key to getting in front of the move.
Fine-Tuning Your Pattern Recognition
To separate the high-probability patterns from the mediocre ones, you need to get picky about the geometry. For a double top, the two peaks should form at roughly the same price level. In fact, a slightly lower second peak can be an even stronger sign of weakness. For a double bottom, a slightly higher second trough can signal that sellers are running out of steam.
Here are a couple of key criteria I always look for:
- Time Separation: The two peaks or troughs need some breathing room. Patterns that form over several weeks or even months are far more reliable than those that pop up in a few days. That extra time shows a real, prolonged battle between buyers and sellers.
- Pullback Depth: The pullback between the two highs or lows has to be significant. A retracement of 10% to 20% of the prior trend is a good rule of thumb. If the pullback is too shallow, it suggests the trend still has plenty of momentum, and a reversal is less likely.
Pro Tip: If you see a pattern where the second peak punches significantly higher than the first (or the second trough drops far below the first), walk away. Those aren't true double tops or bottoms and are more likely to be trend continuation patterns.
The Decisive Role of Volume
Volume is your truth detector. Price action tells you what is happening, but volume tells you the conviction behind the move. Ignoring volume is like trying to read a book with half the pages missing.
For a classic double top, here’s the volume signature you want to see:
- First Peak: Volume is usually high. This makes sense, as it’s the climax of the current uptrend.
- Second Peak: Volume should be noticeably lower than on the first peak. This is a huge red flag. It shows fading enthusiasm and tells you fewer traders are willing to buy at that high price.
- Neckline Break: As the price slices through the neckline, you should see a surge in volume. This is your confirmation that sellers have seized control and are piling in.
The same logic applies in reverse for a double bottom: high volume on the first trough (panic selling), lower volume on the second (seller exhaustion), and a big expansion in volume on the breakout above the neckline.
Don't just take my word for it. In a detailed study of 454 double top patterns, researchers found they successfully marked a reversal about 75% of the time. Better yet, those reversals led to an average price decline of 20%. You can dig into the full performance statistics over at Quantified Strategies.
This just goes to show how powerful these patterns can be when you wait for the right signals. By combining strict pattern criteria with a close eye on volume, you dramatically stack the odds in your favor.
A Practical Framework for Trading These Patterns
Spotting a clean double top or double bottom setup is a great start, but it's only half the battle. If you want to turn that chart pattern into actual profits, you need a repeatable game plan. This means having crystal-clear, non-negotiable rules for your entry, stop-loss, and profit targets before you ever put a single dollar on the line.

A solid framework is what separates disciplined trading from emotional gambling. It takes the guesswork and stress out of the equation and turns your trading into a process-driven business. Let's build out that process right now.
Pinpointing Your Entry Trigger
The single biggest mistake I see traders make is jumping the gun. They see that second peak or trough start to form, get a shot of adrenaline, and enter the trade early to "get a better price." More often than not, this is a recipe for getting stopped out in a fake-out as the original trend plows right on through.
Your most reliable entry signal is a confirmed break of the neckline.
- For a Double Top: Wait for a candle to close decisively below the support level of the neckline. This is your green light to go short.
- For a Double Bottom: Wait for a candle to close decisively above the resistance level of the neckline. This is your confirmation to go long.
Yes, waiting for this confirmation means you'll miss the absolute tippy-top or bottom of the move. And that's okay. Your job isn't to be a hero; it's to enter trades that have the highest probability of working out. The neckline break is your proof that the market's momentum has truly shifted in your favor.
A patient trader waits for the market to prove their thesis right. An impulsive trader tries to prove the market wrong. The neckline break is your proof.
Setting a Logical Stop-Loss
Think of your stop-loss as your safety net. It’s the line in the sand that defines your maximum acceptable loss and protects your capital from a catastrophic hit. For these patterns, stop-loss placement is refreshingly straightforward because it’s tied directly to the pattern's own structure.
The rule is simple: place your stop just beyond the pattern's extreme point.
- When shorting a Double Top: Your stop-loss goes just above the higher of the two peaks. If the price breaks this level, the pattern is invalid, and your bearish thesis is wrong.
- When going long on a Double Bottom: Your stop-loss goes just below the lower of the two troughs. A new low here signals the downtrend is still in control, invalidating the pattern.
This method works so well because it's based on pure market structure, not some random percentage or dollar amount. If your stop gets hit, it means the pattern has officially failed, and you can get out with a small, manageable loss.
Defining Your Profit Targets
Knowing when to take your profits is just as critical as knowing when to enter. A fantastic entry can easily turn into a losing trade if you don't have a clear exit strategy. Thankfully, the double top and bottom patterns come with a classic, built-in technique for projecting a price target.
It’s called the measured move.
- Measure the Height: First, calculate the vertical price distance from the pattern's highest peak (for a double top) or lowest trough (for a double bottom) down to the neckline.
- Project from the Breakout: Next, take that same distance and project it downward or upward from the point where the price broke through the neckline. This gives you a logical minimum price target.
Let’s say a stock forms a double top with peaks around $100 and a neckline at $95. The pattern's height is $5. Once the price breaks and closes below $95, your projected target would be $90 ($95 - $5). It's that simple.
While the measured move is an excellent starting point, savvy traders also scan the chart for any potential roadblocks. Look for major pre-existing support or resistance levels that might sit between your entry and your target. These areas can be smart places to take some profits off the table or tighten up your stop-loss.
Double bottom patterns, in particular, pack a powerful reversal punch. Studies show that when these W-shaped patterns form over several weeks or months, their reliability ticks up significantly. Pay close attention to volume: high volume on the first low signals panic, lower volume on the second suggests seller exhaustion, and a big volume surge on the neckline breakout confirms that buyers are in control. Historically, successful double bottom breakouts in U.S. equities have produced average gains of 20-30%. You can dig into more performance data on these bullish setups and find valuable insights on double tops and bottoms at Bapital.
Using Scanners to Automate Pattern Discovery
Let's be honest, manually clicking through hundreds of charts is a recipe for burnout. You'll miss good setups and your eyes will glaze over. In today's market, you have to work smarter, not harder. Instead of hunting for the perfect double top and double bottom setup, a good scanner brings the best candidates directly to you. This lets you save your mental energy for what actually matters: analyzing high-probability trades.
The real power of a scanner is its precision. You’re not just looking for a vague "M" or "W" shape; you're telling the software to find patterns that meet the exact criteria you’ve found to be profitable. This shifts your trading from a gut-feel, artistic approach to a systematic, data-driven one.

This is how the pros do it. They use technology to cut through the market noise and only pay attention to what's truly relevant to their strategy.
Configuring Your Custom Pattern Screen
Building an effective screen means you have to translate what a "good" pattern looks like into a set of quantifiable rules for the software. Think of it like giving a detailed recipe to a chef. A robust platform like ChartsWatcher lets you define these parameters with incredible detail, so you only get alerts for setups that actually fit your trading plan.
Here are the core parameters I always start with for a double top or double bottom scan:
- Pattern Duration: This is the time between the two peaks or troughs. A good starting range is 20 to 60 trading days. This helps find patterns that represent a real, significant battle between buyers and sellers, not just minor noise.
- Price Proximity: You need to set how close the two highs (for a top) or two lows (for a bottom) have to be. I find a variance of 3% or less works best to make sure the price is testing a consistent, meaningful level.
- Pullback Depth: Define how deep the valley needs to be in a double top, or how high the peak needs to be in a double bottom. I look for a pullback of at least 10% to filter out insignificant wiggles and focus on legitimate reversal attempts.
These settings are your first line of defense. They immediately filter out the junk—the patterns that are too short, too sloppy, or too shallow—and dramatically improve the quality of the trade ideas hitting your screen.
Adding Volume and Breakout Filters
A pretty chart pattern is one thing, but confirmation is what gets you paid. This is where you can add another layer of intelligence to your scanner by incorporating rules based on volume and the price action around the neckline.
Try adding these more advanced filters to your screen:
- Declining Volume on the Second Peak/Trough: A classic sign of exhaustion. For a double top, if the volume on the second peak is lower than the first, it's a huge tell that buyers are losing steam. Advanced scanners can check for this.
- Breakout Volume Surge: This is non-negotiable for me. Set an alert for when the price breaks the neckline on volume that is at least 150% of the 20-day average. This surge confirms that institutions are behind the move, giving it much higher odds of follow-through.
- Proximity to Neckline: I like to have a separate "watchlist" scan that finds patterns that are fully formed but are still hovering within 1-2% of the neckline. This lets me catch potential breakouts right as they're about to trigger.
By combining the geometric pattern rules with volume confirmation, you build a powerful discovery engine that works for you 24/7. It's about letting the machine do the heavy lifting so you can focus on execution and managing risk.
Automating your search is a massive step toward becoming a more disciplined trader. For those who want to go even deeper, it's worth exploring the concepts behind leveraging predictive analysis and machine learning to spot leading indicators within these formations. And if you're serious about building powerful screens, our in-depth guide shows you exactly how to master real-time stock scanning.
Validating Your Strategy with Backtesting
Any trading idea, no matter how good it sounds on paper, is just a theory until you prove it with hard data. This is where backtesting comes in. It’s the process of taking your specific trading rules and running them against historical price action to see how they would have actually performed.
Think of it as your strategy’s trial by fire. Before you risk a single dollar of real money, backtesting is the essential step that moves you from simply recognizing shapes to truly understanding their statistical behavior.
For a strategy built on double top and double bottom patterns, a solid backtest answers the questions that really matter: How often does this setup actually work out? What's the average profit compared to the average loss? This process transforms your confidence from a hopeful guess into a data-backed belief.
Setting Up Your Backtest Environment
First things first, you have to define your universe. You can't just test "the market." You need to decide which markets, assets, and timeframes you want to focus on. A backtest on daily charts for large-cap stocks will give you wildly different results than one on a 15-minute chart for forex pairs.
A platform like ChartsWatcher lets you dial in these parameters with precision, ensuring your test is relevant to how you actually plan to trade.
- Define Your Instruments: Are you trading stocks, ETFs, or currency pairs? Select the specific tickers you want to include.
- Set the Timeframe: Choose the chart interval that matches your strategy, whether that’s daily, 4-hour, or 1-hour.
- Establish the Test Period: Pick a historical date range. You'll want a period of several years that covers different market conditions—bull, bear, and sideways—to get the most robust results.
Once your environment is ready, it’s time to codify the exact rules of your strategy. This has to be done with zero ambiguity. A computer can't interpret "it looks about right."
A backtest is only as good as the rules you give it. Vague criteria lead to useless results. Be brutally specific about every detail of your entry, exit, and risk management plan.
Defining Precise Trading Rules
This is the heart of your backtest. You have to translate the visual pattern into concrete, measurable criteria that software can understand. For a double top strategy, your rules might look something like this:
- Entry Signal: Price closes below the neckline after forming two peaks within 3% of each other’s price, separated by at least 20 candles.
- Stop-Loss Placement: Set the initial stop-loss 1% above the highest peak of the pattern.
- Profit Target: The primary profit target is the measured move (the pattern’s height projected down from the neckline break).
With these rules programmed, the software can churn through years of historical data in seconds, applying your logic to every single time a potential double top or double bottom appeared. For a deeper dive into this process, check out our complete playbook on how to backtest a trading strategy.
Interpreting the Performance Metrics
After the test runs, you’ll get a report packed with performance statistics. This is where you find out the true character of your strategy. Don't just glance at the total profit; the devil is always in the details.
Here are the key metrics to focus on:
- Win Rate: What percentage of trades were profitable? For reversal strategies, a win rate of 50-60% is often quite good.
- Profit Factor: This is your gross profit divided by your gross loss. A number above 1.5 is generally considered healthy, as it shows your winning trades are significantly larger than your losing ones.
- Maximum Drawdown: This shows the largest peak-to-trough decline your account would have experienced. It’s a crucial measure of risk and tells you how much pain you would have had to endure to stick with the strategy.
- Average Trade P/L: What was the average profit on winners versus the average loss on losers? This gives you a real-world look at your risk-to-reward ratio.
Analyzing these numbers gives you an objective view of your strategy's strengths and weaknesses. Maybe you find out your win rate is lower than you'd like, but your profit factor is huge. That tells you that while you don't win all the time, your wins are large enough to make the strategy profitable over the long haul. This is how you build a trading plan based on evidence, not emotion.
Where Good Setups Go to Die: Common Trading Mistakes
Even with a textbook setup, a reliable pattern, and a solid backtest, one simple mistake can wipe out all your careful analysis. When you're trading double tops and double bottoms, your long-term success often comes down to how you handle the trades that don't work out, not just the winners. Understanding the common traps is the first step to building the discipline you need to stay in the game.
So many traders, absolutely terrified of missing the move, will jump the gun. They see that second peak or trough forming and dive in headfirst, long before the neckline has even been challenged. This is probably the single most expensive mistake you can make with this pattern.
Entering before a confirmed break isn't trading; it's gambling. You're betting on what you think is about to happen instead of reacting to what the market is actually telling you. That neckline is the market's line in the sand. A clean, decisive close beyond that level is your proof that the balance of power has shifted. By waiting, you might give up a few ticks on your entry, but you gain a massive edge in probability. It’s a trade-off the pros make without hesitation.
The Treacherous "Busted" Pattern
One of the most infuriating things you'll experience is the "busted" or "failed" pattern. This is when the price breaks the neckline, triggers your entry, and then violently reverses, screaming right back into the old trend. It feels like a setup, and in many ways, it is. This is how the market shakes out the weak hands and impatient traders before making its real move.
So, how do you defend against it? You can never completely eliminate this risk, but volume is your best friend here. A genuine, committed breakout should happen on a surge of volume. If you see the price just sort of dribble past the neckline on weak, anemic volume, that's a massive red flag. It often signals a total lack of conviction and a much higher chance of a painful reversal.
Trader's Insight: A breakout without volume is like a car trying to accelerate with an empty gas tank. It might lurch forward for a moment, but it's not going far. Strong volume is the fuel that powers a new trend.
Advanced Risk Management Tactics
Your number one job as a trader is to protect your capital. Period. Once a trade starts working, your mindset has to shift from "how much can I make?" to "how do I protect what I have?" This is where active trade management becomes critical.
A simple but powerful technique is moving your stop-loss to your entry point (break-even) as soon as the trade has moved a meaningful amount in your favor. Let's say you short a double top. Once the price drops by an amount equal to your initial risk (a 1:1 reward-to-risk ratio), slide that stop to your entry price. Just like that, you've taken all the risk off the table. The worst that can happen is a scratch trade, and you've given yourself a free shot at a home run.
Here are a few other common mistakes and how to fix them:
-
Mistake: Using a generic stop-loss, like a fixed 2%.
- Fix: Let the pattern dictate your stop. Place it just above the two peaks for a double top or just below the troughs for a double bottom. This lets the market's own structure tell you when you're wrong, not some arbitrary number.
-
Mistake: Ignoring the bigger picture.
- Fix: A double bottom forming in a raging bear market is a low-probability bet. Always check the context on higher timeframes. Trading with the prevailing trend, not against it, puts the odds in your favor.
-
Mistake: Sizing your position based on gut feeling.
- Fix: Never risk more than 1-2% of your trading capital on any single trade. Proper position sizing is what keeps you in business. It ensures that a string of small losses doesn't knock you out before your edge has a chance to play out over the long run.
By thinking about these errors ahead of time and building a plan to handle them, you're essentially building a fortress around your strategy. It’s this disciplined, defensive approach that separates the traders who last from those who become a market statistic.
Ready to stop hunting for patterns and start analyzing high-probability setups? ChartsWatcher provides the advanced scanning and backtesting tools you need to build a truly systematic trading approach. Find your edge and trade with data-backed confidence. Discover how ChartsWatcher can transform your trading today.
