A Trader's Guide: candlestick patterns engulfing reversals
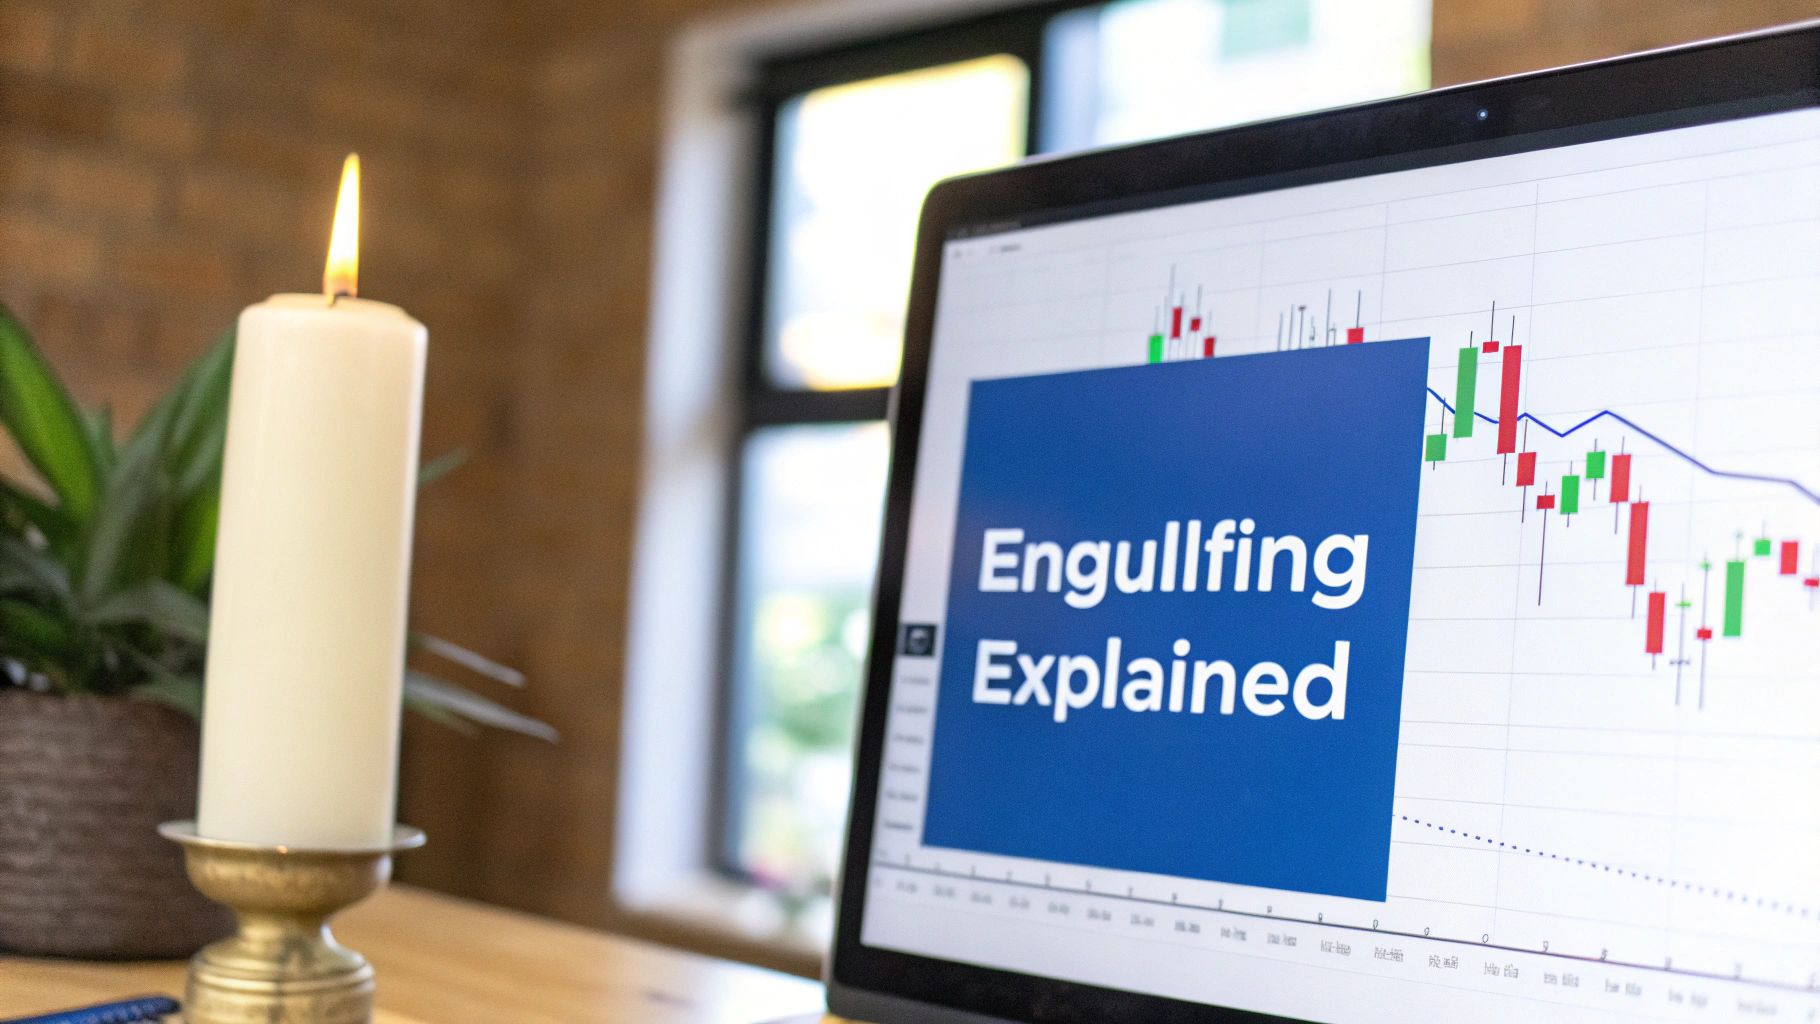
Engulfing patterns are one of the most powerful two-candle reversal signals you'll find on a price chart. The setup is simple: a large second candle completely swallows, or "engulfs," the body of the smaller candle right before it.
This dramatic takeover often signals a strong shift in market momentum. It's a visual cue that either the buyers or sellers have just grabbed the wheel and are ready to steer the price in a new direction.
What Are Engulfing Candlestick Patterns?
Picture a tug-of-war between the bulls (buyers) and bears (sellers). An engulfing pattern is that moment when one side suddenly yanks the rope with overwhelming force, sending the other team stumbling. It’s more than just a shape on a chart; it tells a story of a rapid and decisive change in market psychology.
This pattern is a cornerstone of technical analysis because it’s so easy to spot and often points to the end of a trend. If you're new to charting, our guide to understanding candlestick graphs is a great place to build your foundation before diving deeper.
The Core Idea Behind Engulfing Patterns
At its heart, the engulfing pattern shows a fierce struggle where one side achieves total domination. The first candle represents the old guard—the established market sentiment. The second, much larger candle is the aggressive counter-attack that completely overwhelms the previous period's price action.
This forceful takeover is what gives the pattern its predictive punch. The bigger the second candle is, the more significant the momentum shift, and the stronger the potential reversal signal.
An engulfing pattern is a clear visual representation of a power shift. When you see one, it means the market’s previous momentum has not just been stopped—it has been completely reversed within a single period.
Key Characteristics to Identify
To be sure you're looking at a true engulfing pattern and not just a random fluctuation, it needs to meet a few specific criteria. Getting these details right helps you filter out the weak signals from the high-probability setups.
- A Clear Preceding Trend: Engulfing patterns are all about reversals, so they need something to reverse. Look for them at the end of a clear uptrend or downtrend.
- Two Contrasting Candles: The pattern always involves two candles of opposite colors. The first candle's color should follow the direction of the trend (e.g., a red candle in a downtrend).
- The Engulfing Body: This is the most important part. The body of the second candle must completely cover the entire body of the first candle. Whether it covers the wicks (shadows) doesn't matter as much, but the body-to-body engulf is non-negotiable.
For a quick reference, here’s a simple table breaking down the two main types we'll explore next.
Bullish vs Bearish Engulfing Patterns at a Glance
This table offers a snapshot of the key differences between the bullish and bearish versions of this pattern. Think of it as your cheat sheet for quick identification on a live chart.
| Characteristic | Bullish Engulfing | Bearish Engulfing |
|---|---|---|
| Location | Appears at the bottom of a downtrend | Appears at the top of an uptrend |
| First Candle | Small bearish (red) candle | Small bullish (green) candle |
| Second Candle | Large bullish (green) candle | Large bearish (red) candle |
| What it Signals | Potential upward reversal (bulls take control) | Potential downward reversal (bears take control) |
Understanding these distinctions is the first step. Now, let's dive into the specifics of both the Bullish and Bearish Engulfing patterns to see how you can use them in your trading strategy.
How to Read the Bullish Engulfing Pattern
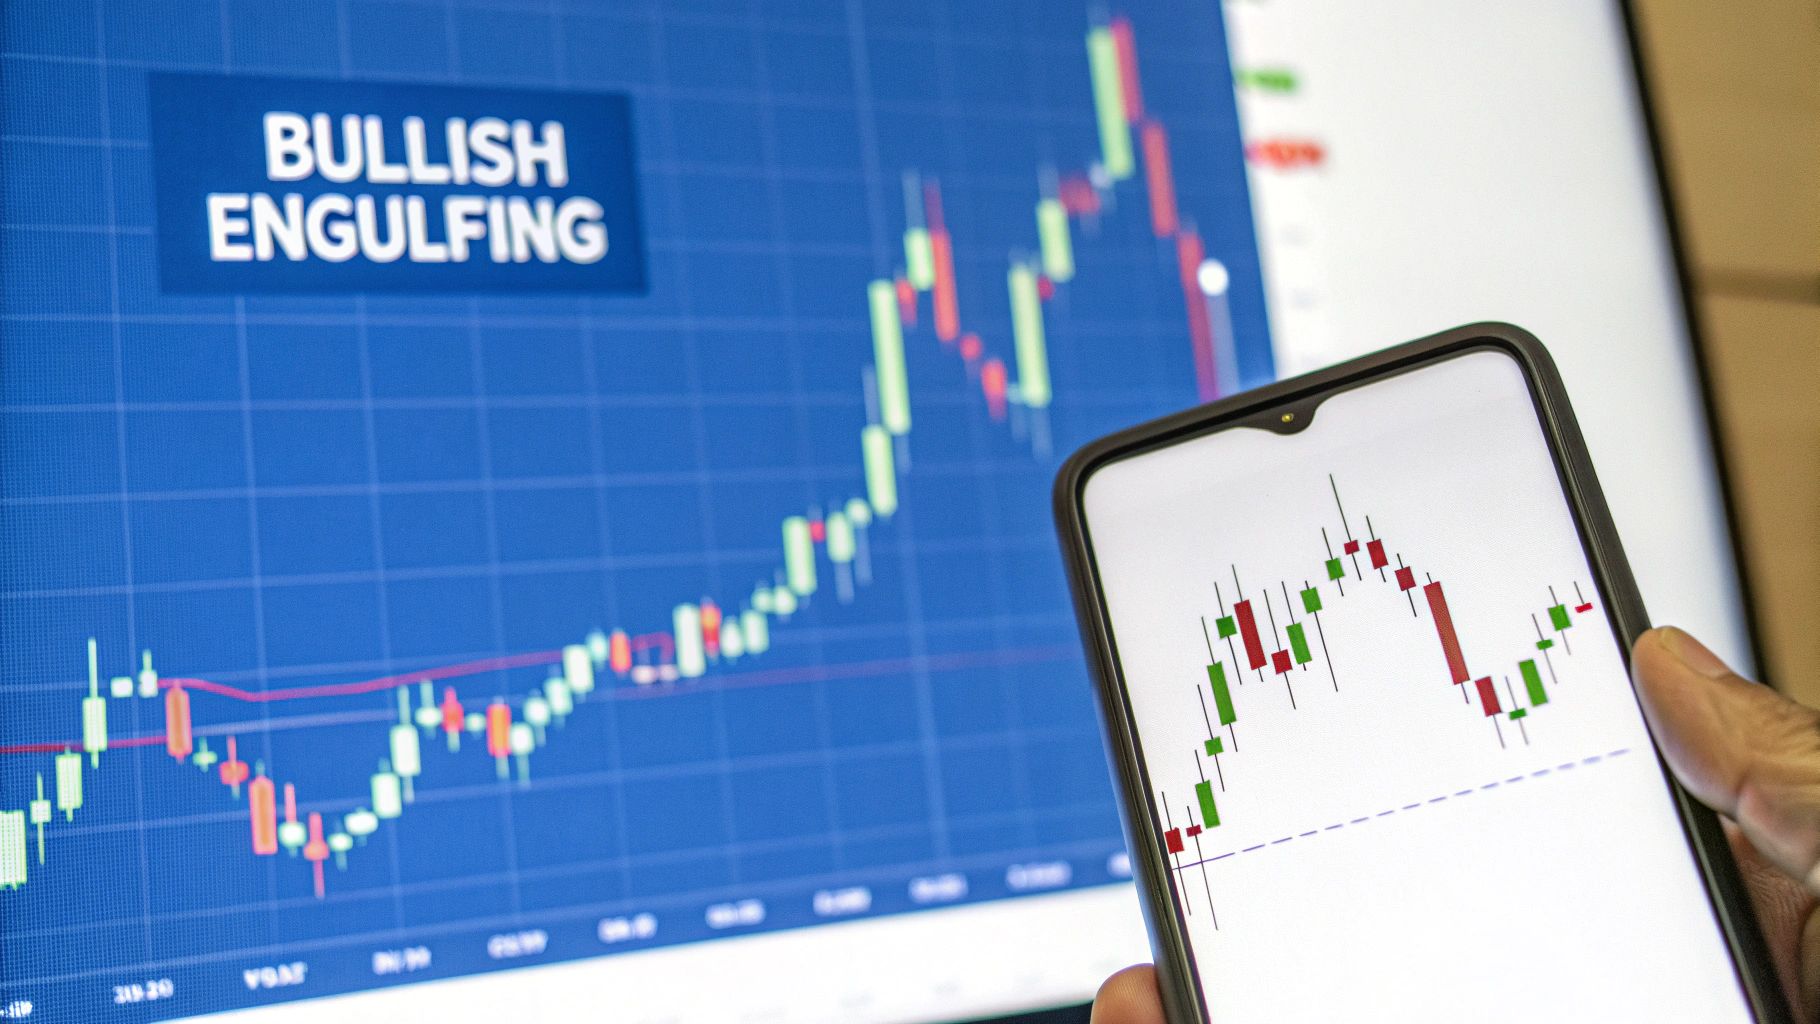
The bullish engulfing pattern is one of those classic chart signals that tells a vivid story about a shift in market power. Picture this: sellers have been in the driver's seat, methodically pushing prices lower. Then, in a single session, the buyers don't just put up a fight—they storm the castle and completely erase the previous day's losses.
This isn't just a small bounce. It's a visual cue that the bulls have staged a takeover. The pattern is made up of two specific candles that, when they appear together, can signal that a downtrend is running out of steam.
The Anatomy of the Pattern
To be confident you're looking at a true bullish engulfing pattern, you need to check off a few specific criteria. Think of it as a quick diagnostic to filter out the market noise from a genuine signal.
- Established Downtrend: First and foremost, the pattern needs a trend to reverse. It must show up after a clear period of falling prices.
- The First Candle: The pattern begins with a small bearish (red) candle. This shows the downtrend is still technically in play, but the selling momentum might be fading.
- The Second Candle: This is where the magic happens. A large bullish (green) candle opens at or even below the prior candle's close, then rallies to close well above its open. It completely "engulfs" the body of the first candle.
That second candle is the hero of the story. Its sheer size shows a massive wave of buying pressure that not only soaked up all the selling from the day before but also had enough force to drive the price significantly higher.
The larger the green candle is compared to the red one it swallows, the more powerful the reversal signal. It tells you that buyers have seized control with overwhelming force, putting a new floor under the price.
Confirming the Signal with Volume
While the pattern itself is a strong hint, layering in other data can give you much more conviction. One of the best wingmen for a candlestick pattern is trading volume.
A big spike in volume on the day of the bullish engulfing candle is a fantastic sign. It shows that the aggressive buying is backed by a lot of participation from other traders, adding weight and validity to the reversal. If the volume is low, the move might just be a blip without real conviction behind it.
In fact, one study analyzing large-cap stocks from 2017 to 2023 found that while the pattern provided a decent immediate pop, its real predictive power came into play over the next week. The analysis showed a five-day win rate of 71%, suggesting the signal often kicks off a more sustained recovery. You can dig into the full study on the pattern's statistical validity on IJISRT.com.
The Importance of Location
Finally, where the bullish engulfing pattern shows up on the chart is just as critical as the pattern itself. It's far more reliable when it forms at a known support level.
Think of these key areas:
- Previous Lows: A price level where buyers have stepped in before.
- Key Trendlines: An upward-sloping line that has previously acted as a floor for the price.
- Moving Averages: Major indicators like the 200-day moving average, which often act as dynamic support.
When a bullish engulfing pattern appears at one of these key levels, it’s like the market is shouting that the downtrend has hit a wall. You have a powerful reversal signal forming at the exact spot where you'd expect buyers to show up. This confluence of signals is what creates a high-probability trading setup.
While the bullish engulfing pattern can signal a market bottom, its evil twin—the bearish engulfing pattern—serves as a powerful warning shot at the top of an uptrend.
Picture this: the bulls are having a great run, pushing prices higher and higher. The party is in full swing. Then, out of nowhere, the bears not only crash the party but completely take over. That dramatic shift in sentiment is exactly what a bearish engulfing pattern captures on a chart.
This pattern signals an abrupt end to buyer optimism as overwhelming selling pressure floods the market. It’s a crystal-clear visual that the momentum has flipped, and sellers have just seized control with decisive force. Spotting this can give you a heads-up that a rally is running out of gas and a reversal might be just around the corner.
Key Components of a Bearish Reversal
Just like its bullish cousin, the bearish engulfing pattern has a specific anatomy. You have to know these features to tell a real reversal signal apart from just random market noise. For the pattern to be valid, it needs to check these boxes:
- A Clear Uptrend Exists: It’s a reversal pattern, which means it has to show up after a solid run of rising prices. If there’s no uptrend to reverse, the pattern doesn’t mean much.
- A Small Bullish Candle: The first candle is a small green one, showing buyers are still in the game, but maybe they're losing some of their earlier conviction.
- An Aggressive Bearish Candle: The second candle is a big, intimidating red candle. It opens at or even above the previous candle's close and then slams down, closing well below its open. Its body must completely "engulf" the body of the little green candle before it.
This formation is the textbook definition of a failed rally. Buyers make one last push, but sellers step in with so much force that they not only stop the advance but completely wipe out all the gains from the previous session.
Reading the Market Psychology
The story this pattern tells is one of sudden and complete capitulation by the bulls. That initial small green candle represents the last gasp of buying pressure. Then, the massive red candle shows that sellers have absorbed all that buying demand—and then some—creating a powerful wave of supply that drives the price down hard.
The most potent bearish engulfing patterns pop up near significant resistance levels, like a previous high or a major moving average. When the market smacks down hard against a known obstacle, it adds another layer of confirmation to the bearish signal. For traders looking to go short, this can be a high-probability setup.
But here’s a reality check: not all candlestick patterns work like they do in the textbooks. An extensive analysis using 50 years of weekly S&P 500 data revealed that the bearish engulfing pattern didn't reliably predict weakness. In fact, a week after the pattern appeared, the market was actually slightly positive 67.4% of the time. You can dig into the full data-driven insights on this market myth to see why context is so critical.
This highlights a golden rule of trading: never trade any single pattern in isolation, including candlestick patterns engulfing an uptrend. Always look for extra confirmation from other indicators or price action before you pull the trigger.
Trading Strategies for Engulfing Patterns
Spotting an engulfing pattern is a great start, but it's just the first piece of the puzzle. The real skill is turning that observation into a disciplined trade. You can't just jump in every time you see one. To make it a repeatable process, you need a solid plan with clear rules for entry, exit, and—most importantly—risk management.
A common entry trigger for a bullish engulfing pattern is to wait for confirmation. Place a buy order just a tick above the high of that big green candle. This ensures the initial bullish push has some follow-through. For a bearish engulfing pattern, you do the opposite: trigger a short entry when the price breaks below the low of the big red candle, confirming that sellers are still in control.
This infographic breaks down the thought process for identifying a bearish engulfing setup.
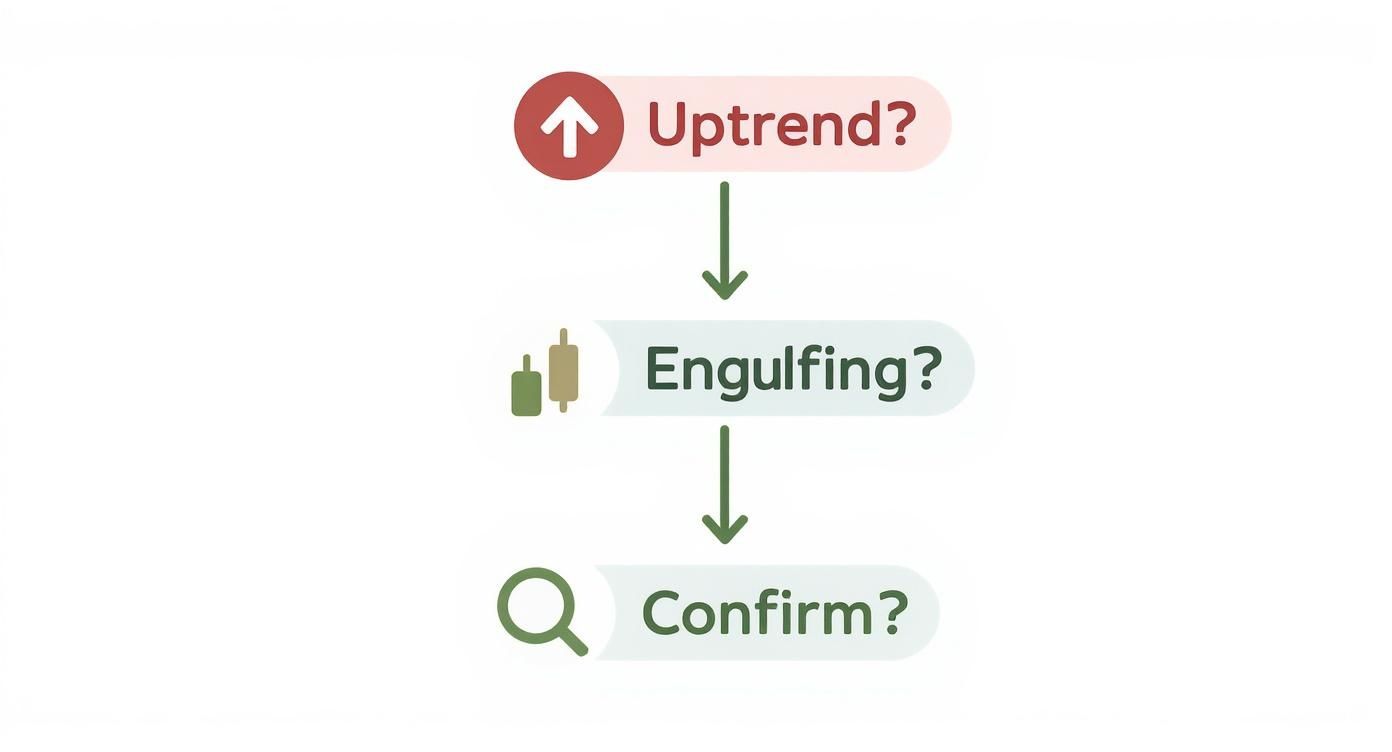
As the visual guide shows, it's crucial to confirm the pattern appears within an established uptrend before even thinking about a trade.
Managing Risk and Setting Targets
Let's be clear: effective risk management is non-negotiable. For a bullish setup, a logical spot for your stop-loss order is just below the low of the engulfing candle. If the price drops to that level, the whole reversal idea is pretty much toast. For a bearish trade, the stop-loss goes just above the high of the engulfing candle for the same reason.
When it comes to taking profits, you have a few options:
- Previous Structure: The simplest method. Aim for the nearest significant resistance level on a bullish trade or the closest support on a bearish one.
- Risk-to-Reward Ratio: A classic approach is to target a profit at least twice what you're risking (a 2:1 ratio). If your stop-loss is 50 pips away, your take-profit should be 100 pips away. Easy math.
Never trade candlestick patterns engulfing prior price action in isolation. A pattern without context is just a shape. True trading power comes from combining it with other confirming signals.
Using Indicators for Confirmation
To really stack the odds in your favor, you need to seek confirmation from other technical indicators. Relying on a single pattern alone is a fast track to getting chopped up by false signals.
Think of indicators as a second opinion, validating the story the engulfing pattern is telling you. Two of the best tools for the job are the Relative Strength Index (RSI) and moving averages.
Confirmation Checklist
- RSI Divergence: A bullish engulfing pattern gets a massive boost if the RSI is showing bullish divergence (meaning the price is making a lower low, but the RSI is making a higher low).
- Moving Averages: Did the bullish engulfing pattern form right at or bounce cleanly off a key moving average, like the 50-day or 200-day? This adds a strong layer of dynamic support to your signal.
- Volume Spike: A big jump in trading volume on the day of the engulfing candle shows conviction. It tells you a lot of traders are piling into the move, giving it more weight.
By layering these techniques, you start filtering out the weak, questionable setups and can focus on the high-probability opportunities. This disciplined, multi-faceted approach is what separates consistent traders from gamblers. To gain deeper insights into trading strategies and market analysis beyond this guide, you may find valuable articles when you explore additional trading strategies and insights.
Automating Your Engulfing Pattern Strategy
Let's be honest: manually hunting for candlestick patterns across dozens of charts is a grind. It’s not just time-consuming; it’s a recipe for mistakes, missed signals, and emotional decisions.
The real leap forward comes when you shift from just spotting patterns to building a systematic, automated strategy around them. Automation is what lets you trade with data-driven precision, taking the guesswork and emotion out of the picture. Most importantly, it ensures you're always ready when a valid setup appears.
The first step is learning to think like a machine. You have to translate the visual "look" of an engulfing pattern into a set of strict, programmable rules. What does a "small" first candle or a "large" second one really mean in numbers? For example, you might decide the second candle's body must be at least 150% the size of the first. Now you have a concrete, testable rule.
Building Your Automated Ruleset
To create a strategy that a machine can follow, you need to define the entire lifecycle of a trade, not just the pattern itself. It's about turning a visual cue into a complete, logical system. Before you dive in, it helps to understand what AI automation entails and how these systems operate.
Your ruleset needs to cover these bases:
- Pattern Definition: Nail down the exact criteria for a bullish or bearish engulfing pattern. How big does the second candle need to be relative to the first?
- Entry Trigger: What’s the precise event that gets you into a trade? A common one is waiting for the price to break above the high of a bullish engulfing candle.
- Stop-Loss Placement: Program your exit plan for when a trade goes wrong. This could be a fixed stop placed just below the low of the engulfing formation. No second-guessing.
- Profit Target: How do you get out when you're right? Establish a clear rule, like a fixed risk-to-reward ratio of 2:1 or an exit at a major resistance level.
Backtesting and Real-Time Alerts
Once your rules are set in stone, it's time for the most critical phase: backtesting. This is where you run your automated strategy against years of historical market data to see how it would have actually performed. Platforms like ChartsWatcher are built specifically for this, letting you test your engulfing pattern strategy without putting a single dollar at risk.
Backtesting is your strategy’s flight simulator. It lets you crash-test your ideas against years of market data, revealing strengths and weaknesses before you ever put money on the line. This data-driven feedback loop is essential for refining your approach.
Here’s a look at how you can set up alerts in ChartsWatcher. This is how the system can watch the markets for you and ping you the moment a potential trade pops up.
This screenshot shows the alert configuration panel, where you can set up notifications for your specific patterns and conditions. The backtest results will give you the hard numbers—win rate, average profit, maximum drawdown—painting a clear picture of your strategy's viability.
If you're ready to go deeper, our guide offers a proven blueprint to automate your trading strategy.
Of course, here is the rewritten section with a more natural, human-expert tone.
Common Mistakes That Can Derail an Engulfing Pattern Trade
Engulfing patterns can feel like a high-probability setup, but they’re far from foolproof. In my experience, traders often stumble into a few common traps that quickly turn a promising pattern into a painful loss. Let's walk through the big ones so you can sidestep them.
The single biggest error? Ignoring the market context. An engulfing candle popping up in the middle of a sideways, choppy market is usually just noise. It's not a real signal.
These patterns are, by their nature, reversal signals. For something to reverse, it needs a clear trend to push against. A bullish engulfing pattern means nothing without a preceding downtrend, and a bearish engulfing pattern is just as useless without a prior uptrend. Acting on a pattern in a directionless market is a surefire way to get whipsawed back and forth.
Trading on a Single Clue
Another classic mistake is trading the pattern in isolation. You might spot a textbook-perfect engulfing candle, but jumping in based on that alone is a huge gamble. Think of it like a detective trying to solve a case with only one piece of evidence—it’s just not enough to build a strong conviction.
You need to look for other clues that support your theory. Always hunt for confirming factors to stack the odds in your favor:
- Volume Spikes: Did trading volume surge on the day of the engulfing candle? A big jump in volume shows real money and conviction are behind the move. It's a huge tell.
- Key Levels: Where did the pattern form? An engulfing candle at a major support or resistance zone is infinitely more powerful than one floating in the middle of nowhere.
- Indicator Signals: Do your other tools agree? Maybe the RSI is showing a bullish divergence, or the price just bounced perfectly off the 50-day moving average. These extra layers of confirmation are what separate high-probability trades from coin flips.
The Problem with Choppy Markets
I can't stress this enough: the predictive power of engulfing patterns absolutely tanks in non-trending, choppy markets. A global study on the bullish engulfing pattern, using data from Taiwan 50 component stocks, found that its reliability plummeted in sideways conditions. It’s a great reminder that context is everything. You can read more about the study's findings here.
A perfectly formed engulfing pattern in the middle of a ranging market is more likely to be a trap than a valid signal. Without a clear trend to reverse, the pattern loses its entire reason for being.
By sidestepping these common pitfalls—trading without a trend, ignoring confirmation, and getting lured into choppy markets—you can dramatically improve your hit rate. It’s all about a disciplined approach that filters out the junk and leaves you with only the A+ setups.
Common Questions About Engulfing Patterns
Even after you get the hang of spotting engulfing patterns, a few practical questions always pop up when you try to apply them in the heat of the moment. Let's tackle some of the most common ones traders ask.
How Reliable Is the Engulfing Candlestick Pattern?
This is the big one, isn't it? The honest answer is: it depends entirely on the context. An engulfing pattern is a powerful clue, but its predictive power skyrockets when other factors back it up.
For example, a bullish engulfing pattern that appears after a long, grinding downtrend is far more significant than one that shows up randomly in choppy, sideways action. Some data even suggests the bearish version can be a bit less reliable on its own.
Think of an engulfing pattern as a loud suggestion, not a guarantee. Its reliability goes through the roof when it forms at a major support or resistance level, is confirmed by a big spike in trading volume, and gets a nod from another indicator like the RSI.
What Is the Best Timeframe for Engulfing Patterns?
You'll spot engulfing patterns on every chart, from the frantic one-minute to the calm weekly. But as a rule of thumb, they carry much more weight on higher timeframes like the 4-hour, daily, or weekly charts.
Why? Because these longer periods filter out a ton of the market "noise" and indecisive chatter. A daily engulfing candle represents an entire day's battle between buyers and sellers, so when one side decisively wins, it means something significant. If you're a day trader using shorter timeframes, just be extra cautious and look for more confirmation before you jump on a signal.
Can Engulfing Patterns Be Used in Any Market?
Absolutely. The beauty of this pattern is that it's rooted in pure market psychology—the timeless tug-of-war between supply and demand. That story plays out the same way everywhere.
You can find and trade engulfing patterns in any market you can pull up on a candlestick chart. This includes:
- Forex: All the major and minor currency pairs.
- Stocks: Individual company shares and big indices like the S&P 500.
- Cryptocurrencies: Digital assets from Bitcoin to the newest altcoin.
- Commodities: Gold, oil, corn—you name it.
No matter the asset, the underlying message of a powerful momentum shift is universal.
Ready to stop hunting for patterns and start automating your edge? With ChartsWatcher, you can build, backtest, and deploy your engulfing pattern strategies with precision. Get real-time alerts and trade with data, not guesswork. Create your free account on chartswatcher.com and take control of your trading today.
