A Professional Trader's Guide to Stock Market Jargon
If you're serious about trading, you have to speak the language. Stock market jargon isn't just slang; it's the specialized vocabulary professionals use to analyze markets, execute trades, and manage risk with speed and precision. This guide is your translator, turning complex terms into actionable insights.
Decoding the Language of Professional Trading

From 'alpha' to 'volatility,' a solid grasp of these concepts is what separates the pros from the amateurs. It leads to faster, more confident decision-making and ensures you're on the same page as other market participants. We'll break down the key terminology you'll encounter, from broad market trends to the nitty-gritty of technical analysis, with practical examples for every entry.
Think of this glossary as your go-to field guide. It's designed to help you cut through the noise of market chatter and get more out of your trading tools. For instance, knowing the jargon is one thing, but seeing it in action is another—like truly understanding Level 2 market data and what it tells you about order flow.
Understanding Market Trends and Sentiment
To get a real feel for the market, you first have to understand its broader movements and the psychology driving them. This is what we mean by "market sentiment"—basically, is the collective mood of investors optimistic or pessimistic? Figuring this out is the first step in building a solid strategy.
When confidence is high and the economy looks good, you'll often hear talk of a Bull Market. This isn't just a day or two of good news; it's a sustained period where prices keep climbing, driven by widespread investor optimism.
On the flip side, you have the much-dreaded Bear Market. This term gets thrown around when a major index, like the S&P 500, drops at least 20% from a recent high. Bear markets aren't just quick dips; historically, they bring an average decline of 38% and tend to stick around for about 14 months, making them a serious test for any trader. You can dig into more of this data on market trends at sifma.org.
Of course, not every downturn is a full-blown bear. A shorter-term price drop of 10% or more from a recent peak is known as a Market Correction. And when the market just moves sideways, not really going up or down, that's called Consolidation—a classic sign of indecision among traders.
Essential Trading Orders and Execution Terms
Getting your orders filled precisely is a make-or-break skill in trading. This section cuts through the jargon surrounding how you actually place a trade, covering everything from the most basic instructions to more advanced order types that give you greater control.
We'll look at the practical differences between a Market Order, Limit Order, and Stop-Loss Order, and crucially, when you should use each one. Getting this right is fundamental to managing your entries, exits, and overall risk.
This decision tree helps visualize the simple criteria defining major market trends.
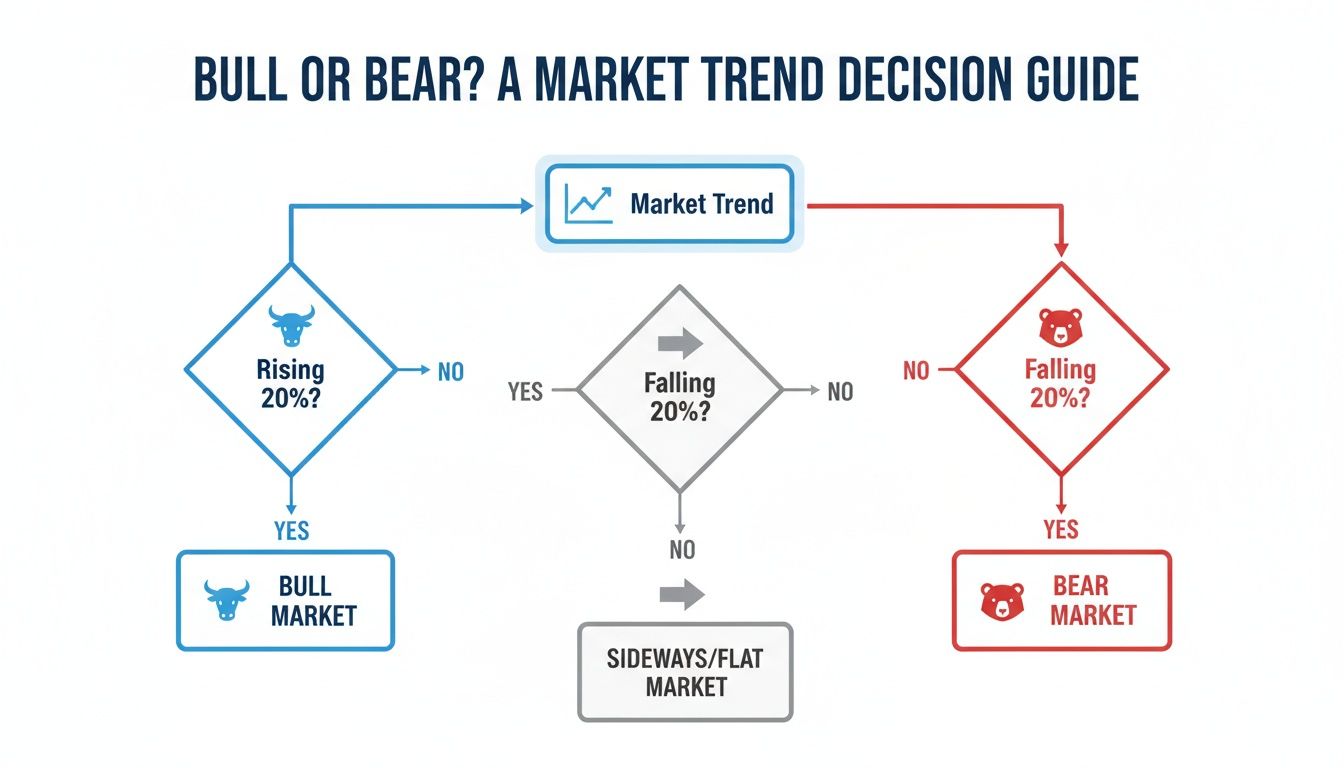
As the flowchart shows, a sustained move of 20% from a recent peak or trough is the classic threshold professionals use to define a new bull or bear market.
Key Terms for Valuation and Fundamental Analysis
When you want to get under the hood of a company and figure out what it's truly worth, you're stepping into the world of fundamental analysis. This isn't about chasing chart patterns; it's about digging into a company's financial health to determine its intrinsic value.
These terms are the core metrics that analysts and serious investors live by. They cut through the market noise and help you decide if a stock is a bargain or just overpriced hype. For instance, Earnings Per Share (EPS) and the Price-to-Earnings (P/E) Ratio are the first stops for seeing if a stock is over or undervalued compared to its actual profits.
Other vital signs include Dividend Yield, which shows you the cash return you're getting as a percentage of the stock's price, and Market Capitalization (or Market Cap), which is simply the total market value of all of the company's shares. To really master this side of trading, you need to learn how to perform a comprehensive fundamental analysis of stocks and create a solid framework for your own investment decisions.
Technical Analysis and Charting Terminology
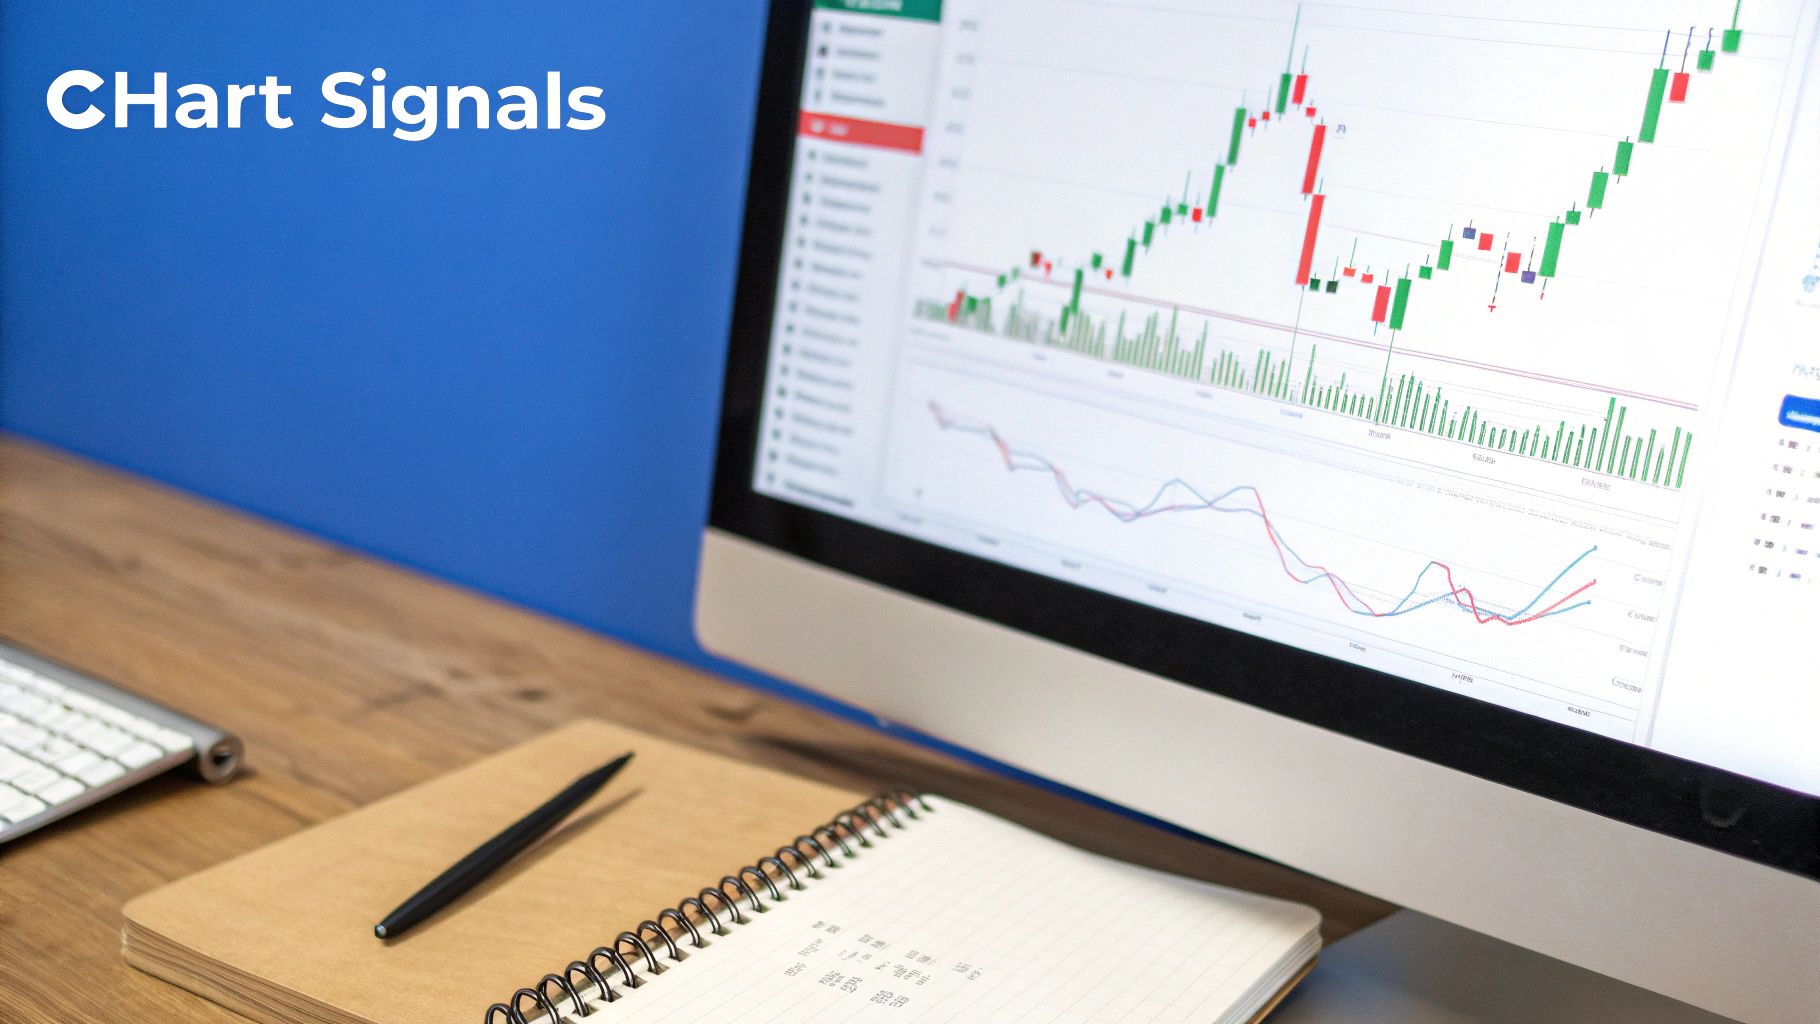
For traders who live and breathe price action, the language of the charts is everything. This specialized stock market jargon isn't just a collection of buzzwords; it's a vital shorthand for communicating complex market setups and ideas in an instant.
Terms like Support and Resistance, for example, aren't just lines on a screen—they pinpoint critical price zones where we expect buyers or sellers to make a stand. Likewise, indicators such as the Relative Strength Index (RSI) or Bollinger Bands give us a quick read on a stock's momentum and volatility.
We'll also dig into major chart patterns, like the Golden Cross and Death Cross, which often signal that a significant trend shift is underway. Getting comfortable with this lingo is the first step to truly interpreting what the market is telling you. To see these concepts in action, check out our practical guide to reading a stock chart like a pro and learn how to spot these patterns on your own screen.
Understanding Risk, Volatility, and Market Psychology
Successful trading is more than just reading charts; it's about understanding the twin forces of risk and human emotion. This part of our glossary gets into the nitty-gritty of how we measure and manage those forces.
Key terms like Volatility help us quantify just how wild a stock's price swings are, while metrics such as Beta and Alpha give us a hard number on a stock's risk and performance compared to the rest of the market. Getting a handle on these concepts is your first step toward building a truly resilient portfolio that can weather any storm.
Of course, the math is only half the story. The psychological side of the market is just as critical to master. We've all felt the pull of FOMO (Fear Of Missing Out), which can push traders into making irrational buys at the worst possible times. Then there's the classic Wall of Worry, a phenomenon describing how bull markets often climb higher despite a constant barrage of negative news. The 2009-2020 bull run was a textbook example of this in action.
To dig even deeper into how market expectations shape price action, it's worth exploring a detailed explanation of Implied Volatility (IV).
Still Have Questions About Market Jargon?
Even after you've learned the basics, some terms can still trip you up. We get it. Markets have a language all their own, and it's easy to get tangled in the specifics.
This section is here to tackle some of the most common sticking points and lingering questions traders have, whether they're just starting out or have been in the game for years. Think of it as a final check to clear up any confusion and make sure you're speaking the language of the market fluently.
