A Practical Guide to Reading a Stock Chart Like a Pro
If you've ever looked at a stock chart and felt like you were trying to decipher a foreign language, you're not alone. At its core, reading a stock chart is simply the art of analyzing a picture of a stock's price and trading volume over time. The goal? To spot trends and patterns that can give you an edge.
Think of it this way: every chart tells the story of a battle between buyers and sellers. Learning to read that story is probably the most fundamental skill you can develop as a trader. It turns all those lines, bars, and colors into actual insights you can use to decide whether to buy, sell, or just sit on your hands.
Understanding the Anatomy of a Stock Chart
Before you can spot the next big move, you have to get familiar with the basic language of the market. A stock chart is your Rosetta Stone for trading—it translates all the chaos of market activity into a visual story you can learn to interpret with real precision.
Every chart you'll ever look at, no matter the platform, is built on a few core components that work together to paint a clear picture of what a stock is doing.
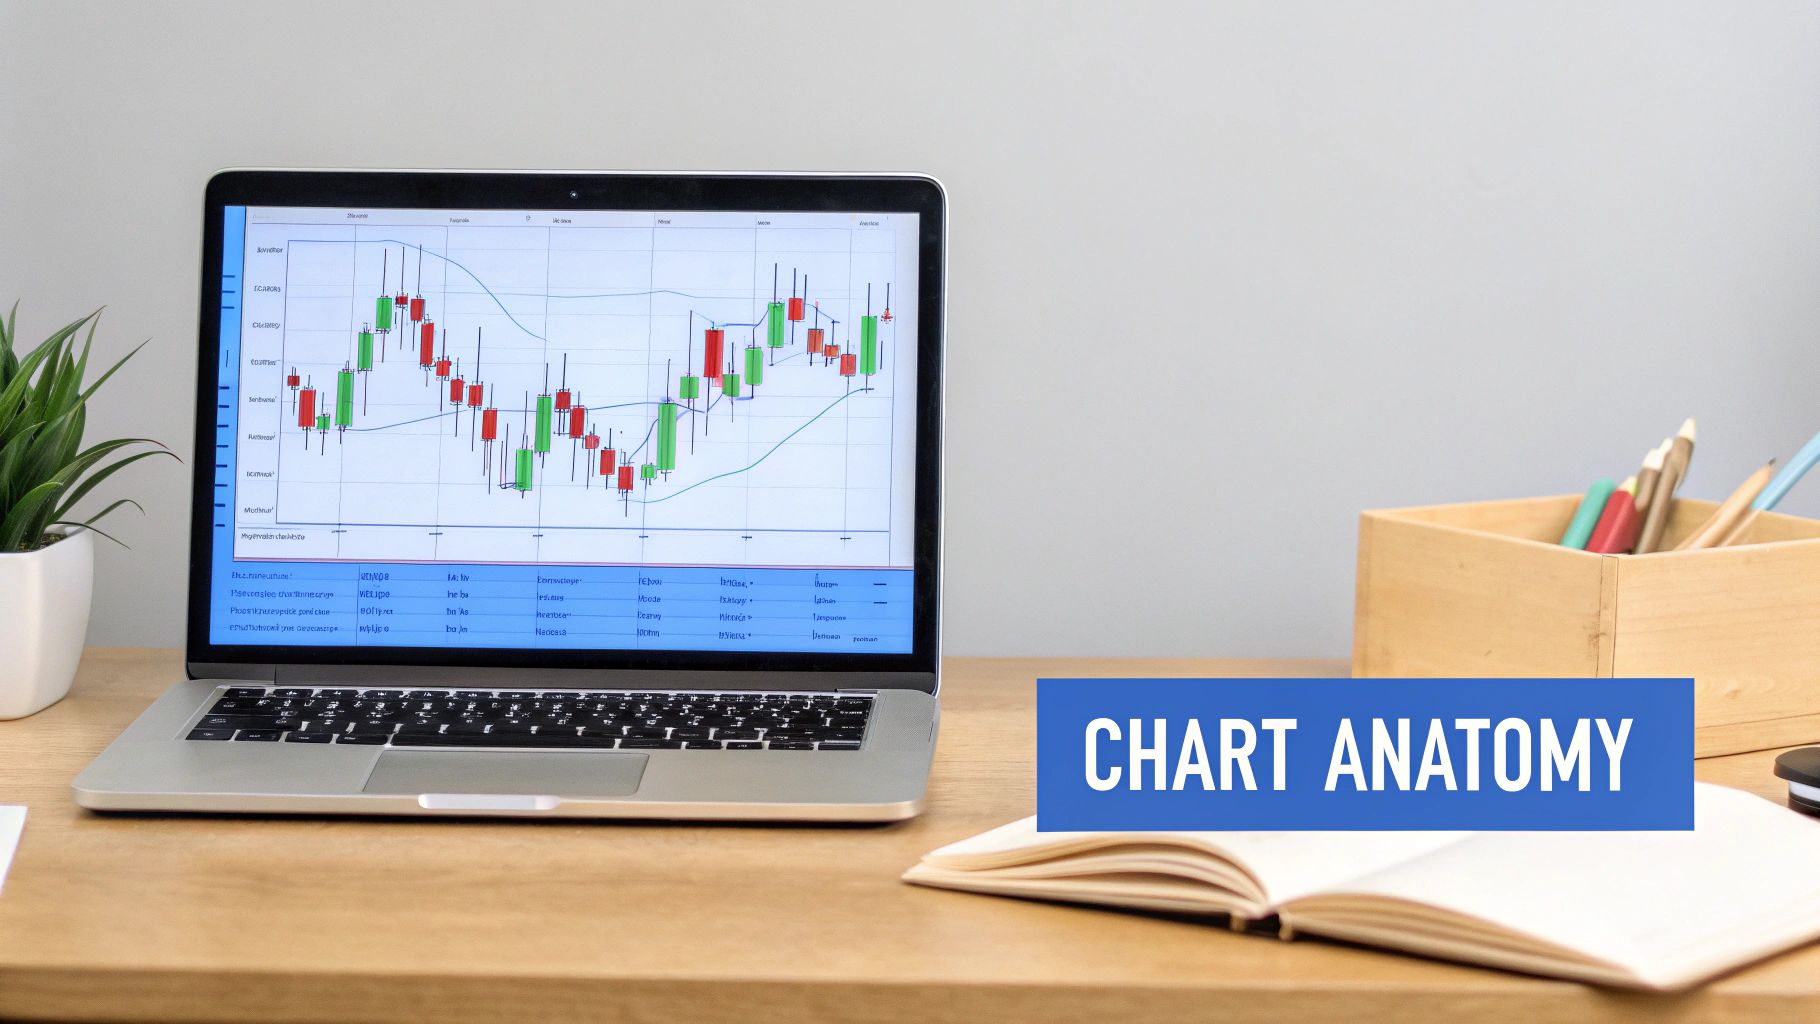
It all starts with four key pieces of information: the open, high, low, and close prices for any given period. These four data points are the absolute foundation of the bar and candlestick charts that professionals have relied on for decades. If you dig into the history of market indexes, you'll see these fundamentals have been the bedrock of market analysis since the early 20th century.
To get a clearer picture of these elements, let's break them down. This quick reference table outlines the essential parts of any stock chart and why they matter so much.
Key Chart Components at a Glance
| Chart Component | What It Reveals | Why It's Critical |
|---|---|---|
| Price Axis (Y-Axis) | The stock's price level. | Shows the exact value of the asset at any given moment. |
| Time Axis (X-Axis) | The time period being analyzed. | Provides the context for price movements (e.g., minutes, days, years). |
| Candlesticks | The open, high, low, and close prices for a specific time frame. | Gives an instant visual read on market sentiment and price momentum. |
| Volume Bars | The number of shares traded during a period. | Confirms the strength or weakness of a price trend. |
These are the building blocks. Once you understand what each component is telling you, you can start putting them together to see the bigger picture of market behavior.
The Key Axes: Price and Time
Every chart is laid out on two axes. The vertical Y-axis is all about price. The horizontal X-axis is all about time.
You can adjust that time frame to whatever you need, from a one-minute chart if you're day trading to a monthly or yearly chart for a long-term investment view. This simple grid is what allows you to see exactly how a stock's price has moved over any period you choose.
Price Representation: Candlesticks
Sure, you could just look at price as a simple line, but most traders I know live and die by candlestick charts. Why? Because each "candle" packs a ton of information into a small space.
A single candle gives you a complete summary of the price action for a specific period—be it one day, one hour, or even one minute. It instantly shows you the opening price, the closing price, and the highest and lowest points the stock hit during that time. We'll get into the nitty-gritty of reading them in the next section, but for now, just know that candlesticks are the true language of price action.
Decoding Price Action with Candlestick Patterns
Forget simple line graphs. If you really want to understand what a stock is doing, you need to learn the language of candlesticks. Each one is a mini-story of the battle between buyers and sellers, and learning to read them is like gaining a sixth sense for the market.
Think of it this way: each pattern is a visual footprint of market psychology.
A great example is the Doji. This is a candle where the opening and closing prices are almost identical, leaving a cross-like shape. When you see a Doji after a strong run-up, it’s the market hitting the brakes. It signals indecision—the buying pressure is fading, and a reversal could be just around the corner.
Another classic is the Hammer. You'll typically find this one at the bottom of a downtrend. It has a short body at the top and a long lower wick, showing that sellers tried to push the price down but buyers stormed back in and drove it right back up. It’s a powerful sign that sellers might be exhausted.
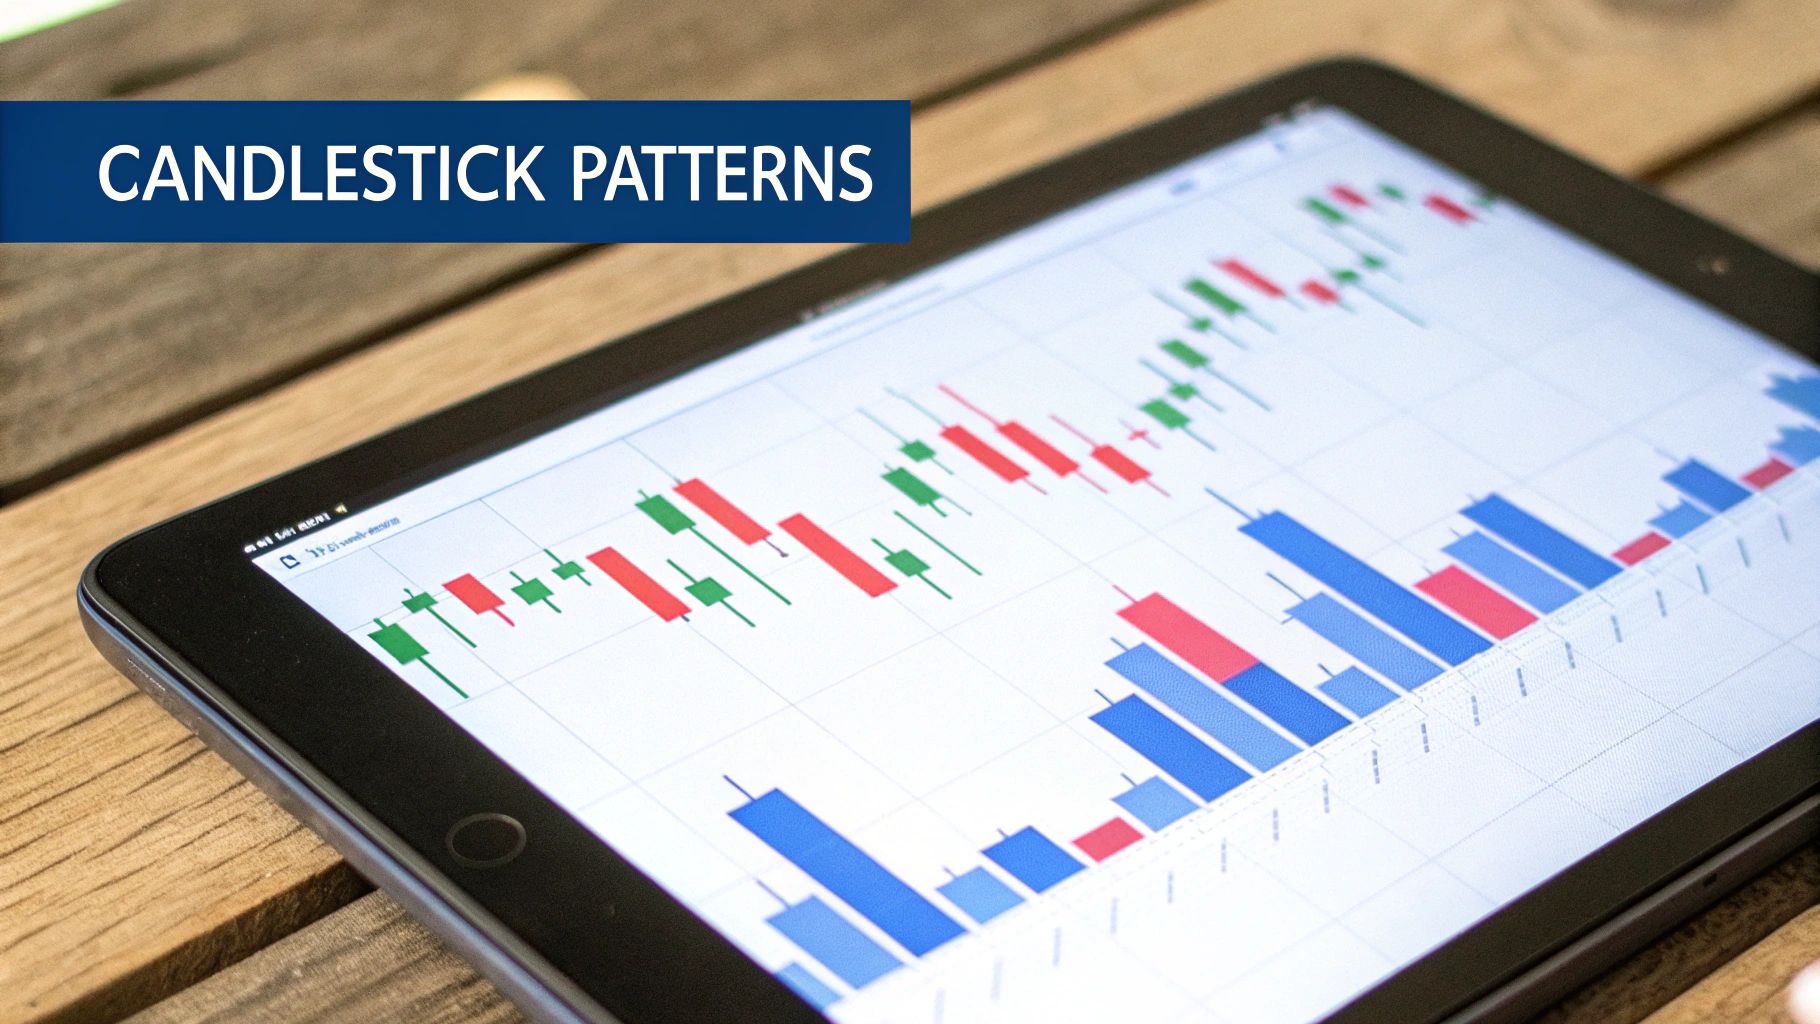
Bullish and Bearish Engulfing Patterns
Engulfing patterns are some of my favorites because they're so decisive. They show a sudden, dramatic shift in control between the bulls and bears, and they’re surprisingly easy to spot.
- Bullish Engulfing: This pattern starts with a small red candle, followed by a much larger green candle that completely "engulfs" the red one. It’s a clear signal that buyers have just wrestled control away from the sellers with overwhelming force.
- Bearish Engulfing: This is the mirror image. A small green candle gets swallowed up by a massive red candle, telling you the sellers are now in charge. A downtrend might be starting.
These aren't just shapes on a screen; they represent a significant transfer of power. If you want to get more familiar with these and other key formations, we break them down further in our guide to understanding candlestick charts with our trader's guide.
A key takeaway for traders is that the most potent candlestick patterns often appear at significant support or resistance levels. A Hammer pattern forming at a key support zone carries much more weight than one appearing in the middle of a trading range.
Context Is Everything
I can't stress this enough: no single candlestick pattern is a magic bullet. The best traders I know never trade a pattern in isolation. They use them as one piece of a much larger puzzle.
A pattern’s real power comes from confirmation. For instance, a bearish engulfing pattern is interesting on its own. But if it forms at a major resistance level after a long rally and is accompanied by a massive spike in volume? Now you have a high-probability setup.
That combination of signals—the pattern, the location, and the volume—is what builds a strong case for a trade. Your goal is to develop an intuitive feel for this price action, letting the candles tell you their story so you can build a solid trading thesis.
How to Identify Trends, Support, and Resistance
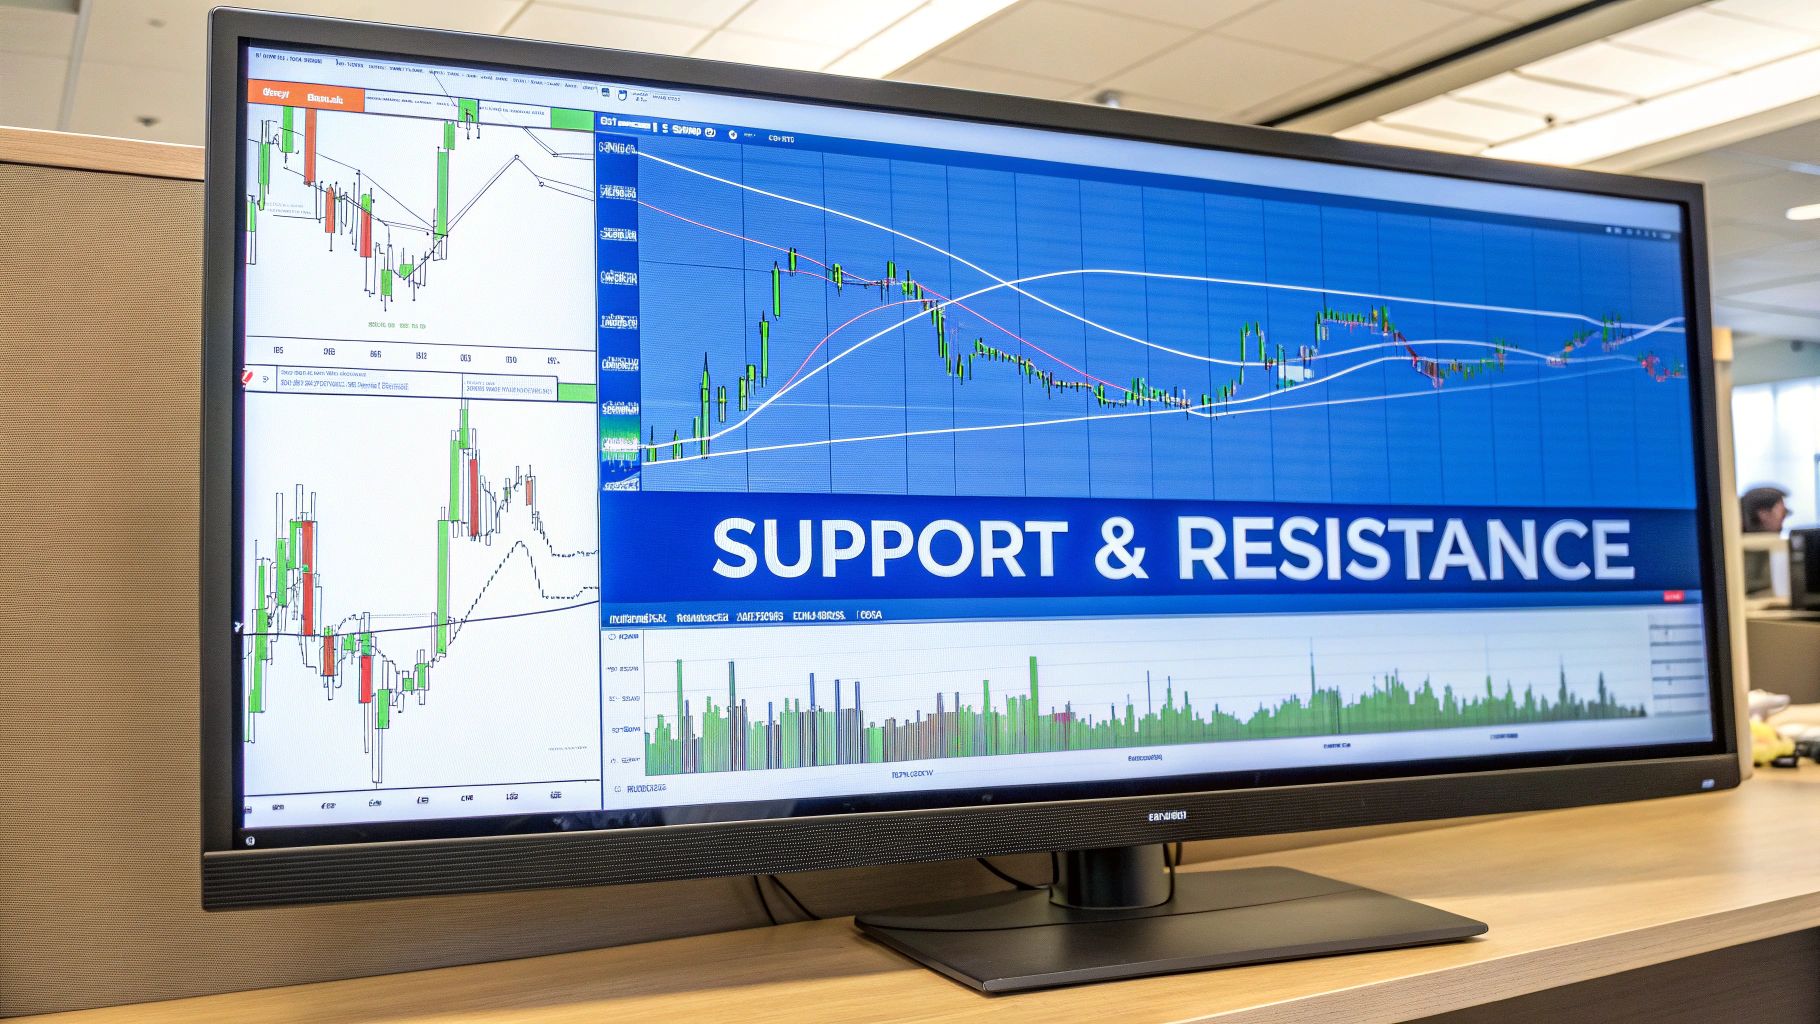
Alright, you've got a handle on what individual candlesticks are telling you. Now it's time to map out the battlefield. Profitable trading isn't just about single price bars; it's about understanding the broader flow of money and the key price levels where buyers and sellers dig in their heels.
These levels are what we call support and resistance.
Think of support as a price floor. It's an area where buyers have consistently stepped in, preventing the price from falling further. Resistance, on the other hand, is a ceiling—a price zone where sellers take control and halt a rally in its tracks. These aren't just lines on a chart; they're psychological battlegrounds that show you where market sentiment has shifted in the past.
Drawing Valid Trendlines
The simplest way to get a feel for a trend is to draw a line. In an uptrend, you connect the swing lows. In a downtrend, you connect the swing highs. It sounds simple, but the key is making sure the line is actually meaningful.
A common approach is the 'two-touch rule'. A trendline isn't really confirmed until the price has tested it and bounced off at least twice. The more touches, the more significant that trendline becomes.
Inside ChartsWatcher, the drawing tools make this easy. You can plot these lines directly on any chart. A clean break of a well-established trendline can be a huge signal that the market's direction is changing. But be careful—not every break is a reversal. Sometimes it's just a pause before the trend takes off again.
Pinpointing Support and Resistance Zones
While trendlines move with the price, support and resistance levels are horizontal. They are fixed price zones where the market has pivoted before. Scan your chart for areas where the price has repeatedly bounced or been rejected. Those are your key levels.
One of the most powerful concepts in trading is "role reversal." When a price smashes through a heavy resistance level, that old ceiling often becomes the new floor. Watching the price pull back and find support at a former resistance level is a classic sign of a strong, healthy trend.
These zones aren't some new-age trading gimmick. They’ve been a cornerstone of chart reading for over a century. A look back at 127 years of Dow Jones history shows how markets repeatedly respect these thresholds. During the massive bull run from 1982 to 2000, the index climbed over 1,400%, and its chart is a textbook example of higher lows acting as dynamic support. You can explore these long-term market trends on Guggenheim Investments for a masterclass in market structure.
This isn't just about day trading. Understanding these levels is a foundational skill that applies across all timeframes, from a 5-minute chart to a weekly one. The most powerful trade setups often appear when multiple factors—like a trendline, a moving average, and a horizontal support level—all line up at the same price. That’s when you need to pay attention.
Using Volume and Moving Averages for Confirmation
Price tells you what happened. Volume tells you the conviction behind it. It's the difference between a whisper and a shout.
When you're reading a stock chart, those volume bars at the bottom are non-negotiable. They add a layer of context that price alone can never give you.
Imagine a stock finally punches through a stubborn resistance level. If it does so on pathetic, below-average volume, that’s a huge red flag. It tells me there’s no real institutional muscle behind the move, and it's far more likely to be a "false breakout" that gets smacked back down.
But what if that same breakout happens on a massive volume spike—say, 200% or more of its average daily volume? Now we're talking. That signals that big money is piling in, giving the trade a much higher probability of following through.
Volume can also signal the end of a move. Picture a stock in a freefall. If it suddenly prints a massive red volume bar but the price barely moves lower, that could be capitulation. It’s the last of the panicked sellers throwing in the towel, which often clears the way for a potential bottom.
Decoding Moving Averages
Besides volume, moving averages are one of the most reliable tools in a trader's arsenal. They beautifully smooth out the chaotic day-to-day price action, giving you a much clearer picture of the underlying trend.
Two of the most important ones—watched by everyone from hedge funds to retail traders—are the 50-day and 200-day moving averages.
- The 50-Day Moving Average (50-DMA) often acts as a dynamic support level in an uptrend or resistance in a downtrend. Think of it as the short-to-medium-term trend guide.
- The 200-Day Moving Average (200-DMA) is the big one. It's the proverbial line in the sand for a stock's long-term health. A stock trading above its 200-DMA is generally considered to be in a healthy, long-term uptrend.
These aren't just arbitrary lines on a chart. They are powerful, self-fulfilling prophecies because so many market participants watch them. Price will often pull back to these levels before resuming its trend. For a deeper dive into the mechanics, check out our guide on how to calculate moving averages for trading.
Pro Tip: When the 50-DMA crosses above the 200-DMA, it’s called a "Golden Cross"—a classic bullish signal. The opposite, when the 50-DMA drops below the 200-DMA, is a "Death Cross" and signals potential long-term weakness.
Simple vs. Exponential Moving Averages
You'll run into two main types of moving averages, and which one you use really comes down to your trading style.
| Moving Average Type | Calculation | Best For |
|---|---|---|
| Simple (SMA) | Averages prices over a set period, giving equal weight to each day. | Identifying long-term, stable trends and major support/resistance zones. |
| Exponential (EMA) | Gives more weight to recent prices, making it more responsive. | Short-term traders who need to react quickly to trend changes. |
Basically, the SMA is the slow-and-steady workhorse. It's great for filtering out market noise. The EMA is the nimble, quicker version that reacts faster to price changes.
There's no "right" answer. Many short-term traders I know swear by the EMA because it can flag a potential trend change a bit sooner. It's all about matching the tool to your timeframe and strategy. By combining sharp volume analysis with these key moving averages, you're no longer just looking at a chart—you're starting to understand the story it's telling.
Adding Key Indicators Without the Clutter
It’s a rookie mistake, and we’ve all been there: plastering a dozen different lines and oscillators on your chart, thinking more data equals more insight. It doesn't. You just end up with a confusing mess that creates "analysis paralysis," causing you to second-guess every move and miss perfectly good trades.
The real key to reading a chart effectively is adding only what provides clarity, not confusion. I've found a minimalist approach is always more powerful. For most traders, just two well-chosen indicators are plenty. Think of them as a confirmation layer for what the price is already telling you, not the primary reason to take a trade.
Mastering Momentum and Trend with Two Indicators
We're going to focus on two of the most reliable workhorses in technical analysis. They measure different things but work together beautifully to give you a much clearer picture of what a stock is actually doing.
-
Relative Strength Index (RSI): This is your momentum gauge. It measures the speed and magnitude of price changes on a scale of 0 to 100. The classic textbook levels are 70 for overbought and 30 for oversold. But a word of caution: an RSI above 70 doesn't mean you should immediately hit the sell button. It's simply a heads-up that the rally might be getting a little tired and could be due for a rest.
-
Moving Average Convergence Divergence (MACD): The MACD is all about spotting changes in trend momentum. It’s built with two lines (the MACD line and the signal line) and a histogram. When the faster MACD line crosses above the slower signal line, it’s a bullish signal suggesting upward momentum is picking up. A cross below is the bearish equivalent.
These two are often more than enough to build a clean, functional workspace in ChartsWatcher. They help you get a feel for the market's pulse without covering up the single most important thing on your screen: the price itself.
The real magic happens when price and your indicators start telling you two different stories. This is called divergence, and it’s one of the most powerful early warning signals a trader can learn to spot.
The Power of Divergence
Divergence is a concept that can feel like a superpower once you master it. It’s a warning shot that a reversal might be brewing just over the horizon, and it happens when the price of a stock moves in the opposite direction of an indicator.
Let's paint a picture. Imagine a stock is ripping higher, printing new high after new high. Everyone is euphoric. But you glance down at your RSI and notice it's making lower highs.
That's a classic bearish divergence. It’s a subtle but critical clue that the momentum behind the rally is fading. The buyers are getting exhausted, even as the price inches up. That move could be running on fumes.
Learning to spot these discrepancies gives you a massive edge. It lets you anticipate potential turning points with more confidence, turning your indicators from simple data points into a powerful forecasting tool.
Putting It All Together With a Practical Workflow
All this theory is great, but knowledge only becomes powerful once you apply it. Having a repeatable, systematic way to look at a stock chart is what separates random guessing from consistent trading. The goal is to build a process that takes you from analysis to execution with confidence.
I’ve found the best way to start is by setting up a custom dashboard in a tool like ChartsWatcher. Instead of chasing every market move and getting distracted by noise, you can build a focused environment with just your go-to charts, key indicators, and watchlists all in one place. Your setup should let you see your specific trade criteria without anything else getting in the way.
Building Your Pre-Trade Checklist
Before you risk a single dollar, every single trade idea needs to pass a strict checklist. This isn't about bureaucracy; it's about forcing yourself to verify that a setup meets your rules, which is the single best way to keep emotion out of your trading.
Your checklist doesn't have to be complicated. Just make sure you're getting confirmation from a few different angles:
- The Trend: Is the stock in a clear uptrend or downtrend on the timeframe you’re trading? No ambiguity allowed here.
- Key Levels: Is the price bouncing off or breaking through a major support or resistance zone you've already marked?
- Candlestick Signal: Do you see a specific bullish or bearish candle pattern that confirms your trade idea?
- Volume: Is the volume telling the same story as the price? Big moves should have big volume behind them.
- Indicator Confluence: Are your favorite indicators, like RSI or MACD, giving you the same signal?
This simple flowchart shows what a bare-bones process might look like—using RSI for momentum and then confirming it with MACD for trend.
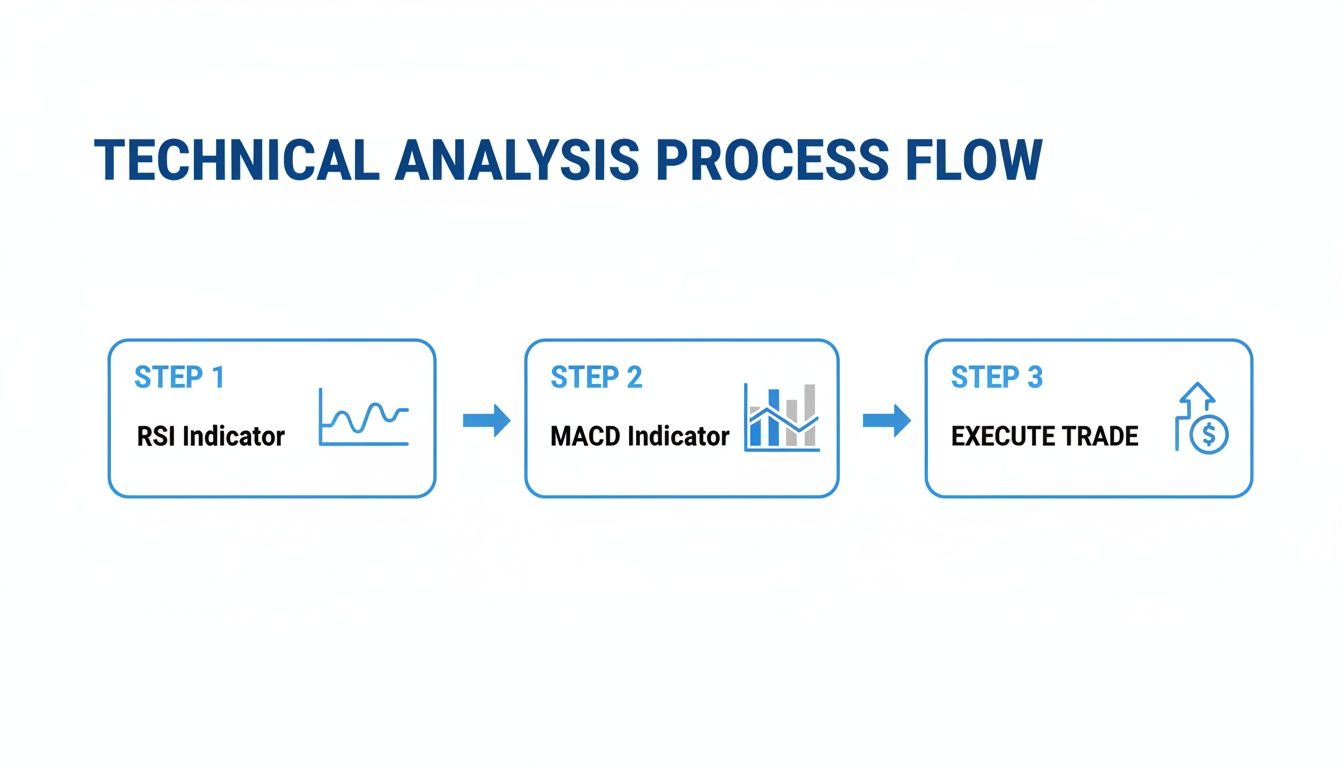
It’s a perfect example of how layering just two simple indicators can create a powerful confirmation system before you pull the trigger.
Look, the point isn't to find a perfect system that never loses. That doesn't exist. The real goal is to build a reliable framework that gives you an edge over time, ensuring every trade you take is well-reasoned and actually follows your strategy.
Finally, put technology to work for you. Set specific alerts in ChartsWatcher for things like a trendline break, a support level test, or an RSI divergence. Let the software do the boring part—watching the charts—so it can notify you the moment a setup you're waiting for becomes active. This methodical approach helps ensure you’re trading what the chart is actually telling you, not what you hope it will do.
Common Questions About Reading Stock Charts
Once you get the basics down, a few questions almost always come up as traders start putting theory into practice. Let's get them out of the way so you can move forward with confidence.
What Is the Best Time Frame to Use?
This is easily the most common question I hear, and the answer is always the same: it depends entirely on your trading style. There's no magic "best" setting.
A day trader trying to scalp tiny, rapid moves might live on the 1-minute and 5-minute charts. On the other hand, swing traders looking to hold positions for a few days or weeks will find their home on the hourly and daily charts. Long-term investors? They're zooming way out to the weekly and monthly charts to get a bird's-eye view of major market trends.
The most powerful approach, though, is what we call multi-timeframe analysis. You start with a longer time frame (like the daily chart) to figure out the primary trend—the main direction the stock is headed. Then, you zoom into a shorter one (like the hourly) to pinpoint your exact entry and exit. It gives you the best of both worlds: broad context and surgical precision.
How Reliable Are Classic Chart Patterns?
Patterns like the Head and Shoulders can be incredibly reliable, but they are never, ever foolproof. Think of them as strong suggestions, not unbreakable laws. Their real power comes to life when other signals back them up.
For instance, a Head and Shoulders top pattern is interesting on its own. But it becomes far more compelling if the breakdown below the neckline happens on a huge spike in volume. It's even stronger if you spot a bearish divergence on an indicator like the RSI or MACD at the same time.
Never trade a pattern in a vacuum. The pros look for confluence—that beautiful moment when multiple, unrelated signals all point in the same direction. That’s what separates a random guess from a high-probability setup.
Can I Learn to Read Charts Without Indicators?
Absolutely. In fact, many of the best traders I know use "naked" charts with almost nothing on them. This is called price action trading, and it’s a discipline built purely on candlesticks, support/resistance levels, and trendlines.
At the end of the day, remember that indicators are just derivatives of price. They take the raw price and volume data and repackage it in a different visual format. Learning to read the price action itself is arguably the most fundamental and powerful chart reading skill you can ever develop.
Ready to build a systematic, repeatable workflow for analyzing charts? ChartsWatcher provides the tools you need to create custom dashboards, set intelligent alerts, and backtest your strategies with precision. Start making more informed trading decisions today at https://chartswatcher.com.
