A Practical Guide to Trade the Price Action for Consistent Results
To trade price action is to learn the market’s language. It’s about stripping your charts down to the essentials—price, and nothing else—and making your decisions based on the raw movement you see.
This isn’t about guessing or following some lagging indicator. It's about reacting to what the market is doing right now, not what a formula calculated from old data suggests it might do.
The Trader's Edge: Understanding Price Action
At its core, price action trading is simply interpreting the behavior of buyers and sellers as it unfolds. You’re focusing on the price itself because you believe it’s the ultimate source of truth. Every bit of news, sentiment, and fundamental data is already baked into that price movement.
The philosophy is simple but incredibly powerful. Every candlestick, swing high, and swing low is a word in the market's ongoing story. When you learn to read that story, you gain a real edge. You stop chasing signals and start understanding the psychology driving the market.
Reading the Market's True Story
Think of a price chart as the market's unfiltered communication channel. It’s a real-time visualization of the constant battle between supply (sellers) and demand (buyers). When demand wins, prices shoot up. When supply takes over, prices fall. It’s that fundamental.
This approach has been around for centuries. Its roots trace back to 17th-century Japan, where a rice trader named Muneisa Homma first developed candlestick charts to visualize price changes more effectively. The technique eventually found its way west, where pioneers like Al Brooks and Richard Wyckoff built entire methodologies around reading pure price.
Gaining "The Trader's Edge" requires more than just looking at charts; it's about applying rigorous analytical thought. Much like cultivating critical reading and analytical skills helps you dissect complex texts, it enables you to interpret market movements with far greater depth.
The Foundational Pillars of Price Action
To trade price action successfully, you need to master a few core concepts. These aren't complicated formulas; they're observational skills that train your eye to see what really matters.
Here’s a quick rundown of the fundamental pillars that form the basis of all price action strategies.
Core Price Action Concepts at a Glance
| Concept | Description | What It Tells You |
|---|---|---|
| Market Structure | The sequence of swing highs and swing lows. | The overall trend direction (uptrend, downtrend, or range). |
| Support & Resistance | Key price zones where buying or selling pressure has historically reversed price. | High-probability areas where the market is likely to react. |
| Candlestick Patterns | Small, recognizable formations of one or more candles. | Short-term shifts in sentiment and potential reversal signals. |
These concepts are the building blocks for creating a clear, comprehensive picture of market dynamics. Mastering them allows you to move beyond isolated signals and develop a true understanding of the market's current state.
Key Takeaway: Price action trading strips away the noise. It forces you to engage directly with the market's behavior, building a deeper, more intuitive understanding of why prices move. This direct approach is what gives disciplined traders their edge.
Decoding the Charts with Key Price Action Setups
Now that we’ve covered the foundational pillars, let's get to the good stuff: translating that knowledge into actual trades. To really trade the price action, you need to train your eyes to spot specific, repeatable patterns—the setups that signal a potential shift in the market's supply and demand. Forget memorizing hundreds of obscure patterns; we're focusing on the vital few that show up time and time again, across all markets and timeframes.
These setups are your trade triggers. They’re the moments when the market story you've been reading through structure and key levels suggests a move is about to happen. Think of it as the market tipping its hand, giving you a clear window to act.
The Classic Breakout and Retest
One of the most powerful and intuitive setups is the breakout from a consolidation zone. Markets don't trend forever. They often pause and coil into tight ranges as buyers and sellers hit a temporary stalemate. A breakout is that decisive move outside the range, signaling one side has finally won the fight.
But chasing that initial pop can be a recipe for disaster. The smarter, more reliable play is often to wait for the "retest." After blasting through a key resistance level, the price will frequently pull back to test that same area, which now tends to act as new support. A successful bounce off this old resistance confirms the level's new role and gives you a much safer entry point to get long.
This pattern is so effective because it bundles several price action principles into one clean signal:
- A clear shift in market structure: The breakout itself creates a new swing high or low.
- Confirmation of a key level: The retest validates the support/resistance flip.
- A defined risk level: Your stop loss has a logical place to live—just below the retest level.
Riding the Trend with Pullbacks
In a trending market, pullbacks are your best friend. An uptrend isn’t a straight line up; it's a series of higher highs and higher lows. Those temporary moves against the trend—the "pullbacks" that form the higher lows—are prime buying opportunities.
Instead of chasing the market at its peak, you patiently wait for it to come back to an area of value. This could be a previous support level, a rising trendline, or even a key moving average like the 20-period EMA. When price dips to this zone and shows signs of rejection (like a bullish pin bar), it's a strong hint that the trend-following buyers are stepping back in.
Trader's Insight: The key to trading pullbacks is patience. It feels completely counterintuitive to buy when the price is dropping, but this is exactly how you get into a strong trend at a better price with lower risk. Let the market come to you.
Spotting Traps with False Breaks
Here’s a hard truth: not every breakout is legitimate. A "false break," or fakeout, is a nasty trap that catches eager traders on the wrong side of the market. It happens when the price pokes above a key resistance level, sucking in breakout buyers, only to aggressively reverse and plunge back below the level.
But for a savvy price action trader, someone else's trap is your opportunity. This failed breakout is a powerful signal in itself. It shows there wasn't enough buying power to sustain the move, and the sharp reversal is often fueled by trapped longs who are now forced to sell, adding fuel to the fire.
To really get a feel for identifying these movements on a chart, you need good tools. You can explore how platforms like TradingView facilitate chart analysis to see these patterns play out in real-time.
The Storytelling Power of Candlesticks
Within these bigger setups, individual candlesticks provide critical clues about the short-term battle between buyers and sellers. Two of the most important signals are pin bars and inside bars. Think of them as confirmation signals that add a ton of weight to a setup when they appear at a key level.
- Pin Bars (or Rejection Wicks): A pin bar has a long wick sticking out and a small body, telling you that price tried to move in one direction but was aggressively rejected. A bullish pin bar popping up at a support level is a huge sign that buyers have just overwhelmed the sellers.
- Inside Bars: An inside bar is a small candle whose entire range is contained within the high and low of the previous candle. It represents a brief pause or indecision—like the market is coiling up energy. A break of the inside bar's range can often trigger an explosive entry.
For a deeper dive into the language of candlesticks, our guide on understanding candlestick charts breaks down exactly what each candle is telling you. Mastering these core setups—breakouts, pullbacks, and false breaks, all confirmed by candlestick signals—is what trading the price action is all about.
Executing Trades with Precision and Discipline
Spotting a high-probability setup on a chart is just the first step. The real test—where profits are actually made or lost—is in how you manage the trade from the moment you enter to the second you exit. To really trade the price action like a pro, your execution needs to be as sharp and disciplined as your analysis. This is how you turn a good idea into a well-managed position.
This isn't just about hitting the buy or sell button. It's about having a solid framework for getting into the market, defining exactly what you're willing to risk, and knowing when to cash in. Without this structure, even the most perfect-looking setups can fall apart due to hesitation, greed, or fear.
This flowchart maps out the typical sequence a price action trader follows, from spotting a breakout to navigating the pullbacks and fakeouts that trap the unprepared.
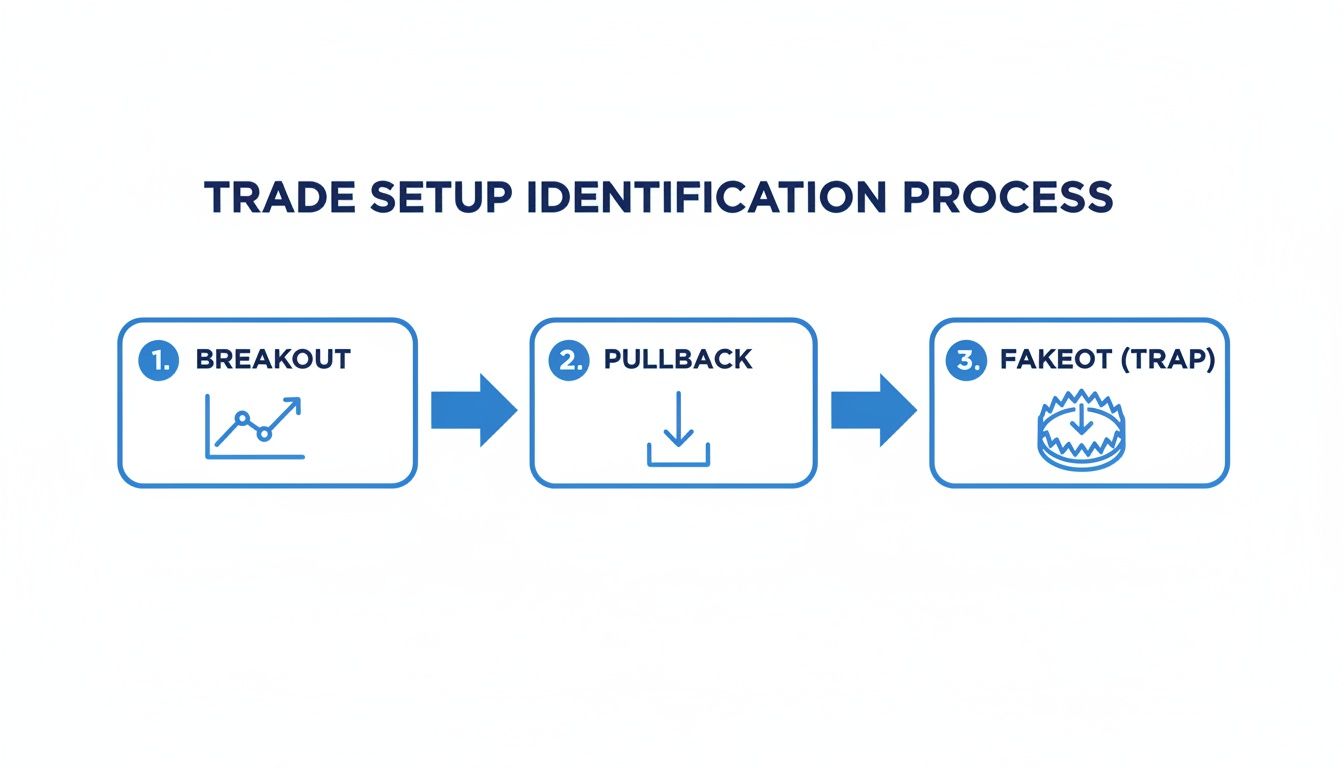
As you can see, trading price action is about reacting to a sequence of events, not just isolated patterns. Each stage brings a different opportunity and a different level of risk.
Mastering Your Trade Entries
How you get into a trade can make or break it, dramatically affecting both your risk-to-reward ratio and your mindset. There’s no single “best” way to enter; it all comes down to the market's behavior and your own comfort with risk.
- Aggressive Entry: This means jumping in the moment a key level or candle breaks—for instance, buying the instant the price ticks above a pin bar's high. You get in early, but you also face a higher chance of the move failing and reversing on you.
- Conservative Entry: Here, you wait for confirmation. A common tactic is waiting for a full candle to close beyond a key level before entering. If you're looking to buy, you'd wait for an hourly candle to close above a resistance zone, confirming the bulls are in control and reducing the odds of a false break.
An aggressive entry might be your go-to in a ripping trend where you're afraid of being left behind. In choppier, range-bound markets where fakeouts are everywhere, a conservative entry is usually the smarter play.
Setting Intelligent Stop-Losses
Your stop-loss isn't just a safety net; it's the specific price point where your trade idea is proven wrong. Placing it correctly is one of the most vital skills you can develop.
Forget about placing stops at random percentage or dollar amounts. Instead, anchor them to the actual market structure. If you’re buying a pullback to a support level, your stop should be placed logically just below that support. If the price breaks that level, your entire reason for taking the trade is gone.
Trader's Insight: Place your stop-loss where the market would have to do something "unnatural" to hit it. It should be at a point that, if breached, signals a clear shift in the immediate price action and invalidates your original thesis.
Price action traders typically focus their analysis on the last 3 to 6 months of price history. This keeps the context relevant without getting bogged down by old, meaningless data. Within this timeframe, we identify the key swing points and support/resistance levels that define the current structure—which is absolutely crucial for placing effective stops. To see this in more detail, you can learn more about how traders use recent price action.
Letting Your Winners Run
Taking profits is an art. One of the biggest mistakes traders make is cutting their winners short, which absolutely kills long-term profitability. While having a fixed target (like a 2:1 risk-to-reward) is great for building discipline, more advanced methods can help you squeeze every last pip out of a strong trend.
A powerful technique is to trail your stop-loss based on market structure. For example, in a clear uptrend, as the price pushes to a new higher high and then pulls back to form a higher low, you can move your stop up to just below that new higher low.
This dynamic approach does two things perfectly:
- It locks in profits as the trade moves further in your favor.
- It gives the trade room to breathe, so you don't get shaken out by normal market noise.
By managing your trade this way, you take the emotional guesswork out of when to exit. The market itself tells you when the trend has likely run its course by breaking the established structure. This combination of a structured entry, a logical stop, and a dynamic exit is the engine that drives disciplined trading.
Building Confidence Through Backtesting and Refinement
Trust in your trading strategy isn't built on hope; it's forged with data. A brilliant setup on paper means nothing until you've proven it works across different market conditions. This is where backtesting becomes the single most critical exercise in your development as a trader.
Think of it as the bridge between theoretical knowledge and real-world competence. You're essentially going back in time on your charts to "trade" your system as if it were live, following your entry, stop-loss, and exit rules with ruthless consistency.
This isn't just about validating a strategy. It’s an immersive practice that deeply ingrains pattern recognition and builds the discipline required to trade the price action effectively when real money is on the line.
The Mechanics of Manual Backtesting
Manual backtesting is a hands-on, deliberate process. While software can automate parts of this, the manual method forces you to analyze every candle and every decision, which is invaluable for learning. The goal is to simulate live trading as closely as possible, just without the emotional pressure.
The process itself is straightforward but demands diligence:
- Isolate a Time Period: Pick a specific historical window on your chart—say, the last 12 months. Scroll back so you can't see the future price action.
- Advance the Chart: Move forward one candle at a time, analyzing the market structure just as you would in a live session.
- Execute Based on Rules: When one of your specific setups appears, you take the trade. Record the entry price, stop-loss placement, and your target or trailing stop strategy.
- Log Everything: Meticulously record the outcome in a journal. Was it a win, a loss, or a break-even? What was the risk-to-reward ratio?
This isn't about finding a "perfect" system. It’s about understanding your system’s personality—its strengths, its weaknesses, and its statistical edge over a large sample of trades. For a comprehensive look at this process, check out our guide on how to backtest trading strategies like a pro.
Key Metrics to Track and Why They Matter
A simple win/loss count won't cut it. To truly understand your strategy's performance, you need to track specific metrics that reveal its profitability and risk profile. These data points tell the real story of your edge.
Modern traders have a massive advantage here. Today's platforms offer unprecedented access to historical market data, often spanning 15 to 20 years. You can test your price action strategies across multiple bull and bear market cycles, giving you a much clearer picture of how your system holds up when the environment shifts.
Essential Backtesting Metrics
Tracking the right numbers is what separates amateur guesswork from professional analysis. Here’s a breakdown of the key performance indicators you absolutely must log in your backtesting journal.
| Metric | What It Measures | Why It's Important |
|---|---|---|
| Total Number of Trades | The size of your data sample. | A larger sample size (100+ trades) provides more reliable and statistically significant results. |
| Win Rate | The percentage of trades that were profitable. | Helps you understand the frequency of wins, which is crucial for managing your trading psychology. |
| Average Risk-to-Reward Ratio | The average gain on winning trades versus the average loss on losing trades. | This determines your long-term profitability. You can be profitable with a 40% win rate if your winners are much larger than your losers. |
| Maximum Drawdown | The largest peak-to-trough decline in your account equity. | This is the most important risk metric. It tells you the worst-case losing streak your system experienced and prepares you mentally for it. |
These metrics move you beyond just a win rate and force you to look at performance through the lens of a business owner.
Key Takeaway: Backtesting transforms you from a signal-chaser into a system owner. It replaces fear and uncertainty with data-driven confidence, proving that you have a statistical edge you can rely on, trade after trade.
By rigorously backtesting and refining your approach, you stop guessing and start operating like a professional. You know your numbers, you understand your risks, and you have unshakeable confidence in your ability to execute. This is the foundation upon which consistent profitability is built.
Streamlining Your Workflow With ChartsWatcher
Successful trading isn't just about smart analysis—it's about building a brutally efficient process. Let's be honest: in fast-moving markets, manually flipping through hundreds of charts looking for that one perfect setup is a recipe for missed opportunities and total burnout.
This is where you make the critical shift from being a "chart hunter" to a process-driven operator.
The goal is to stop wasting precious mental energy on the repetitive grind of searching. You want a system that brings high-probability setups directly to you. This frees you up to focus on what actually makes you money: analyzing context, executing flawlessly, and managing risk like a pro.
This is where tools like ChartsWatcher become indispensable. They transform your workflow from a reactive, manual slog into a proactive, automated surveillance system.
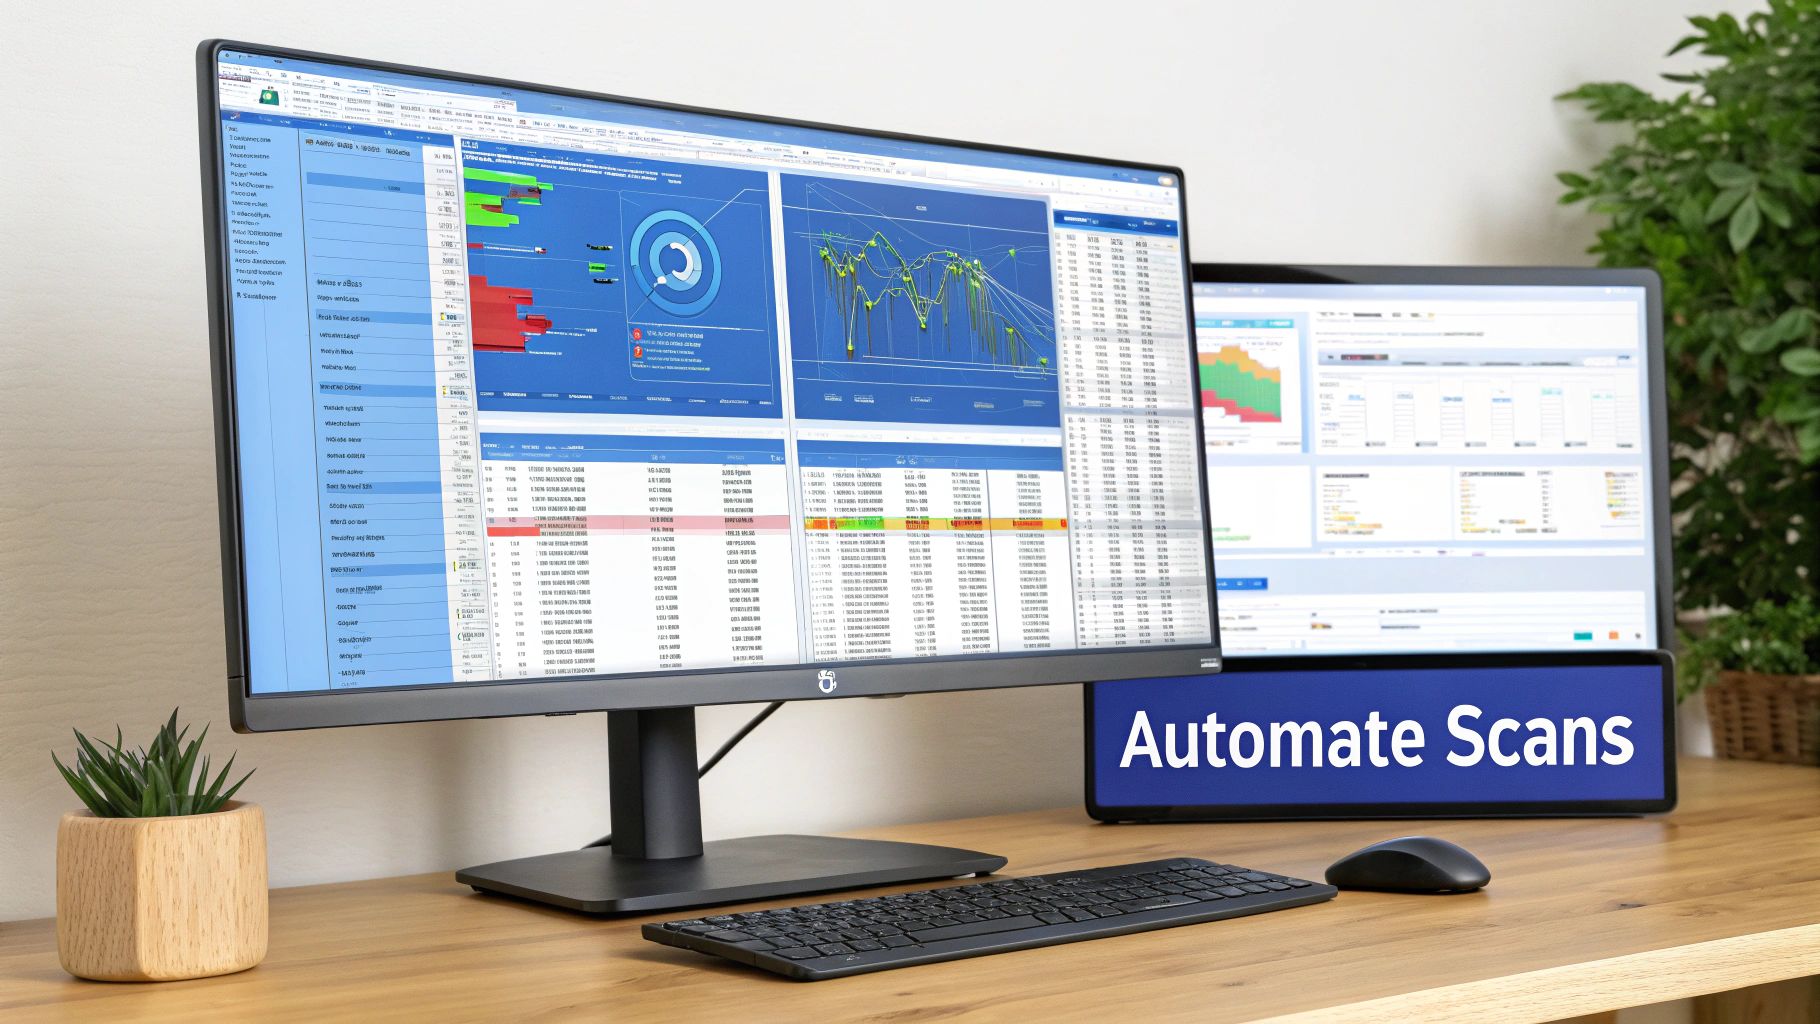
Automating Your Search for Setups
Imagine you only want to trade stocks on the NASDAQ that are forming an inside bar on the daily chart, specifically near their 50-day moving average. Finding that manually would take hours, and you'd still probably miss a few. With a good scanner, you can build that exact screen and get a real-time list of candidates in seconds.
This level of automation is a complete game-changer. Instead of being chained to your desk, you build custom scans and alerts for your go-to price action patterns.
Here’s how this fundamentally changes your trading day:
- From Searching to Analyzing: You spend your time evaluating pre-qualified setups instead of mindlessly clicking through charts.
- Wider Market Coverage: You can monitor thousands of instruments at once, meaning you never miss a prime opportunity in some stock you weren't even watching.
- Reduced Emotional Decisions: Automated alerts eliminate the temptation to force trades on charts that don't meet your strict criteria. The machine has no FOMO.
The key insight here is efficiency. You're no longer the one doing the grunt work; you're the analyst who acts on the filtered intelligence the system provides.
Designing Your Mission Control
An effective workflow is about more than just getting alerts. It's about creating a centralized hub where you can see the whole picture at a glance. A professional trader’s screen isn't a chaotic mess of random charts—it’s a carefully designed dashboard where every window serves a purpose.
Trader's Insight: Your trading desk should function like a cockpit. Information needs to be organized logically so you can assess the market, monitor your setups, and execute with minimal friction. A cluttered screen leads to a cluttered mind.
With a platform like ChartsWatcher, you can build multi-window layouts that bring everything you need into one view.
For instance, you could design a dashboard with a few key windows:
- Main Alert Window: Your primary feed, showing every stock that just triggered one of your pre-built scans.
- Watchlist Window: A curated list of stocks you're actively stalking for a setup, maybe with key levels already marked.
- Linked Charting Window: Click an alert or a name on your watchlist, and its chart instantly pops up here for deeper analysis.
- News Feed: A filtered feed to make sure you’re not about to step in front of a major headline on one of your tickers.
This integrated approach lets you react quickly and with full context when an opportunity appears. Your ability to trade the price action effectively hinges on having the right information at the right time. By automating the search and organizing your workspace, you build a professional environment that's designed for consistency and discipline—and you leave the chaos that plagues most aspiring traders far behind.
Got Price Action Questions? Let's Get Them Answered.
As you start applying price action concepts, you’re going to hit roadblocks. It’s inevitable. What looks clean in a textbook gets messy in live markets, and that's when the real questions pop up.
Think of this section as pulling up a chair with a seasoned trader. We're going to tackle the most common sticking points I hear with direct, no-fluff answers to help you build confidence and keep making progress.
What Is the Best Timeframe to Use?
This is easily the question I get asked most often. My answer is always the same: the one that fits your personality and your schedule.
There’s no magic bullet here. A full-time day trader might spend all day on a 5-minute chart, while a swing trader with a day job will find their edge on the daily and 4-hour charts. The biggest mistake is jumping between them randomly—looking at a weekly trend, then hunting for an entry on a 1-minute chart. That’s a recipe for confusion and conflicting signals.
Here’s a simple way to think about it:
- Higher Timeframes (Daily, Weekly): This is where you find your bearings. These charts cut through the noise, showing you the dominant trend and the major support and resistance zones that matter. This is your strategic map.
- Lower Timeframes (1-Hour, 15-Minute): This is for execution. Once your daily chart points to a major support level, you can zoom in here to find a precise entry trigger, like a pin bar or a clean break of a small range.
A solid, time-tested approach is to use a higher timeframe for your main analysis (the "why") and a lower timeframe for your trade entry (the "when"). This multi-timeframe analysis is a cornerstone of professional trading.
How Do I Handle Conflicting Signals?
You’ve been there. You spot a perfect bullish pin bar at support on the 4-hour chart, but a quick glance at the daily chart shows a roaring downtrend. What gives?
It's a classic trap, but the rule is simple: the higher timeframe always wins.
That bullish signal on the 4-hour is likely just a minor pause or a weak bounce within a much larger move down. Taking that trade means you're fighting the market's primary momentum—a low-probability bet.
Key Takeaway: Always trade in alignment with the trend on your higher timeframe chart. A setup that goes against that dominant pressure isn't an opportunity; it's a signal to stay patient and wait for a better one. This discipline alone will save you from countless bad trades.
Is Price Action Trading Enough on Its Own?
Absolutely. Plenty of professional traders use nothing more than clean charts. Price action is a complete methodology in itself, giving you everything you need to find and manage high-quality trades.
However, that doesn't mean you can't layer in a simple tool for extra confirmation. The key word here is confirmation, not signal generation.
| Tool | How a Price Action Trader Might Use It |
|---|---|
| Moving Averages (e.g., 20 & 50 EMA) | To quickly see trend direction and identify dynamic areas of support or resistance. |
| Volume Profile | To spot high-volume nodes where big players have transacted, creating strong support/resistance. |
| RSI or Stochastics | To check for overbought/oversold readings as price approaches a key structure level. |
The critical rule is that your reason for entering a trade must come from the price action itself—the market structure, the trend, and the candlestick pattern. An indicator just adds a bit of extra confluence. If your charts start looking like a tangled mess of lines, you’ve lost the plot. Simplicity is power when you trade the price action.
Ready to stop hunting for setups and start analyzing them? ChartsWatcher builds a professional workflow by delivering pre-qualified opportunities directly to you. Automate your scans, organize your workspace, and focus your energy on execution. Discover how ChartsWatcher can sharpen your trading edge today.
