A Practical Guide: technical indicators for intraday trading
Technical indicators are the bread and butter of intraday trading. At their core, they're just mathematical tools that crunch past price and volume data to give you a read on what the market might do next. Think of tools like the Relative Strength Index (RSI) or simple Moving Averages—they provide signals about market trends, momentum, and volatility, helping you make smarter entry and exit calls within a single trading day.
Why Indicators Are Your Intraday Trading Dashboard
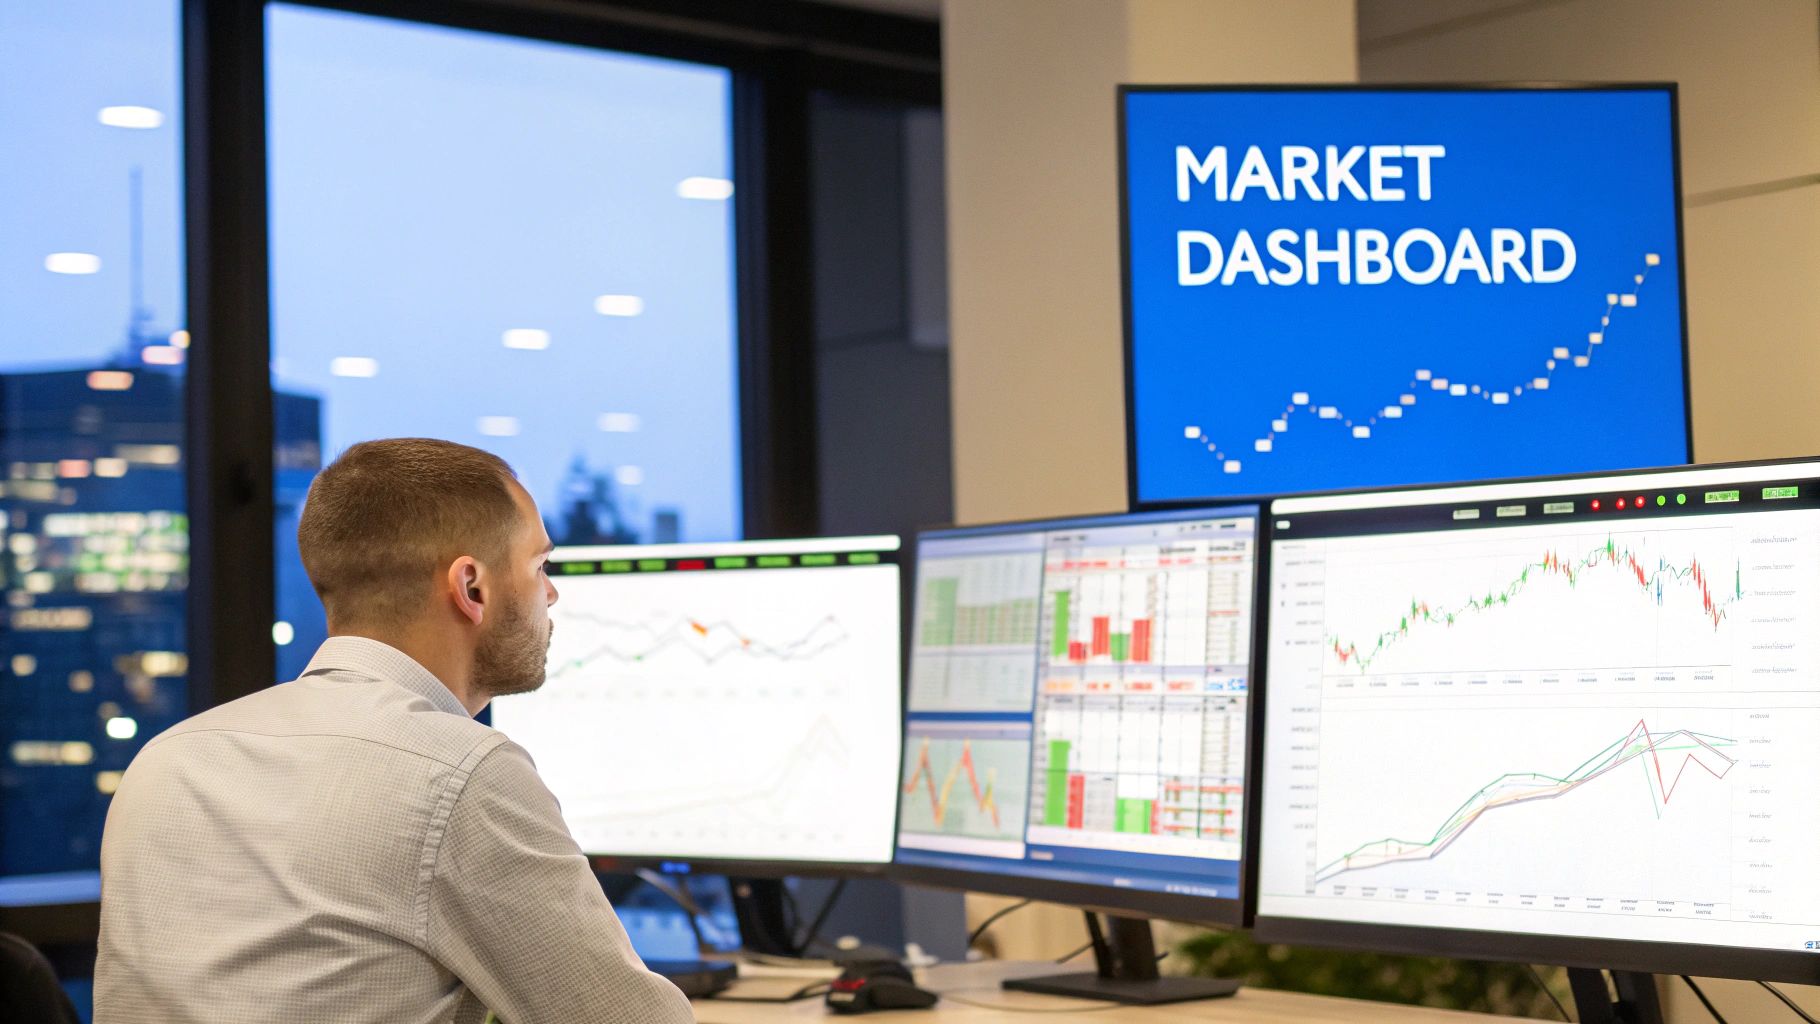
Trying to day trade without indicators is like driving a race car at night with no dashboard. Sure, you can feel the engine rumble, but you have no clue how fast you're going, how much fuel is left, or if the engine is about to overheat. In the fast-paced world of financial markets, guessing is a strategy that almost never ends well.
Technical indicators are your trading dashboard. They take the raw, chaotic price action you see on a chart and turn it into something you can actually use. They aren't a crystal ball, but they are instruments that measure market psychology and momentum, giving you the critical data needed to navigate the day.
Building a Foundation for Smart Decisions
This guide is built to demystify these powerful tools. We're going to skip the dry, textbook definitions and jump straight into how to use them in the real world. The goal is to give you a deep, practical understanding of how to read the signals related to:
- Trend Direction: Is the market heading up, down, or just chopping sideways?
- Momentum Strength: How much gas is behind the current price move?
- Volatility Levels: Is the market sleepy, or is it about to make a big, sharp move?
I’m not here to sell you a "magic formula" or a single "best" indicator. Success comes from learning how to combine the right tools to build a complete picture of what the market is doing. This is what allows you to make confident decisions about when to pull the trigger on a trade—and just as importantly, when to get out.
Think of each indicator as a specialist on your team. The trend indicator is your strategist, the momentum indicator is your scout, and the volume indicator confirms the strength of your intel. A single opinion is useful, but a consensus is powerful.
What You Will Learn
We’ll start by breaking down the core types of indicators to build a solid foundation. You have to understand the "why" behind each tool before the "how" makes any sense.
By the end, you'll see how to layer different indicators to confirm signals, filter out the market noise, and create a systematic way to analyze intraday charts. This framework is key to taking emotion out of your trading and building the discipline every consistent trader needs. Once you can read your "dashboard" correctly, you stop reacting to the market and start executing a clear, well-defined strategy.
To really get a handle on technical indicators for intraday trading, you first have to understand that each one has a specific job. Just throwing a bunch of tools on your chart is like building a race car pit crew where everyone only knows how to change tires—you end up with a mess. You need specialists for different tasks, and indicators are no different. They generally fall into four distinct categories.
Think of it like assembling a team of expert advisors. One tells you which way the market is heading, another measures the crowd's excitement, a third warns you about potential turbulence, and the last one confirms how much power is behind a move. Knowing their roles is the first step to building a solid trading plan instead of just chasing random signals.
Trend Indicators: Your Market Map
Trend-following indicators are your GPS, answering the most basic question for any trader: which way is the market going? Their whole purpose is to cut through the day-to-day price noise and chaos to reveal the underlying direction, whether that's up, down, or just chopping sideways.
For an intraday trader, these are non-negotiable. They help make sure you’re swimming with the current, not fighting against it. The classic example is the Moving Average (MA), which simply averages out the price over a certain number of periods. If the price is consistently staying above its moving average, you're likely in an uptrend. If it's hanging out below, you’re probably in a downtrend.
Momentum Indicators: Your Speedometer
While trend indicators show you the direction, momentum indicators tell you about the speed and strength of price moves. Picture the speedometer in your car. These indicators show how fast the price is accelerating or slowing down, which can be a huge clue for spotting potential turning points before they become obvious to everyone else.
These tools are absolutely critical for nailing your entries and exits. The Relative Strength Index (RSI), for instance, is a classic that bounces between 0 and 100. It's designed to flag overbought (usually above 70) or oversold (below 30) conditions. A high RSI reading during a strong rally might suggest the move is getting tired and could be due for a breather.
An intraday trader's edge often comes from identifying shifts in momentum. When price makes a new high but the momentum indicator fails to do so (a bearish divergence), it’s a powerful warning that the trend's underlying strength is fading.
Volatility Indicators: Your Weather Forecast
Volatility indicators act like a market weather forecast. They don't tell you which way the price is going, but they do tell you whether to expect calm seas or a choppy storm. This is vital information for managing your risk and knowing when to adjust your position size or strategy.
Bollinger Bands are a perfect example. They're made up of a moving average in the middle and two outer bands that get wider when volatility picks up and shrink when things get quiet. A period where the bands get really tight—what traders call a "squeeze"—often happens right before a massive price breakout, giving you a heads-up that a big move could be just around the corner.
Volume Indicators: Your Power Gauge
Finally, volume indicators are like the power gauge on an engine. They measure the amount of trading activity and conviction behind a price move. A rally on huge volume is seen as much more significant and trustworthy than a move that happens on barely any trading activity.
The Volume-Weighted Average Price (VWAP) is a favorite tool for many day traders. It calculates the average price a stock has traded at throughout the day, but it gives more weight to the price levels where more volume occurred. If the current price is trading above the VWAP line, it suggests that buyers are in control. If it's below, sellers are likely winning the battle.
Before we dive into specific examples, it helps to see how these categories fit together. Each one offers a different piece of the puzzle, and the best trading strategies often combine signals from multiple types.
Quick Guide to Intraday Indicator Categories
| Indicator Category | Primary Function | Common Examples |
|---|---|---|
| Trend | To identify the primary direction of the market (up, down, or sideways). | Moving Average (MA), MACD, Parabolic SAR |
| Momentum | To measure the speed and strength of price movements. | Relative Strength Index (RSI), Stochastic |
| Volatility | To gauge the magnitude of price swings and market choppiness. | Bollinger Bands, Average True Range (ATR) |
| Volume | To measure the trading activity and conviction behind a move. | On-Balance Volume (OBV), VWAP, Volume Profile |
As you can see, no single category tells the whole story. A trend indicator might say the market is up, but a momentum indicator could warn you it's running out of steam. That's why learning to use them as a team is where the real magic happens.
Essential Indicators for Trend and Momentum
Alright, enough with the theory. Let's get our hands dirty with the actual tools that form the backbone of countless intraday trading strategies. These are the workhorses you’ll find on the charts of professional traders day in and day out.
We’re going to focus on three of the most trusted technical indicators for intraday trading: Exponential Moving Averages (EMAs), the Relative Strength Index (RSI), and the Moving Average Convergence Divergence (MACD).
My goal here isn't to bog you down with complex math. Instead, we'll zero in on what really matters for a day trader: learning to read the story the chart is telling you. You’ll see how to spot momentum shifts, identify when a stock is stretched too far, and confirm the trend you're trading with.
Understanding Exponential Moving Averages
First up is a classic trend-following tool: the Exponential Moving Average (EMA). Think of a simple moving average as a basic rearview mirror—it shows you the average price over a set period. An EMA is more like a smart rearview mirror; it still looks back, but it gives much more weight to what just happened.
This makes EMAs far more responsive to sudden price changes, which is a massive advantage in the fast-and-furious world of intraday trading. When the market turns on a dime, you want an indicator that reacts now, not one that's still hung up on old, irrelevant price data.
A battle-tested intraday strategy is to use two EMAs together—a short-term one (like a 9-period EMA) and a longer-term one (like a 21-period EMA).
- Bullish Crossover: When the faster 9-period EMA crosses above the slower 21-period EMA, it's a sign that recent upward momentum is building. Many traders see this as a green light to buy.
- Bearish Crossover: Conversely, when the 9-period EMA dives below the 21-period EMA, it signals that downside momentum is taking control. This is often interpreted as a sell signal.
EMAs also serve as dynamic support and resistance levels. In a strong uptrend, you’ll often see the price pull back to the 21-period EMA and "bounce" before continuing its climb. This can offer a great, low-risk spot to jump into an existing trend.
Decoding Momentum with the Relative Strength Index
Next, we have the Relative Strength Index (RSI), probably the most famous momentum oscillator out there. The RSI measures the speed and magnitude of price movements, plotting them on a scale from 0 to 100. Its main job is to tell you when a stock might be getting overextended and is due for a breather or a reversal.
Think of it like a rubber band. The more you stretch it, the more tension builds, and eventually, it’s going to snap back. The RSI helps you measure that tension in the market.
The textbook interpretation of RSI revolves around two key levels: 70 and 30. A reading above 70 suggests an asset is overbought—it’s gone up too far, too fast, and might be ready for a pullback. A reading below 30 suggests it is oversold and could be due for a bounce.
But here’s a rookie mistake: selling the second RSI hits 70 or buying the moment it touches 30. In a monster trend, RSI can stay "overbought" or "oversold" for a long time while the stock keeps running. A much savvier approach is to wait for the RSI to cross back inside these zones—for example, waiting for it to drop back below 70 before even thinking about a short. This simple filter can keep you from jumping out of a strong trend way too early.
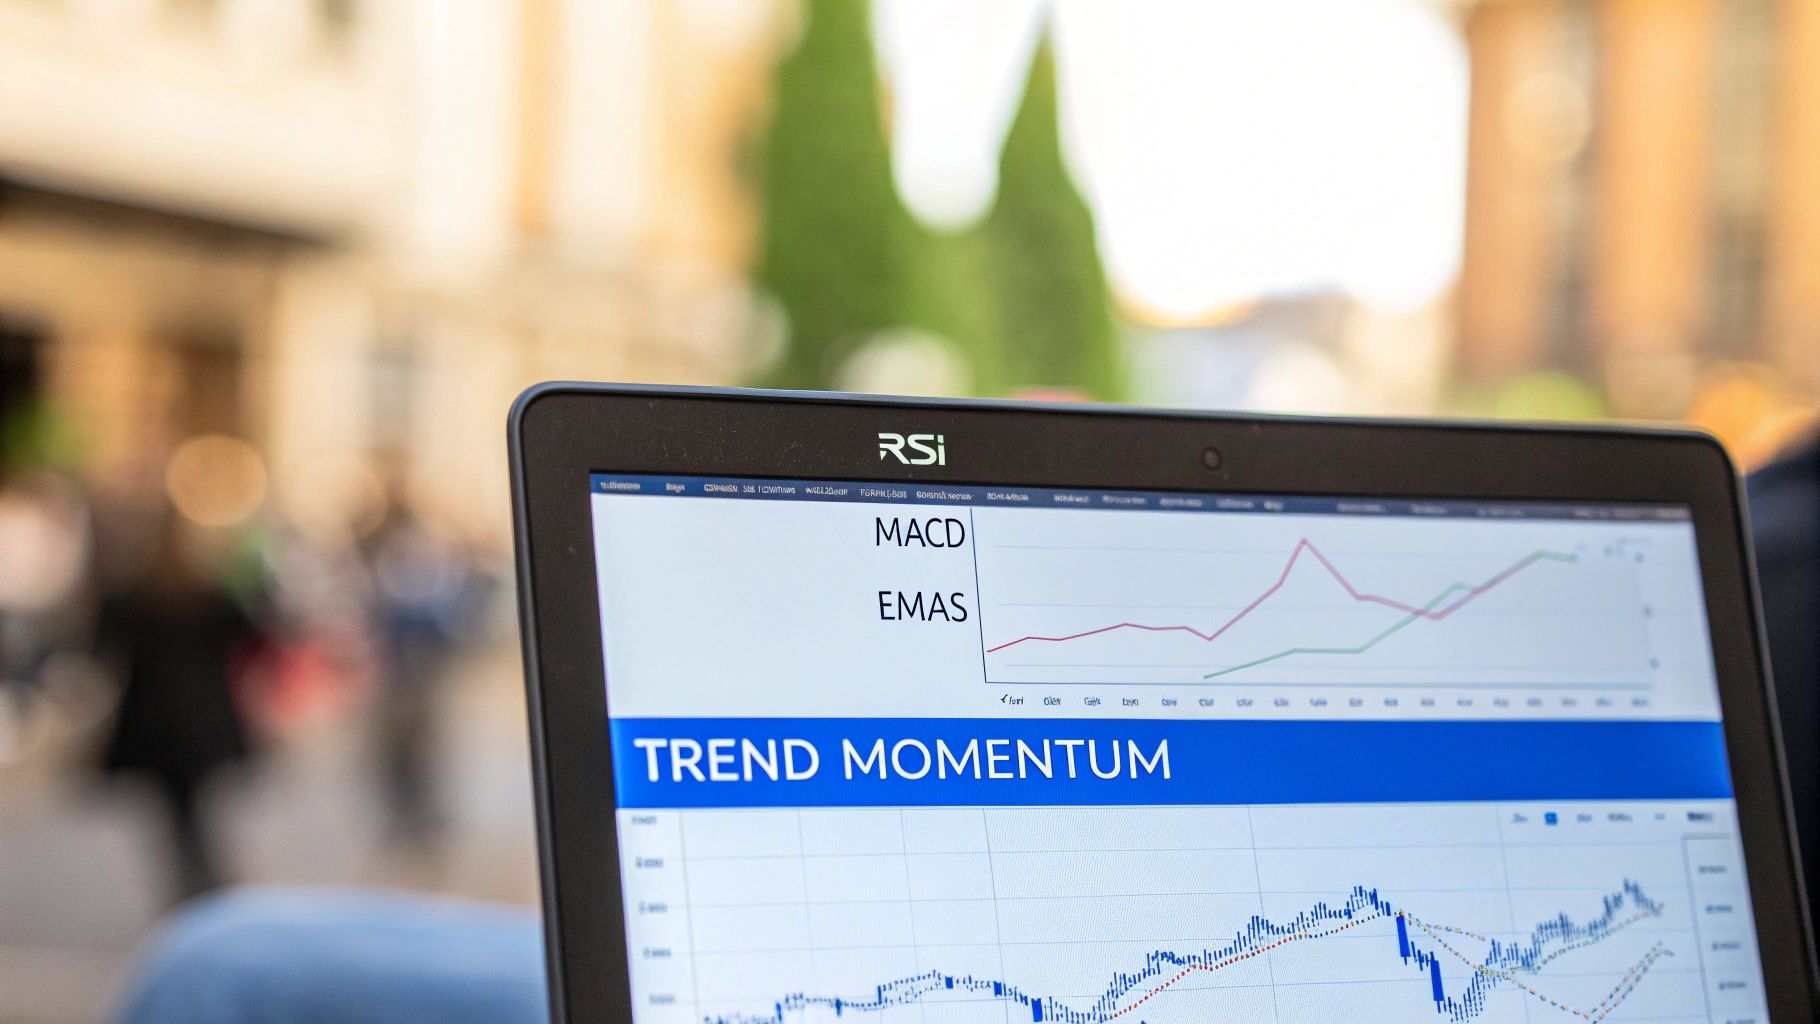
Identifying Trend Shifts with MACD
The Moving Average Convergence Divergence (MACD) is a true jack-of-all-trades, blending both trend-following and momentum into one indicator. It’s made up of three parts that you’ll see on your chart:
- The MACD Line: This is the heart of the indicator. It’s calculated by subtracting the 26-period EMA from the 12-period EMA.
- The Signal Line: This is simply a 9-period EMA of the MACD line itself. It’s a smoothed-out version that acts as a trigger for trade signals.
- The Histogram: This visualizes the distance between the MACD and signal lines. When the bars are above zero, buyers are in control. When they're below, sellers have the upper hand.
The most common signal is the crossover. When the MACD line crosses above the signal line, it’s a bullish signal suggesting momentum is turning positive. When it crosses below, it’s a bearish signal. These crossovers often give you an early heads-up about potential trend changes, making the MACD a favorite among technical indicators for intraday trading. For more on volume-based signals, check out our guide on VWAP trading strategies.
Using Indicators in the Real World
While each of these indicators is useful on its own, they become truly powerful when you use them together for confirmation. For instance, imagine a bullish MACD crossover happens just as the RSI is climbing out of oversold territory. If the price is also trading firmly above its key EMAs, you now have multiple, independent signals all pointing in the same direction. This confluence dramatically boosts the probability of a successful trade.
And this isn't just anecdotal. A study digging into over 100 years of Dow Jones data found that indicators like the RSI and EMA consistently offered a statistical edge. The research showed that while no single indicator is a magic bullet, combining reliable tools like the RSI with trend-followers like the EMA can build a much more robust strategy. This historical validation proves that when used correctly, these classic indicators are still incredibly relevant in today's markets.
How to Read Volatility and Volume Signals
Trend and momentum indicators are great for telling you which way the market is heading and how fast it's getting there, but that’s only half the story. To really get the full picture, you need to understand two other massive forces at play: volatility and volume.
Think of volatility as the market's mood. Is it calm and predictable, or is it throwing a tantrum with wild, unpredictable swings? Volume, on the other hand, is the conviction behind those moves. A big price jump on low volume is suspicious, but a breakout with a huge surge in volume? That's a move with power behind it.
In this section, we'll break down two powerhouse technical indicators for intraday trading built to measure these forces: Bollinger Bands and the Volume-Weighted Average Price (VWAP). Adding these to your toolkit gives you a critical layer of confirmation, helping you sidestep false breakouts and trade with way more confidence.
Measuring Market Mood Swings with Bollinger Bands
Created by the legendary analyst John Bollinger, Bollinger Bands are a brilliant tool for seeing volatility on your chart. They won't predict which way the price will go, but they do an amazing job of showing you how wide or narrow the expected range of price movement is. This makes them an incredible "weather forecast" for intraday conditions.
The indicator is pretty simple, made up of three lines drawn over your price chart:
- A Middle Band: Just a standard 20-period Simple Moving Average (SMA) that acts as a baseline for the trend.
- An Upper Band: This is set two standard deviations above the middle band.
- A Lower Band: This line is set two standard deviations below the middle band.
Don't let "standard deviation" scare you; it's just a statistical way to measure how spread out prices are. When volatility kicks up and prices are all over the place, the bands automatically get wider. When the market chills out and prices trade in a tight range, the bands contract and squeeze closer together.
The Bollinger Band Squeeze: A Warning of Big Moves
One of the most powerful signals you can get from Bollinger Bands is the "squeeze." This is when the bands get incredibly narrow, telling you that volatility has dried up completely. Think of it like a coiled spring—the longer it stays compressed, the more explosive the move will be when it finally releases.
A Bollinger Band squeeze is a clear signal that the market is consolidating and building up energy. Intraday traders live for these squeezes because they almost always lead to a major breakout. You don't know which way it'll break, but the squeeze is your heads-up to get ready for action.
When the price finally punches through this tight range with a strong candle, it often kicks off a powerful new trend. This gives you a crystal-clear entry signal right as the momentum is starting, letting you place a tight stop-loss just on the other side of the squeeze.
Using the Bands as Dynamic Support and Resistance
The outer bands also act as dynamic, constantly adjusting levels of support and resistance. Because they're based on standard deviation, roughly 90% of all price action should, in theory, happen between the upper and lower bands.
This means when the price tags the upper band, you can consider the stock relatively expensive or "overbought" on a short-term basis. When it hits the lower band, it’s seen as relatively cheap or "oversold."
But hold on—this doesn't mean you should blindly sell every time the price touches the top or buy when it hits the bottom. In a ripping hot trend, the price can "ride the band" for a long time. A much smarter play is to wait for confirmation, like seeing a bearish candlestick pattern form at the upper band before even thinking about a short trade.
Understanding Conviction with VWAP
Alright, let's switch gears from volatility to volume with the Volume-Weighted Average Price (VWAP). A normal moving average only cares about price. VWAP is different; it cares about price and how much volume was traded at each of those prices. It’s essentially the true average price of a stock for the day, weighted by trading activity.
VWAP shows up as a single line on your chart that resets every single morning. It's a massive benchmark for institutional traders—the big funds that have to move huge positions without spooking the market. They often try to execute their trades near the VWAP to make sure they're getting a "fair" price.
Because of this, the VWAP line often becomes a major intraday pivot point. It acts like a magnet for price.
Using VWAP as an Intraday Benchmark
For day traders, VWAP offers a simple but incredibly powerful rule of thumb for judging the intraday trend and overall market sentiment.
- Price Above VWAP: If the price is trading above the VWAP line, it’s a good sign that buyers are in charge and the daily sentiment is bullish.
- Price Below VWAP: When the price is trading below VWAP, it suggests sellers have the upper hand and the sentiment is bearish.
Many day traders use VWAP as a filter for their trades. They’ll only look for long setups when the price is above VWAP, and they’ll only consider shorting when it’s below. Better yet, the VWAP line itself often acts as dynamic support or resistance. A classic strategy is to wait for the price to pull back to the VWAP in an uptrend, watch for a bounce, and then jump into a long position. This keeps your trades aligned with the big money flow for the day.
Of course, understanding volume goes way beyond VWAP. If you really want to see how volume spikes can confirm breakouts, you should also master the relative volume indicator as a powerful complementary tool.
When you start pairing these volatility and volume indicators with the momentum tools we talked about earlier, you build a much more robust trading framework. For instance, seeing the RSI creep into the overbought zone just as the price hits the upper Bollinger Band is a far stronger signal than either indicator would give you alone. Throwing in VWAP as a final check ensures you’re trading with the dominant sentiment of the day, stacking the odds firmly in your favor.
Combining Indicators for a Cohesive Strategy
Think of individual technical indicators as specialists on a team. Each one has a specific skill and offers valuable insight, but their real power comes out when they work together. Relying on just one indicator is like making a big decision based on one person's opinion—it's just plain risky. The best intraday traders learn to combine different types of indicators to confirm signals, filter out the market's random noise, and build a much more reliable picture of what's actually going on.
This approach is called confluence, and it's the absolute cornerstone of any robust trading strategy. It’s the simple practice of looking for multiple, non-correlated signals that all point to the same conclusion. When your trend, momentum, and volume indicators all line up, the probability of a successful trade shoots way up.
Building a Multi-Layered Trading Plan
Let's get out of theory and walk through a real-world example to see how this plays out. Imagine you're watching a stock that looks like it's in a strong uptrend. Instead of just jumping in, you'd use a multi-indicator checklist to make sure the opportunity is solid.
Here’s a step-by-step look at a confirmation-based entry strategy:
-
Trend Confirmation (The Big Picture): First things first, you need to confirm the primary trend. You could use a 21-period Exponential Moving Average (EMA). As long as the price is consistently holding above this EMA, you can consider the short-term trend bullish. This is your foundational green light.
-
Entry Timing (The Pullback): Next, you need a trigger for your entry. You wait for the price to pull back toward the 21 EMA. At the same time, you're watching the Relative Strength Index (RSI). As the price dips, you want to see the RSI fall toward oversold territory (near the 30 level), which signals that the selling pressure on this little dip might be running out of steam.
-
Final Checkpoint (Volume Confirmation): Before pulling the trigger, you look for one last piece of evidence from a volume-based indicator like the Volume-Weighted Average Price (VWAP). You wait for the price to find support at the EMA, bounce, and then cross back above the VWAP line. This crossover is a great tell that institutional buyers are likely stepping back in and supporting the price.
Only when all three of these conditions are met would you enter the trade. This kind_of systematic process helps you sidestep emotional decisions and makes sure every trade is backed by a convergence of evidence.
This infographic gives a simple visual for how to confirm a trade using volatility and volume.
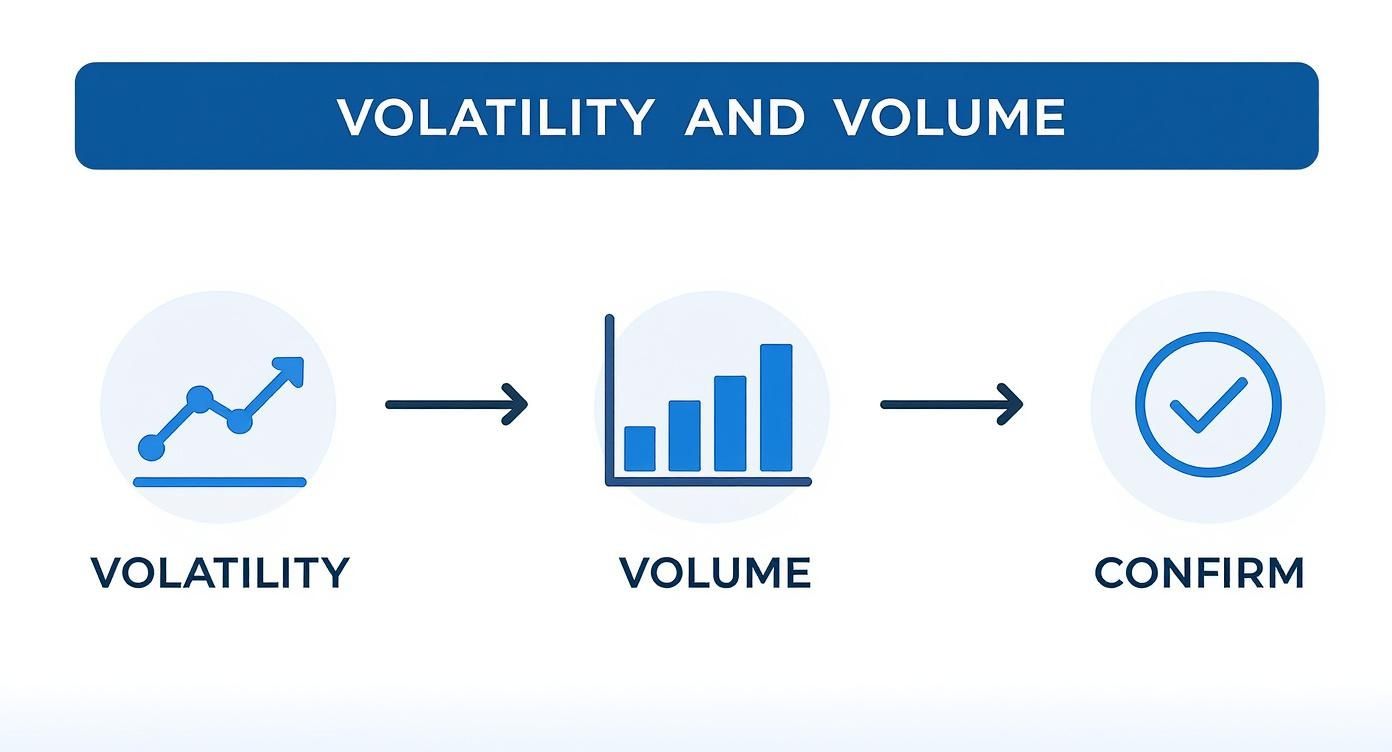
The key takeaway from this visual is that after you spot initial signals, a final confirmation step is what ties the whole strategy together.
The Critical Role of Backtesting
Developing a strategy like the one above is a great start, but it’s completely useless without one final, critical step: backtesting. It doesn’t matter how logical a strategy seems in your head. You must validate it against historical data to see how it would have performed in the past. It's the only way to build genuine confidence in your plan.
Backtesting is your trading simulator. It lets you fly your strategy through different market conditions—bull markets, bear markets, and choppy periods—to see where it excels and where it breaks down.
This process gives you the statistical proof and mental toughness needed to execute your plan flawlessly when real money is on the line.
Fortunately, getting the data for rigorous backtesting is easier than ever. As of 2025, you can get comprehensive datasets for over 15,767 global stock tickers, with detailed 1-minute price and volume data that, for many stocks, goes back more than two decades. This wealth of information allows traders to test and refine their use of technical indicators for intraday trading with scientific precision. You can learn more about the historical data available for traders at FirstRateData.com.
Ultimately, combining indicators and validating your approach through backtesting is what transforms trading from a game of guesswork into a disciplined, repeatable process.
Common Mistakes Traders Make with Indicators
Getting a handle on how to use technical indicators for intraday trading is only half the battle. Just as important is knowing the common traps that snag new and even seasoned traders, turning these powerful tools into a source of costly mistakes.
One of the biggest pitfalls is "analysis paralysis." This is what happens when a trader's chart becomes a chaotic mess of indicators—multiple moving averages, RSI, MACD, and Bollinger Bands all screaming for attention at once. Instead of getting clarity, you get noise, and the conflicting signals can freeze you from making any decision at all.
Another classic blunder is blindly following a single indicator's signal without looking for any backup. Just because the RSI dips into oversold territory doesn't mean it's an automatic buy signal. In a powerful downtrend, the RSI can stay pinned in that "oversold" zone for a long, painful time while the price just keeps falling.
Over-Reliance on Technicals Alone
A huge—and expensive—mistake is getting so lost in your charts that you forget about the real world. Major news events, earnings reports, or a sudden economic data release can blow up the most perfect technical setup in an instant. Remember, an indicator is just a reflection of past price action; it can't predict a future shock from the fundamentals.
Think about it: a beautiful bullish crossover on your MACD means absolutely nothing if the company announces terrible earnings guidance a moment later. The price is going to react to the news, not your indicator. The best intraday traders always keep one eye on their charts and the other on an economic calendar.
The market doesn't care about your indicators. It cares about supply, demand, and news. Indicators are simply a lens to interpret market psychology, not an unbreakable set of rules.
Misunderstanding Market Context
Finally, a very common error is failing to match your indicators to the current market environment. If you're using a trend-following strategy with moving averages in a sideways, range-bound market, you're going to get chopped to pieces with false signals. On the flip side, using an oscillator like the RSI in a market that's trending hard will give you one bad signal after another.
Simply knowing whether the market is trending or consolidating is a skill in itself. The most effective traders know which tool to pull out of the toolbox for the specific job at hand, rather than trying to use the same hammer on every single setup.
To steer clear of these traps, you need a disciplined game plan:
- Keep It Simple: Start with just two or three indicators that complement each other. A trend indicator, a momentum oscillator, and a volume tool is a classic, powerful combination.
- Seek Confluence: Never, ever act on a single signal. Always look for confirmation from another indicator or, even better, from the price action itself.
- Know the Context: Stay plugged into the broader market sentiment and be aware of any upcoming news that could throw a wrench in your trade.
Bringing in some statistical analysis can also give you a serious edge. Studies on intraday patterns have shown that volume and price range can change depending on the day of the week, which directly impacts how well your technical signals work. On high-volume days, for example, moves are often more sustained, meaning fewer of the false breakouts that frustrate traders on quieter days. When you start focusing on these statistically better conditions, you move from guesswork to an evidence-based strategy. You can learn more about how to use statistical analysis for your trading on NinjaTrader.com.
With ChartsWatcher, you can backtest your strategies across various market conditions and customize your dashboards with the exact indicators you need, helping you avoid chart clutter and build a disciplined, data-driven trading plan. Explore our advanced tools at https://chartswatcher.com.
