A Practical Guide to VWAP Strategy Trading
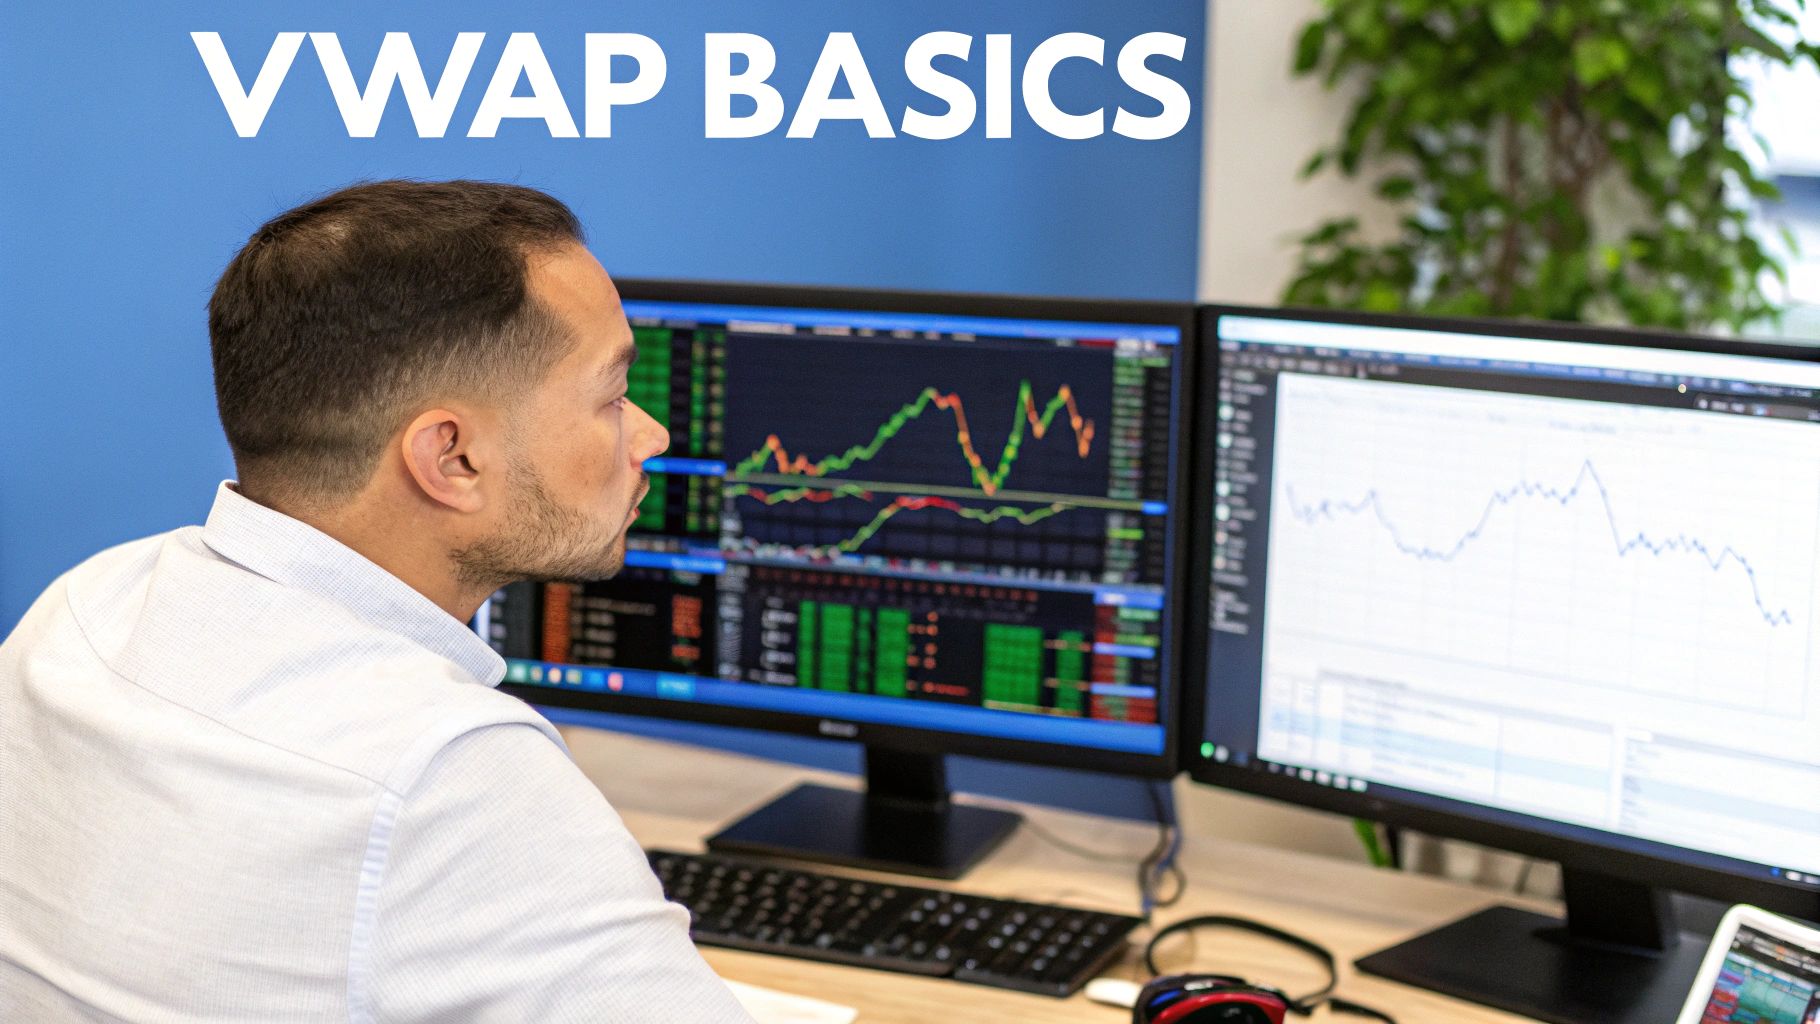
A trading strategy built around VWAP uses the Volume-Weighted Average Price as its core benchmark for making sharp intraday decisions. Unlike a simple moving average, VWAP is weighted by volume, giving you a much clearer picture of the true average price paid for a stock during the day. Traders lean on it to gauge fair value, sniff out institutional footprints, and time their entries and exits with greater precision.
What Is VWAP And Why Does It Matter?
Think of the Volume-Weighted Average Price (VWAP) as more than just another line on your chart. It's a dynamic, real-time benchmark that shows you the market's consensus on value for that specific day. It’s like a moving average that’s been seriously supercharged. While a Simple Moving Average (SMA) only considers price, VWAP factors in both price and volume. That distinction makes all the difference.
The calculation is straightforward but powerful: it takes the total price multiplied by volume and divides it by the total volume for the day. This means that price levels with heavy trading activity have a much stronger influence on the VWAP line. As a result, the indicator gives you a far more honest look at a stock's average price relative to where the real money is flowing.
The Institutional Footprint
One of the biggest reasons VWAP gets so much respect is its heavy use by institutional players. Massive funds—we're talking pension funds, mutual funds, and hedge funds—are often judged by their ability to execute huge orders without moving the market or overpaying. Their goal is simple: buy below the daily VWAP or sell above it. Hitting that target proves they got a good deal compared to the rest of the market.
This institutional behavior is what creates such clear signals for retail traders like us. When you see a stock's price holding firmly above the VWAP line on big volume, it’s a strong hint that large buyers are stepping in and accumulating shares. On the flip side, a price that keeps getting rejected at the VWAP line can signal that institutions are unloading their positions.
VWAP acts as a real-time barometer for intraday market sentiment. A price trading above VWAP is generally considered bullish for the day, while a price below it is bearish. The VWAP line itself frequently becomes a dynamic support or resistance level.
VWAP's Role In Algorithmic Trading
The VWAP trading strategy was really formalized in the early 2000s as algorithms were designed to align massive trades with the market's volume-weighted average. The main goal was to minimize market impact—and the associated costs—by slicing up big orders into smaller chunks. These chunks are then executed in proportion to the day's expected volume patterns. This approach aims to get an execution price as close to the market's VWAP as possible, avoiding costly slippage. If you want to go deeper, there's some great research on execution algorithms that breaks down the math.
Because of this institutional foundation, most VWAP trading plans boil down to a few core principles:
- Mean Reversion: This is when you enter a trade after the price has strayed too far from the VWAP, betting it will snap back toward the average.
- Trend Following: Here, you use a clean break and hold above (for longs) or below (for shorts) the VWAP as confirmation that a new intraday trend is in play.
- Liquidity Gauge: VWAP helps you spot periods of high volume where large orders can be filled without causing wild price swings.
By understanding how the big players use this tool, you can start building your own trading rules around this incredibly powerful, volume-driven benchmark. It cuts through the noise of simple price action and gives you an objective measure of value.
Building Your First VWAP Trading Strategy
Alright, now that you've got a handle on what VWAP is, let's get down to business and turn that theory into a real trading plan. The magic of a good VWAP strategy lies in setting crystal-clear, objective rules. We’re going to build out two of the most common and effective approaches using ChartsWatcher: mean reversion and trend following.
Each of these strategies sees the VWAP line in a totally different way. Mean reversion guys treat it like a magnet, betting that the price will always snap back to it after straying too far. On the other hand, trend followers use it as a line in the sand to confirm which way the intraday momentum is flowing.
Designing a Mean Reversion Strategy
The whole idea behind mean reversion is that price can only stretch so far from its average before it has to snap back. In our case, that average is the VWAP. This strategy absolutely loves to feast on short-term overextensions.
The rules are beautifully simple:
- Buy Signal: The price takes a nosedive far below the VWAP. This suggests the stock is "oversold" for the day and ripe for a bounce.
- Sell Signal: The price rockets far above the VWAP, signaling it might be "overbought" and due for a pullback.
So, how do we define "far"? That's where VWAP deviation bands come in. Think of them like Bollinger Bands, but anchored to the VWAP. A common setup is to use bands set at one or two standard deviations. If you want more action, a 1-standard deviation band will give you more signals. A 2-standard deviation band will be more patient, but the signals it fires are often much stronger.
My Two Cents: Be careful with mean reversion in a market that's ripping in one direction. What looks "overextended" could just be the start of a massive trend. I find this strategy works best in choppy, range-bound markets where the price is just dancing around the VWAP all day.
Building a Trend Following Strategy
The trend-following VWAP strategy is the polar opposite. Instead of betting on a return to the average, you’re betting that a breakout away from the average is the start of a new, durable intraday trend.
Here’s the logic:
- Buy Signal: The price punches through the VWAP to the upside and—this is key—stays there. Often, you'll see it come back to retest the VWAP line as a new support level. This is a classic sign that buyers have taken control.
- Sell Signal: The price breaks below the VWAP and holds beneath it. It might pop back up to test the VWAP as resistance before heading lower. This tells you the sellers are now in charge.
The name of the game here is confirmation. A simple touch of the VWAP isn't enough to pull the trigger. You want to see the price prove itself on one side of the line. For instance, a solid rule might be: "Go long only if the price closes above VWAP for three straight 5-minute candles."
This graphic breaks down the simple but powerful calculation behind the VWAP indicator.
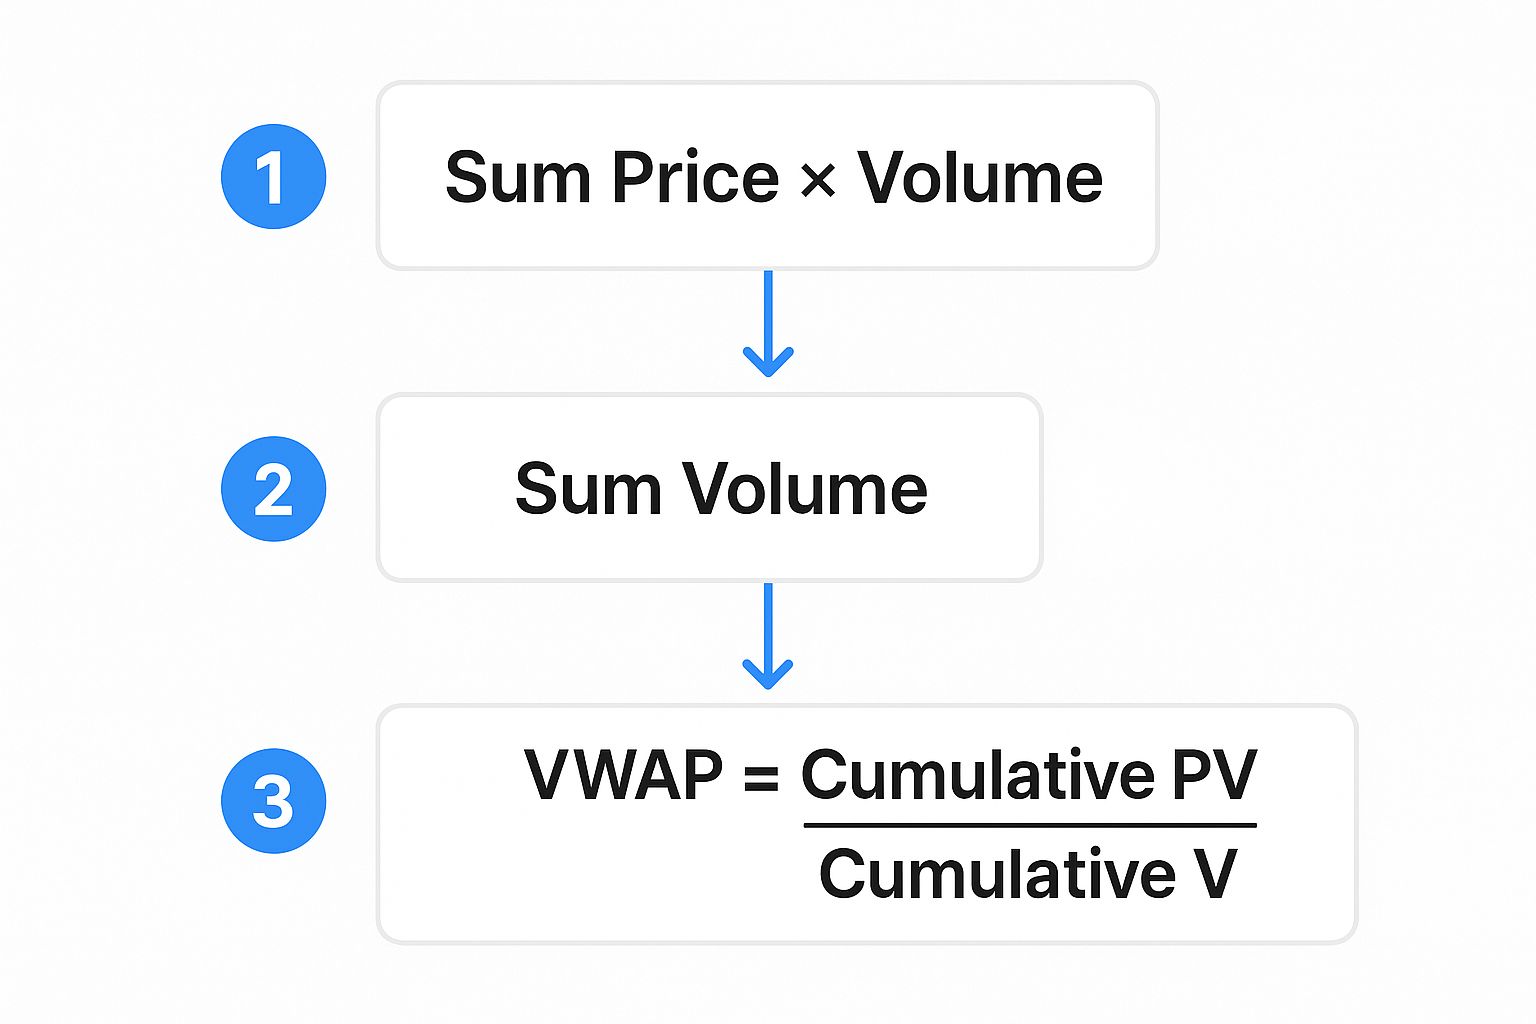
As you can see, VWAP is just a running calculation of the total dollar value traded divided by the total shares traded. It gives you the true average price, weighted by volume.
Setting Up Your Rules in ChartsWatcher
Now for the fun part: let's translate these ideas into real, actionable rules inside the ChartsWatcher platform. The customizable alert system is perfect for building out a precise VWAP strategy without having to stare at the screen all day.
Your dashboard can be set up to monitor VWAP levels, your custom alerts, and any other indicators you use for confirmation, all in one clean view.
Example Mean Reversion Setup:
- First, add the VWAP indicator to your chart along with upper and lower bands set to 1.5 standard deviations.
- Next, create your first alert. Condition (Long):
Pricecrosses below theVWAP Lower Band. - Then, set up the second alert. Condition (Short):
Pricecrosses above theVWAP Upper Band.
Example Trend Following Setup:
- Just add the standard VWAP line to your chart. No bands needed for this one.
- Set your long alert:
Pricecrosses aboveVWAP. But add a second condition: theCloseof the last 2 candles must also be aboveVWAP. - Create the short alert:
Pricecrosses belowVWAP, with the same confirmation logic: theCloseof the last 2 candles must have remained belowVWAP.
These are just starting points, of course. The real edge comes from testing, tweaking, and layering in other filters to fit your style. If you want to dive deeper, you can explore some expert VWAP trading strategy techniques that the pros use. Building a system that works for you is a process, but it's well worth the effort.
Refining Your Entry And Exit Points
Having a basic VWAP crossover strategy is a decent starting point, but let's be honest—it's not enough to be consistently profitable. The market is an expert at throwing false signals designed to shake you out of good trades or lure you into bad ones.
This is where the real work begins. We need to evolve from simply watching a line get crossed to building a disciplined system for exactly when to get in and, just as crucially, when to get out.
The goal here isn't to overcomplicate things. It's to build a set of clear, repeatable rules that filter out the market noise. We'll do this by layering in a couple of confirming indicators and establishing a rock-solid risk management plan. Think of it like adding a high-quality filter to your camera lens—it brings the important details into sharp focus while blurring out the junk.
Adding Confluence With Secondary Indicators
Relying solely on the price crossing the VWAP line is a recipe for getting chopped up. You absolutely need a secondary source of confirmation, another indicator that agrees with your primary signal. This concept is known as confluence, and it's what separates high-probability setups from coin flips.
A classic and incredibly effective partner for VWAP is the Relative Strength Index (RSI). The RSI is a momentum oscillator; it tells you if an asset is getting overbought or oversold. By combining the two, you create a powerful filter.
- Long Entry Rule: Price closes above the VWAP AND the 14-period RSI is below 70. This simple check stops you from chasing a wildly overextended, parabolic move that's about to slam back down.
- Short Entry Rule: Price closes below the VWAP AND the 14-period RSI is above 30. This keeps you from piling into a short on a stock that's already dumped and is due for a relief bounce.
Another fantastic tool for confluence is the Volume Profile. This indicator shows you exactly where the most volume has traded at specific price levels. Imagine you see the price break above VWAP, and that VWAP line happens to align perfectly with a high-volume node from the Volume Profile. That signal just became exponentially stronger because you now know it's a proven area of interest for other big players.
By demanding that two independent indicators agree, you effectively sidestep a huge percentage of false signals. It forces patience and discipline, which are the cornerstones of any successful vwap strategy trading plan.
Mastering Your Exits With Dynamic Stop-Losses
Great entries get you into the game, but smart exits are what pay the bills. One of the most practical ways to manage risk with a VWAP strategy is to use the VWAP line itself as a dynamic stop-loss. Since it often acts as a natural level of support or resistance, it’s the perfect intuitive guide for placing your stops.
So, you enter a long position after the price breaks above VWAP and holds. Where does your stop go? A common rookie mistake is to place it at some random percentage or dollar amount away from your entry. A far better approach is to place your initial stop-loss just below the VWAP line.
But you don't just leave it there. As the price moves in your favor, you can create a trailing stop that manually or automatically follows the VWAP line upward. This accomplishes two critical things:
- It Protects Your Capital: If the trade turns sour and violates the VWAP, you're taken out for a minimal, predefined loss. No second-guessing.
- It Locks in Profits: As the trade works, your trailing stop moves up, ensuring you walk away with something even if the trend suddenly reverses.
This method turns risk management from a guessing game into a systematic process. The market itself is telling you where the line in the sand is. This is why VWAP strategies are often most successful in trending intraday markets—they thrive when paired with this kind of strict risk management. For instance, you might enter a short when a stock drops below VWAP at $27.10 and set a tight stop-loss just $0.20 above it, using the VWAP as a clear resistance benchmark. You can find more insights on VWAP entry tactics that reinforce this exact principle.
How to Properly Backtest Your VWAP Strategy
A finely tuned VWAP strategy looks great on paper, but trading it without seeing how it held up in the past is just gambling. You're flying blind. This is where backtesting comes in, turning your hunch into a data-driven system.
Let's walk through how to do this right using the ChartsWatcher backtesting engine. The goal isn't just to see if it made money. We need to understand its personality. How did it handle wild, volatile days? What was the most painful drawdown it suffered? Answering these questions now saves you from learning those lessons the hard way—with real money on the line.
Setting Up Your Backtesting Environment
First things first, you need to define the playground for your test. A classic rookie mistake is testing on a single, cherry-picked stock that went on a monster run. That proves nothing. For a robust VWAP strategy, you need a broad, liquid market that’s seen a bit of everything.
For our example, let's use S&P 500 futures (ES) or the SPY ETF over the last three to five years. Why that timeframe? Because it includes raging bull runs, gut-wrenching corrections, and boring sideways chop. It’s the perfect obstacle course for your strategy.
Inside ChartsWatcher, you’ll want to dial in these parameters:
- Asset: SPDR S&P 500 ETF (SPY)
- Timeframe: 5-minute chart (a sweet spot for most intraday VWAP plays)
- Date Range: January 1, 2020, to December 31, 2023
- Commission & Slippage: Be realistic here. Something like 0.01% for commissions and 1 tick for slippage will simulate real-world trading costs.
Seriously, don't skip the costs. Ignoring them is the fastest way to get a fantasy backtest result that will fall apart in live trading. Those tiny frictions add up fast over hundreds of trades.
Interpreting the Key Performance Metrics
Once the backtest is done, ChartsWatcher will spit out a detailed report. It's easy to get lost in the sea of numbers, so let's focus on the "big three" that really tell the story.
When you run a backtest in ChartsWatcher, these are the critical performance metrics to analyze. This table breaks down what each one tells you about your strategy's viability.
| Performance Metric | What It Measures | A Good Target to Aim For |
|---|---|---|
| Profit Factor | The ratio of gross profit to gross loss. It answers: "For every dollar I lost, how many did I make?" | 1.75 or higher. A result of 2.0 means you made $2 for every $1 lost. |
| Sharpe Ratio | Your return adjusted for risk (volatility). A high Sharpe Ratio means you're getting paid well for the risk you're taking. | Above 1.0. A strategy with smoother returns can have a better Sharpe than one with wild swings, even if the total profit is lower. |
| Maximum Drawdown | The biggest peak-to-trough drop in your equity curve. This is the "gut-check" metric. | Under 20% is ideal, but it depends on your personal risk tolerance. Could you stomach a 30% drop without abandoning the system? |
Drilling down into these metrics gives you a much clearer picture than just looking at the final P&L. If you need a more detailed breakdown, our essential guide on how to backtest a trading strategy goes even deeper.
Avoiding the Curve-Fitting Trap
After your first backtest, the temptation is immediate: "Let me just tweak this one setting to make it better." Be very, very careful. This is the slippery slope to curve-fitting, where you optimize a strategy so perfectly to past data that it becomes useless in the future.
A backtest report is not a guarantee of future results; it's a character assessment of your strategy. The goal is to find a robust system that performs reasonably well across various conditions, not a "perfect" one that only works on a specific historical dataset.
For instance, if your results are mediocre, don't just change your RSI filter from 14 to 12 because it bumps the profit factor by 5%. That's a fragile "fix." Instead, ask bigger questions. Does adding a volume filter make the trades more consistent? Is the strategy getting chopped up during low-volatility days?
This approach is backed by statistical analysis. Backtests on SPY using a simple mean reversion logic—buying on a close below the VWAP and selling on a close above it—have often shown a positive edge over long periods. These studies confirm that VWAP can be a powerful anchor, but only if the rules are robust and not over-optimized. Making data-driven tweaks based on broad principles is what builds a strategy that lasts.
Deploying and Managing Your Live Strategy
You’ve done the hard work, your backtest looks solid, and now the real fun begins. The temptation is to immediately flip the switch and go live with your full position size. I’ve seen it a hundred times, and it’s usually where a promising strategy dies a quick death.
Let's be clear: the transition from the clean, theoretical world of backtesting to the messy reality of live markets is a minefield. Your goal now isn't just to make money; it's to prove your system can actually survive out in the wild without blowing up your account.
This final phase is all about building a sustainable process. We're going to cover how to ease into live trading, set up your alerts so you’re not glued to the screen, and most importantly, develop the discipline to let your strategy do its job without you constantly meddling.
Start Small to Win Big
Before you risk any significant capital, you must observe your strategy in its natural habitat. The live market throws curveballs a backtest can never fully account for—things like slippage during a news spike or a slightly delayed fill that throws off your entry.
There are two smart ways to handle this crucial validation phase:
- Paper Trading: This is the safest route, hands down. Run your strategy in a simulated account for at least a few weeks. The point here isn't to rack up fake profits; it’s to see if you can follow your rules without hesitation and to confirm the strategy behaves as you expect under real market conditions.
- Reduced Position Sizing: If you’re confident, you can use real money but at a fraction of your normal size. Think 10-25% of a full position. This is great because it introduces the psychological pressure of having real skin in the game while keeping any potential losses small and manageable.
Treat this period as your final shakedown cruise. It’s designed to expose any cracks in your plan—and more importantly, in your own discipline.
Configure Your Live Trade Alerts
Staring at charts all day waiting for a setup is not a sustainable way to trade. It’s a fast track to burnout, missed entries, and emotional mistakes. This is exactly where you let ChartsWatcher become your eyes and ears on the market.
Set up your alerts to ping you via email, a desktop notification, or even a webhook that connects to an automated execution platform. The key is to make your alerts crystal clear, telling you exactly what action to take.
Pro Tip: Don't create a generic alert like "SPY crossed above VWAP." That’s useless when you’re under pressure. A much better, more actionable alert would be: "Potential LONG Entry: SPY closed above VWAP on 5min chart. RSI is below 70. Consider entry with stop below VWAP." This context removes all ambiguity.
This simple step transforms you from a hunter, frantically searching for trades, into a fisherman who has already set the lines and is just waiting for a bite. It’s a far more disciplined and less stressful way to operate.
Know When to Tune and When to Trust
Once your strategy is live, the single biggest threat to its long-term success is you. It’s human nature to want to constantly "improve" a working system by tweaking its parameters, but this is a destructive habit. You have to establish a clear framework for when to intervene and when to simply let the system run.
Your best friend here is your equity curve. Any healthy strategy will have its ups and downs; drawdowns are just part of the game.
- When to Let It Run: If your strategy is in a drawdown that is still within the historical limits shown in your backtest (i.e., less than the max drawdown), do not touch a thing. The system is just operating within its statistically expected range.
- When to Re-evaluate: If a drawdown blows past its historical maximum by a significant margin (say, 1.5x), or if the entire market structure has fundamentally changed (like a massive shift in volatility), it's time to hit the pause button.
This isn’t an excuse to change a setting after a few losing trades. A true re-evaluation means taking the strategy offline, running a fresh backtest on recent market data, and making an objective call on whether its core logic is still valid. This disciplined, hands-off approach is the final piece of the puzzle, giving your well-designed VWAP strategy the space it needs to perform over the long haul.
Answering Your Top VWAP Trading Questions
Once you start digging into building a VWAP strategy, a few questions almost always bubble up. Getting these sorted out early can save you a ton of headaches and prevent some costly mistakes down the line.
Let's walk through some of the most common hurdles traders face when they first get serious about using Volume-Weighted Average Price. Remember, a rule that works perfectly for S&P 500 futures on a 5-minute chart might fall flat on a volatile small-cap stock. The goal is to get the core principles down so you can make smart adjustments on the fly.
What Is The Best Timeframe For A VWAP Strategy?
Since the VWAP is an intraday indicator that resets every single morning, it’s built for the lower timeframes. You'll find most VWAP traders living on the 1-minute, 5-minute, and 15-minute charts. Which one you pick really comes down to your personality and what you’re trying to achieve.
For most day traders, the 5-minute chart is the sweet spot. It's fast enough to catch timely signals but filters out a lot of the chaotic noise you'd see on a super-short timeframe.
Scalpers, on the other hand, might gravitate toward the 1-minute chart. Their entire game is about capitalizing on tiny, rapid price moves around the VWAP line. If you're looking to capture bigger intraday trends, you might prefer the 15-minute chart to get a clearer picture of the day's unfolding story.
Can I Use VWAP For Swing Trading?
The short answer is no, not in its standard form. The daily VWAP resets every single morning, making it pretty much useless for a swing trader holding a position for days or weeks.
But that’s not the whole story. Some platforms offer powerful variations like weekly or monthly VWAP, which only reset at the start of the new week or month, respectively. These can be helpful for longer-term context.
The real game-changer for longer-term analysis is the Anchored VWAP. This tool lets you start the calculation from any specific point on the chart—think a major earnings release, a market swing low, or a pivotal news event. This gives swing traders a dynamic level of support or resistance based on the average price paid since that critical moment.
How Does VWAP Differ From A Simple Moving Average?
This is probably the most critical distinction to get right. The difference between VWAP and a Simple Moving Average (SMA) boils down to one powerful word: volume.
An SMA just gives you the average price over a certain number of candles, treating each one as equally important. A 20-period SMA on a 5-minute chart simply averages the last 20 closing prices. It has no clue if one candle traded 100 shares or 1 million shares.
VWAP is smarter than that. It gives far more weight to the price levels where the big money was changing hands.
- Simple Moving Average (SMA): An average of price alone.
- Volume-Weighted Average Price (VWAP): An average of price, heavily weighted by volume.
Because VWAP accounts for where the real trading activity happened, many pros consider it a much truer reflection of an asset’s fair value for that day. It shows you the price where the bulk of the day's business was actually done, making it a far more meaningful benchmark for your trades.
Ready to build, backtest, and deploy your own data-driven VWAP strategy? With ChartsWatcher, you get the powerful tools you need to move from idea to live execution with confidence. Stop guessing and start testing.
