A Modern Trader's Guide to Reading the Tape
Reading the tape is all about analyzing the real-time flow of executed trades to get a gut feel for market sentiment. It means gluing your eyes to the Time & Sales window and Level 2 data to see the raw supply and demand battle playing out—information that most indicators only show you after the fact. It’s an old-school skill, but it gives you a massive edge.
Why Reading The Tape Still Matters In Modern Markets
The phrase "reading the tape" definitely sounds like something out of a black-and-white movie, but the core principles are more critical today than ever. To actually make sense of the signals flying across your screen, you absolutely need reliable data connectivity. Without it, the real-time flow you're trying to read becomes a jumbled, useless mess.
This skill is about moving beyond static charts to see the story of the fight between buyers and sellers as it happens.
For a modern trader, the "tape" really comes down to two essential tools. To give you a clear picture, here's a quick breakdown of what you're actually looking at.
| Component | Primary Function | What It Reveals |
|---|---|---|
| Time & Sales (The Tape) | A live, rolling list of every single trade that gets executed. | The historical record of what just happened—price, size, and when. |
| Level 2 (The Order Book) | A display of all the current outstanding buy (bid) and sell (ask) orders. | The intention of market participants and where liquidity is sitting. |
When you put these two together, you get a transparent look into market psychology. A chart tells you the result of a price move; the tape tells you about the force that created it.
This typical trading desk setup is a perfect example of how analysts use multiple monitors to keep an eye on charts, Time & Sales, and Level 2 data all at once.
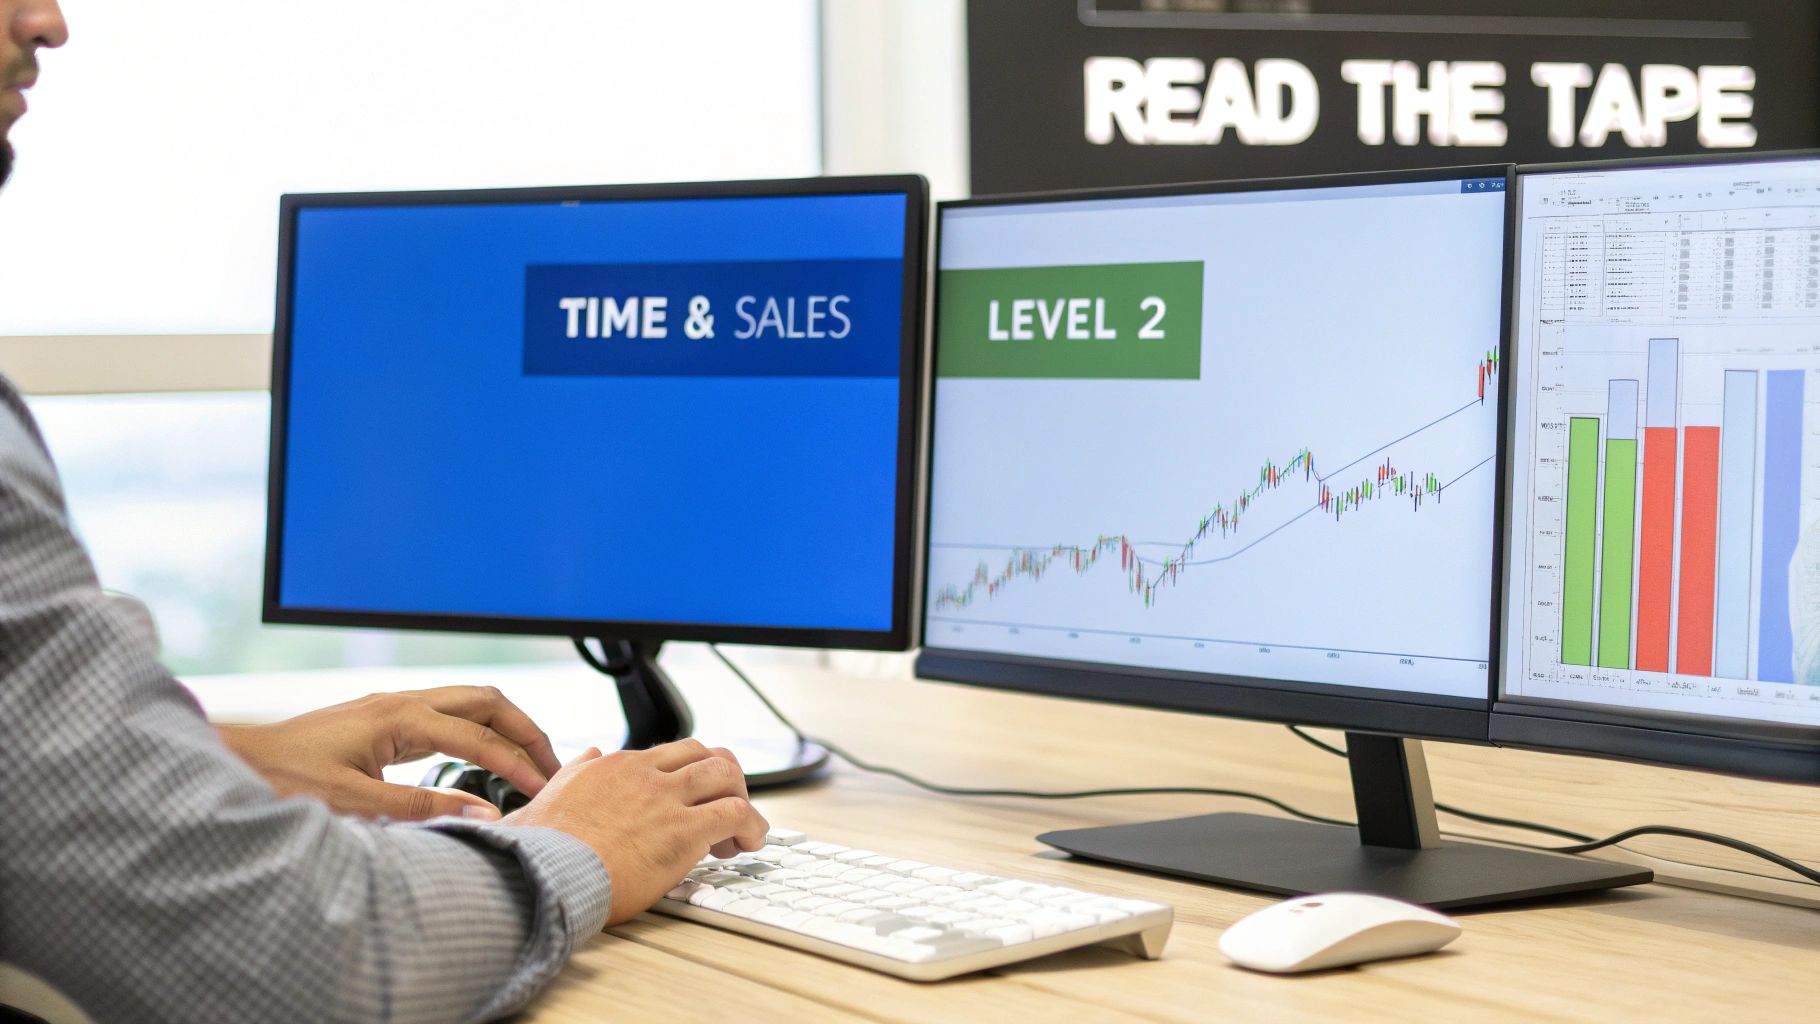
By watching these data streams together, a sharp trader can spot things like a big institution quietly accumulating shares or sellers getting exhausted—subtleties that are completely invisible on a standard price chart.
The Evolution From Paper To Pixels
The whole practice got its start back in the late 1800s with actual ticker tape machines spitting out stock prices on long strips of paper. Legends like Jesse Livermore famously used this raw data to spot the footprints of big money and make their fortunes. The shift from physical paper to digital screens has only made this skill more powerful, giving today's traders a much deeper view into order books and liquidity.
By interpreting this raw order flow, you are getting as close as possible to the market's real intentions. It allows you to see beyond the price and understand the conviction—or lack thereof—behind a move.
Understanding the tug-of-war between the buy orders at the bid and the sell orders at the ask is the absolute foundation of this entire process. To get a better handle on this, check out our guide that breaks down the bid-ask spread in simple terms: https://chartswatcher.com/pages/blog/what-is-bid-ask-spread-essential-guide-for-traders.
Ultimately, reading the tape isn’t about predicting the future with a crystal ball. It’s about making smarter, more informed decisions based on what’s happening in the market right now.
How to Decode Critical Signals on the Tape
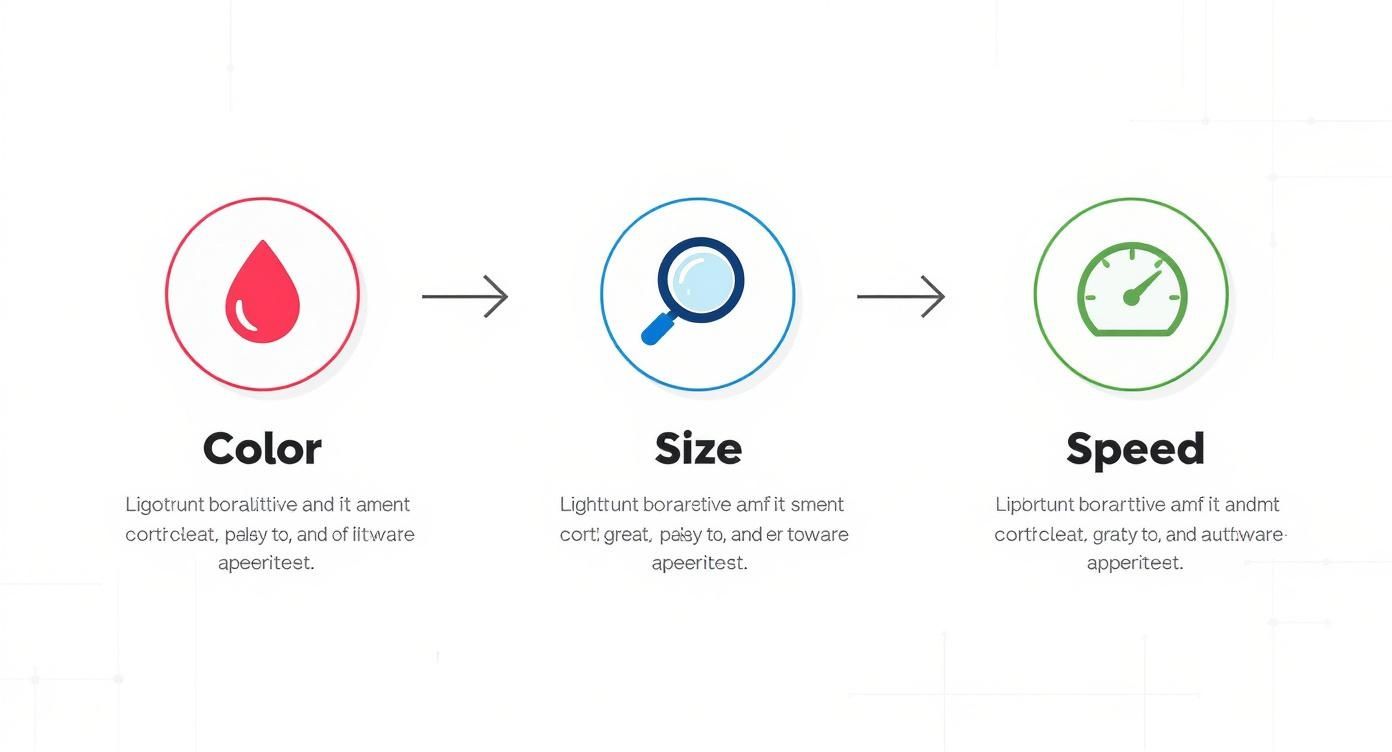
Trying to make sense of the chaotic stream of data on the tape is what separates a true order flow trader from the crowd. It’s not about watching every single print scroll by. It’s about spotting the patterns in the flow. At its heart, this process comes down to interpreting three critical signals working in unison: color, size, and speed.
Together, these elements paint a vivid picture of the real-time battle between buyers and sellers. While the principles are timeless, the tools have definitely changed. Today’s digital tape is a direct descendant of the original ticker system rolled out way back in 1867, which replaced messengers who literally ran trading data between offices. Even as technology got better—from Thomas Edison’s faster tickers to the electronic feeds of the 1960s—the core data of price and volume has always been the foundation.
Reading Transaction Colors
The first and most fundamental signal is the color of the prints hitting the tape. This immediately tells you which side of the market is being aggressive.
- Green Prints: These are transactions happening at the ask price or higher. It means a buyer was impatient and willing to pay the seller's asking price to get in right now. A steady stream of green prints suggests strong buying pressure.
- Red Prints: These are trades executed at the bid price or lower. This shows a seller was motivated to hit the buyer's bid just to get out of their position quickly. A cascade of red prints signals selling pressure.
- White or Blue Prints: These often represent trades executed somewhere between the bid and the ask. They can signal indecision or trades happening in dark pools, but they generally show less aggression than pure red or green.
One lonely green print means nothing. But a sudden barrage of large green prints as a stock pushes a key resistance level? That’s a powerful sign that buyers are trying to force a breakout.
Interpreting Trade Size
Not all trades carry the same weight. The size of the orders hitting the tape is how you distinguish between the big institutions and the smaller retail players. Most trading platforms let you filter the Time & Sales window to highlight these larger prints, and you absolutely should.
Think of it this way: a few hundred prints of 100 shares is just background noise. But when you see a series of 10,000-share prints hitting the tape one after another, that's a footprint left by a big player.
The goal is to follow the "smart money." By focusing on larger trade sizes, you filter out the retail chatter and get a much clearer picture of what the institutions with market-moving power are actually doing.
Let's say you see a big seller repeatedly hitting the bid, but the price just won't drop. You might be witnessing absorption—a classic bullish sign where a large, patient buyer is quietly soaking up all the sell orders. This often happens right before a sharp move higher. This dynamic is closely tied to the order book, and you can learn more about it by reading a trader’s guide to Level 2 data, which explains how those resting orders create support and resistance.
Analyzing the Speed of the Tape
The final piece of the puzzle is the pace, or speed, of the transactions. The speed of the tape reveals the urgency and conviction behind a move. A slow, methodical tape suggests a lack of interest or a market in balance.
But when the tape suddenly accelerates, that’s your cue to pay attention. Something is happening.
- Speeding Up at Key Levels: If a stock is consolidating and the tape is slow, but it suddenly speeds up with a flurry of green prints as it nears its high-of-day, that screams immense buying interest and a potential breakout.
- Slowing Down at Extremes: On the flip side, if a stock has been tanking on a fast, frantic red tape, and the prints suddenly slow down and get smaller near a support level, it could mean selling pressure is finally drying up.
Imagine a car approaching a red light. It slows, hesitates, and then accelerates hard when the light turns green. The tape acts in a similar way at important price levels. A frantic tape shows panic or FOMO, while a slowing tape signals exhaustion or indecision. By combining speed with color and size, you start to build a complete narrative of market sentiment, turning raw data into a real trading edge.
Putting Order Flow Analysis into Practice
All the theory in the world is great, but reading the tape is a skill forged in the heat of live markets. This is where you learn to fuse what the chart is telling you with the raw, unfiltered data streaming through the Time & Sales. It’s about taking a promising technical setup and then turning to the tape for that final, crucial confirmation.
Picture this: a stock has been ripping higher and is now pulling back to a key support level, maybe its 50-day moving average. The chart looks ripe for a bounce. But is it? How can you know for sure? This is your cue to shift your entire focus to the tape and Level 2 data to see if the big money agrees with your thesis.
Spotting Absorption at Key Levels
One of the most powerful signals you can ever see is absorption. This is when a massive offer (a sell order) pops up on the Level 2, something that should act like a brick wall and stop the price. But it doesn't.
You’ll see a relentless stream of red prints on the tape as sellers hammer that price, yet the offer doesn't shrink and the stock refuses to drop. This is the classic footprint of a large, patient buyer—often an institution—quietly soaking up every share that sellers throw at them. They’re absorbing the pressure without tipping their hand.
For example, you might see 200,000 shares offered at $50.50. For minutes, the tape is just a waterfall of red at that exact price, but the offer size on the book barely budges. That’s your sign. A major player is quietly building a position right in front of you.
This whole process boils down to watching three key elements: the color of the prints, their size, and the speed at which they're hitting the tape.
Mastering these three signals is how you move from just watching prices to truly understanding the conviction behind the moves.
Unmasking Deceptive Institutional Tactics
Of course, not all order flow is what it appears to be. Big institutions are masters of camouflage, and they use specific tactics to hide what they're really doing. Learning to spot these games is a critical part of becoming an expert tape reader.
Two of the most common tricks you'll see are:
- Iceberg Orders: This is where a massive order is sliced into small, visible chunks on the Level 2. You might see an offer for just 5,000 shares at a key price, but the second it gets filled, it instantly refreshes. That’s just the "tip of the iceberg." It's designed to hide a much larger order underneath, creating a false sense of weak resistance or support.
- Spoofing: This is an illegal but common tactic where a trader flashes a huge, visible order on the bid or ask with zero intention of actually letting it trade. The goal is to create a false sense of supply or demand to bait other traders. A spoofer might place a monster buy order below the market to create the illusion of strong support, tricking others into buying. Then, they'll cancel their order and sell into the very rally they just manufactured.
The tape doesn't lie. Even if someone is manipulating the order book with spoof orders, the Time & Sales shows you what’s actually trading. If you see a massive bid on Level 2 but the prints aren't hitting it, get suspicious.
Synthesizing the Chart with the Tape
Let's circle back to our example of the stock pulling back to its 50-day moving average. You’ve got the setup on your chart. Now, you’re watching the tape like a hawk, waiting for that confirmation.
Here’s what a high-conviction long setup looks like through the lens of order flow:
- Sellers Get Tired: As the stock drifts down to that support level, you notice the speed of the tape slows. The frantic red prints that defined the pullback start to get smaller and less frequent. This is your first clue that the sellers are running out of steam.
- Buyers Show Up: Suddenly, a large bid appears on the Level 2 right at the moving average. At the same time, you start seeing bigger green prints on the tape as aggressive buyers step in and start smacking the small offers out of the way.
- The Absorption Test: Sellers give it one last push. A final wave of red prints hits that big bid you were watching. But the bid holds firm, absorbing all the pressure without breaking. That confirms it—the support level is real, and a big buyer is defending it.
This trifecta of signals—a solid chart pattern, fading seller momentum, and clear buyer absorption—gives you a much more powerful entry signal than the chart ever could on its own. It's this synthesis of technicals and order flow that creates a real trading edge.
For traders looking to build their own tools to spot these signals automatically, getting a handle on Python programming for data analysis can be a game-changer. It allows you to transform reading the tape from a purely manual art into a data-driven strategy.
Applying Tape Reading to Real Trade Scenarios
Connecting theory to what’s happening on the screen in real-time is what separates the novices from the pros. It’s one thing to know that green prints mean buying, but it's a whole different ballgame to see them confirm a breakout just seconds before it rips higher. Let's walk through three common scenarios to see how the order flow tells the real story behind the chart.
Think of these breakdowns as a playbook. They'll help you connect the dots between abstract concepts and tangible patterns you can start spotting on your own. Each example shines a light on a different market dynamic, proving just how versatile reading the tape can be.
Scenario 1: The High-Momentum Breakout
Picture this: a stock, let’s call it XYZ, has been chopping around in a tight range for an hour. It keeps poking its head up to the high-of-day at $100.50 but can't quite break through. The chart shows a crystal-clear resistance level—a perfect setup for a potential breakout. But how do you know if this time is the real deal?
You turn to the tape. As XYZ makes another run at $100.50, you notice a dramatic shift in the order flow.
- The Tape Wakes Up: The slow, meandering prints that defined the consolidation are gone. In their place is a rapid-fire stream of transactions. That sudden speed is your first clue that urgency is building.
- Green Is Everywhere: The prints are almost all green. This tells you buyers have stopped waiting for a better price. They are aggressively lifting the offer, desperate to get in before the move happens.
- The Big Money Arrives: Instead of the usual 100-share lots, you suddenly see prints for 1,000, 2,500, and even 5,000 shares fly by. This isn't retail—it's institutional firepower adding fuel to the fire.
When you see the tape accelerate with big, aggressive green prints right at a major resistance level, that's a high-probability signal. The breakout is on. The chart showed you the what (price hitting resistance), but the tape just revealed the how (an overwhelming wave of buying force).
Scenario 2: Spotting a Reversal at Key Support
Now, let's flip the script. A stock, ABC, has been in a freefall all morning. It’s now hurtling toward a major daily support level at $75.00. Panic sellers are dumping shares, and the chart looks like a nightmare. A sharp tape reader, however, is looking for one thing: seller exhaustion.
As ABC crashes into the $75.00 level, the story on the tape starts to change.
First, the frantic pace of red prints slows to a crawl. The sense of panic evaporates, replaced by a much more hesitant flow. This is a sign that the most motivated sellers have likely exhausted their supply.
Next, a massive bid for 50,000 shares pops up on the Level 2 at $75.00. You then get a front-row seat to absorption. A final wave of panicked red prints smacks into that price, but the bid doesn't flinch. It soaks up every single sell order without breaking.
Seeing a large bid absorb a firehose of selling pressure at a critical support level is one of the most powerful bullish reversal signals you'll ever see on the tape. It's a clear message: a big buyer is here, and they are defending this price.
Finally, the first green shoots appear. Small green prints start trickling in as buyers tentatively test the waters. These are quickly followed by larger ones as confidence builds. That combination—slowing sellers, visible absorption, and fresh buying aggression—is your confirmation that support is holding and a reversal is likely underway.
Scenario 3: Fading an Exhaustion Move
For our last scenario, let's look at a stock that has gone parabolic. Stock QRS has rocketed from $20 to $25 in a straight line on insane volume. Chasers are piling in, and the tape is a blur of fast, tiny green prints—a classic sign of retail FOMO.
An experienced tape reader isn't chasing here; they're hunting for signs of exhaustion. As QRS pushes toward $25, you notice a subtle but critical change. The tape is still moving fast, but the price isn't making new highs. It's just churning.
Then, a huge offer appears on the Level 2 at $25.10. At the exact same moment, you see the first large red prints hit the tape. This is a dead giveaway that early buyers are now cashing out. We call this a "seller stepping in."
The key signals to fade this move are:
- Price stalls out despite a fast, green tape (churning).
- A large seller appears on the offer, putting a cap on the advance.
- The first significant red prints emerge, signaling profit-taking.
This tells you the powerful uptrend is running on fumes. The aggressive buyers are finally being met by an even more aggressive seller, creating a fantastic opportunity to short the stock for a pullback. In all three cases, the tape gave you the critical context that the chart alone never could.
Common Mistakes and How to Avoid Them
Learning to read the tape is a journey. Like any trading skill worth having, it comes with a steep learning curve and plenty of traps for new traders. Figuring out how to sidestep these pitfalls is what separates traders who turn order flow into profits from those who just get lost in the noise.
One of the biggest mistakes I see is traders getting completely mesmerized by the tape. They’ll glue their eyes to the Time & Sales window, so focused on the flashing numbers that they lose all sense of the bigger picture. The endless scroll can be hypnotic, making it easy to forget about crucial support and resistance levels, sector news, or the overall market trend.
The tape is a magnifying glass, not a crystal ball. It’s meant to confirm or deny a thesis you already have from the chart, not generate signals out of thin air.
This kind of tunnel vision inevitably leads to over-trading. You start reacting to every little flicker of activity, which is a fast track to chopping up your account. Remember, the tape is just one tool in your arsenal—a powerful one, but not the only one.
Overreacting to Small Prints
Another classic beginner mistake is giving way too much importance to tiny, insignificant prints. The reality is that the vast majority of transactions scrolling by are small retail orders or high-frequency bots just creating static. Chasing a sudden flurry of 100-share green prints is a textbook error that will have you buying tops and selling bottoms.
The real story is in the larger, institutional-sized orders. Those are the footprints of the big players with enough capital to actually move the market. The key is to learn to ignore the chatter and zero in on the block trades.
Here are a few ways to stay disciplined:
- Filter Your Tape: Dive into your trading platform’s settings and filter the Time & Sales. Set a minimum share size—maybe 500 or 1,000 shares—so you only see the trades that actually matter.
- Context First, Tape Second: Always start with the price chart. Identify your key levels and map out a potential trade idea before you even glance at the tape for confirmation.
- Use It for Risk Management: The tape isn't just for entries. If you’re long a stock and a massive seller suddenly slams the offer, that's your cue. It’s a signal to either tighten your stop-loss or peel off some profits.
Ignoring Off-Exchange Prints
In today's markets, a huge chunk of trading happens away from the main exchanges. These "dark pools" are private venues where institutions trade massive blocks without showing their hand on the public order book. These prints eventually show up on the tape, often with a special marker and sometimes with a slight delay.
If you ignore these prints, you're missing a massive piece of the puzzle. A huge dark pool buy order executing near a key support level is an incredibly powerful bullish signal, even if the live tape looks weak at that moment.
Learning to spot and interpret these off-exchange trades is essential for a complete approach to tape reading. It takes some practice, but integrating this data will give you a much clearer picture of what the smart money is actually doing.
Configuring ChartsWatcher for Tape Reading Success
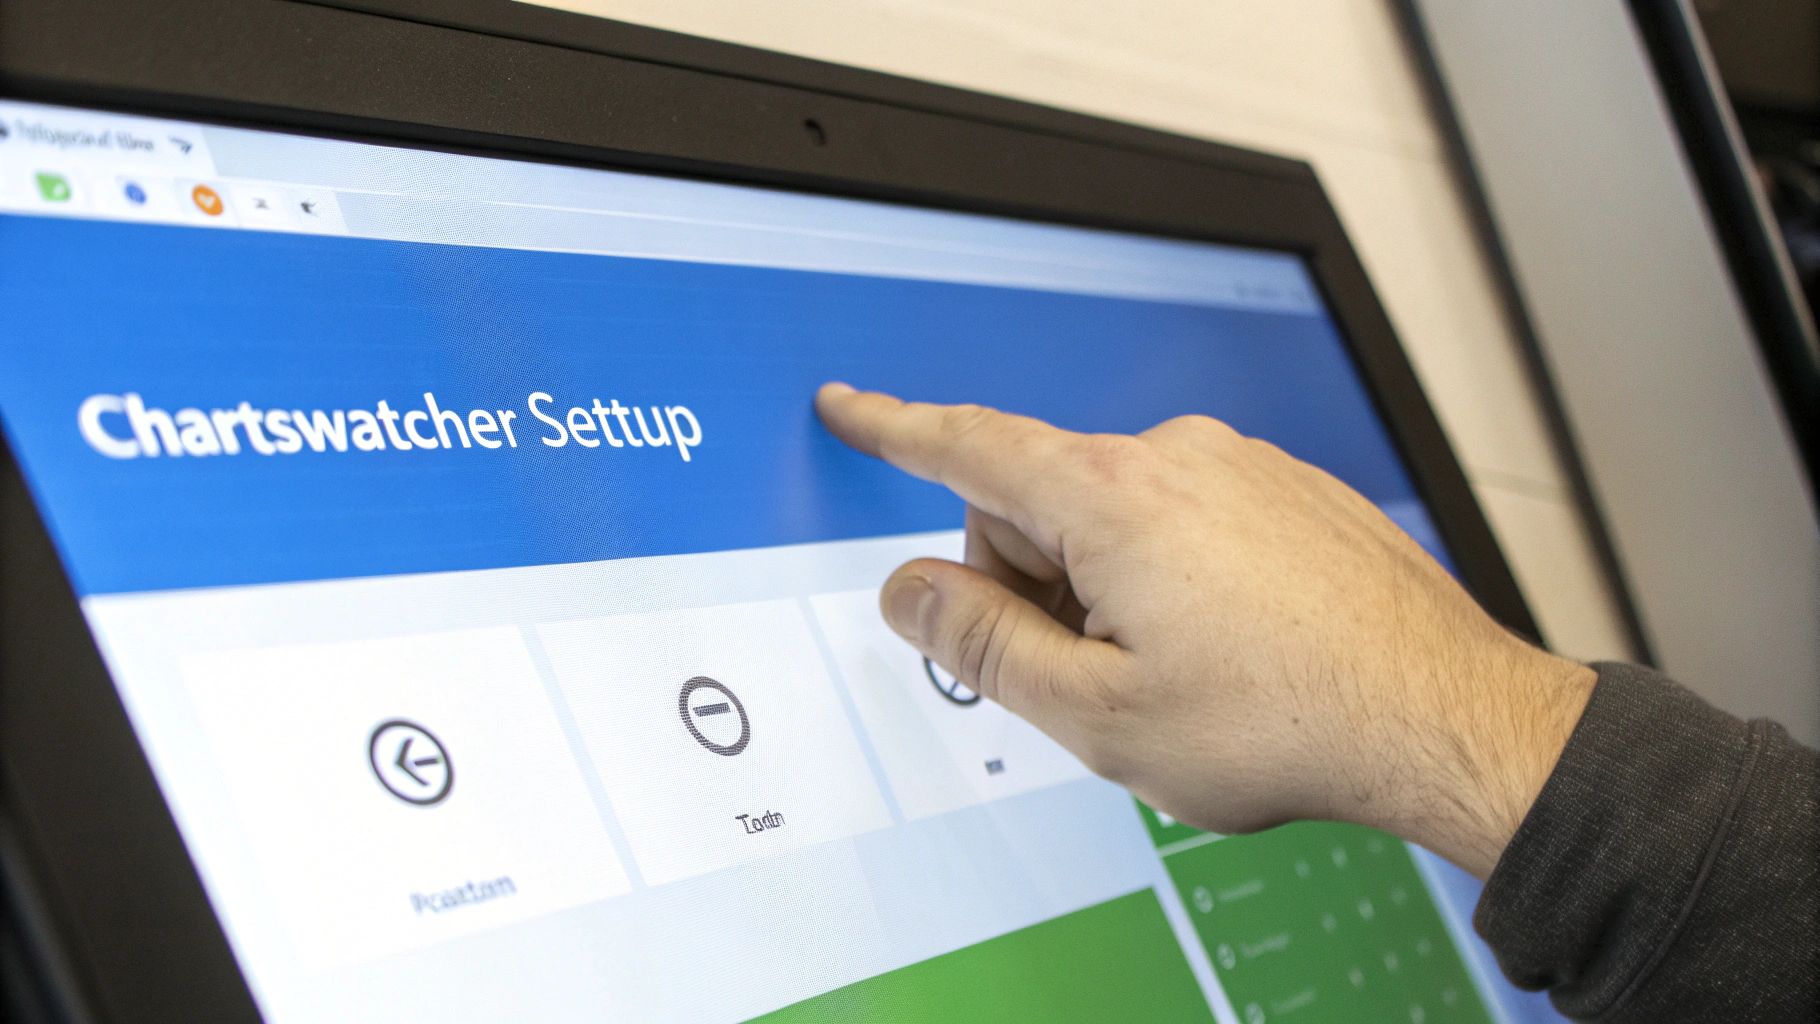
This is where the rubber meets the road—turning all that theory into a setup that actually helps you make money. With ChartsWatcher, you can build a workspace specifically for clear and efficient tape reading. Forget the default settings; it’s time to create a personalized dashboard that gives you an edge.
Let’s start with the Time & Sales window. Straight out of the box, it's a firehose of every single transaction, which is mostly just noise. The single most important tweak you can make is to apply a size filter. Set that window to only show you prints larger than 500 or 1,000 shares. Instantly, all the retail chatter disappears, and you're left with the institutional footprints that actually move the needle.
Next up, get your Level 2 data organized. Don’t just leave it as a static ladder off to the side. I like to place it directly next to my Time & Sales. This lets you immediately cross-reference live prints against the resting orders on the book. You can see a huge bid get hit and watch in real-time if it’s absorbing the selling pressure or if it’s about to get pulled.
Setting Up Smart Alerts
This is where you can really start to leverage the software. Instead of chaining yourself to the screen all day, you can build custom alerts in ChartsWatcher to do the heavy lifting for you, transforming your setup from a passive screen into an active advantage.
Here are a couple of alerts I find incredibly useful:
- Volume Spike at Ask: Get a notification when transaction volume hitting the ask price surges way above its recent average. This is often a tell-tale sign of an imminent breakout.
- Large Print Notification: Set an alert for any single print that exceeds a specific size, like 20,000 shares. This immediately draws your attention to significant institutional action that you can't afford to miss.
A well-configured workspace doesn't just show you data; it highlights the exact moments of opportunity. This kind of setup gives you a direct path from learning the art of reading the tape to applying it with precision.
Got Questions About Reading the Tape?
Even after you get the hang of the basics, learning to read the tape is a nuanced skill, and new questions always seem to pop up. It's an art form, really. Let's tackle some of the most common hurdles and questions traders run into.
Is Reading the Tape Even Worth It with All the High-Frequency Trading?
Yes, absolutely. But you have to adapt.
High-frequency trading (HFT) definitely adds a ton of background noise to the tape, but the core mission hasn't changed. You're still hunting for the footprints of large institutional orders and spotting shifts in supply and demand. The trick is learning to filter out the endless stream of small, meaningless HFT prints. Instead, you focus on the big block trades and absorption patterns that signal real conviction from the players who actually move the market.
The modern challenge isn't the presence of HFTs; it's developing the discipline to ignore their noise. Tools that filter the tape by trade size are essential for cutting through the static and seeing what really matters.
How Long Does It Take to Actually Get Good at This?
There's no magic number, but it demands serious screen time and deliberate practice. Most traders I've talked to say it takes at least three to six months of daily, focused effort just to feel comfortable. True mastery? That often takes a year or more.
And it’s not just about staring at the tape as it scrolls by. You have to be an active student. Take notes, review your trading sessions, and constantly connect what you saw on the tape with what the price did next. That’s how you build the skill.
Can I Read the Tape Without Level 2 Data?
You can, but it’s like trying to drive a car by only looking in the rearview mirror.
The Time & Sales (the tape) shows you what has already happened—the executed trades. Level 2 data shows you what might happen—all the orders sitting there, waiting to be filled. When you put them together, you get a much clearer picture of the battlefield. The tape shows you aggression (buyers smacking the ask), while Level 2 reveals liquidity and where potential support or resistance walls are building up.
Ready to transform your analysis from passive observation to active advantage? ChartsWatcher provides the powerful, customizable tools you need to filter the noise and focus on the market-moving action. Start building your professional tape reading setup today at https://chartswatcher.com.
