A Modern Guide to the Volume Weighted Average Price Trading Strategy
A volume weighted average price trading strategy is really about one thing: understanding the true average price of a stock by looking at both its price and how much of it is actually trading. It's a method that helps you see where the real conviction is, letting you spot fair value, confirm trends, and time your trades with much greater precision. This is why it's a fixture in the toolkits of both professional day traders and big institutional players.
Why VWAP Is a Modern Trader's Go-To Strategy
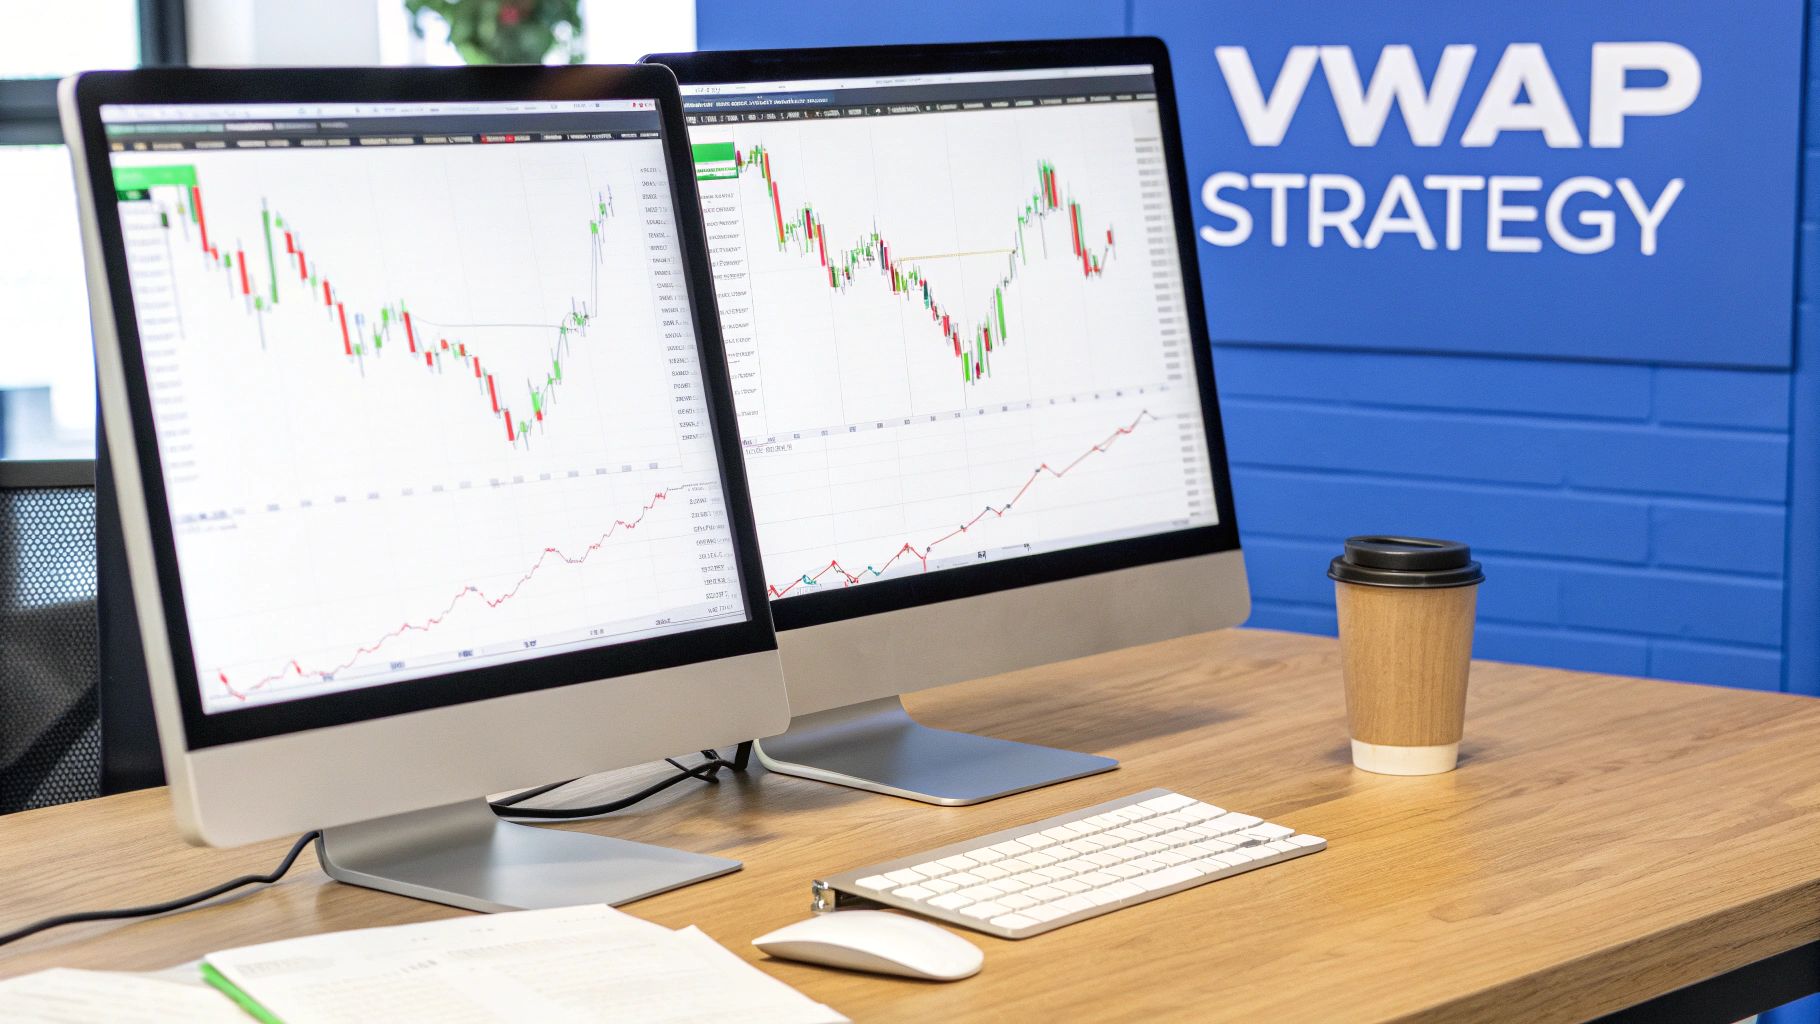
In trading, plenty of indicators just create noise. Very few give you a genuine edge. The Volume Weighted Average Price (VWAP) is firmly in that second camp. It's so much more than a simple moving average; think of it as a dynamic benchmark that cuts through the clutter to show you where the real money is flowing.
At its core, VWAP gives you a clean visual reference for an asset's "fair value" for that specific trading day. If the price is trading above the VWAP line, it’s a strong signal that buyers are in control and the mood is bullish. On the flip side, a price dipping below VWAP often means sellers have taken the driver's seat.
From Institutional Tool to Retail Staple
VWAP wasn’t born in a retail trading forum. Its roots are deep in institutional trading floors. The history goes back to 1984 when a trader named James Elkins at Abel Noser executed the first documented VWAP-based trade for Ford Motor Company. His goal was simple but revolutionary: move massive blocks of stock without spooking the market and causing huge price swings.
That institutional legacy is precisely why so many traders trust it today—it’s a way to follow the "smart money." A 2022 study even showed that over 70% of institutional traders on major exchanges like the NYSE and NASDAQ rely on VWAP algorithms every single day to execute their orders. You can get more background on VWAP’s history and its institutional use on Wikipedia.
This unique blend of price and volume is what gives the indicator its predictive punch. It helps you answer the questions that matter:
- Is this trend for real? A stock consistently holding above or below VWAP is a powerful confirmation of momentum.
- Where's a good spot to get in? Pullbacks to the VWAP line during a strong uptrend are often high-probability long entries.
- Is this move getting overextended? When price stretches too far from VWAP, it can be a sign that a reversion to the mean is coming.
By anchoring your analysis to where the real volume is, you move beyond simple price action and start trading based on conviction. It’s the difference between guessing where the market is headed and following its actual footprint.
Before we get into the nitty-gritty, the table below breaks down the core components of a solid VWAP strategy. Think of this as our roadmap for what's to come.
Core Components of a VWAP Trading Strategy
| Component | Objective | Key Metric |
|---|---|---|
| Trend Confirmation | To validate the strength and direction of the prevailing market trend. | Price relative to VWAP line |
| Entry & Exit Signals | To identify precise points for initiating or closing a position. | Price crossovers and retests |
| Risk Management | To define stop-loss levels and protect trading capital effectively. | VWAP as dynamic support/resistance |
| Advanced Analysis | To gain deeper market insights using specialized VWAP variations. | Anchored VWAP from key events |
This framework gives us a structured way to build out a plan that's not just theoretical but practical and ready to be deployed in live markets. Let's start building.
Reading VWAP for Smarter Entries and Exits
The theory behind VWAP is solid, but it really comes to life on a live chart. I like to think of the VWAP line less as a static indicator and more as a dynamic battlefield—a sort of financial center of gravity for the day where buyers and sellers are constantly fighting for control.
How price interacts with this line tells a story about market sentiment. Learning to read that story is the real secret to crafting a robust volume weighted average price trading strategy.
At its core, the interpretation is straightforward. When the price is consistently trading above the VWAP line, buyers are in command and sentiment is bullish. When the price holds below the VWAP line, sellers have the upper hand, signaling bearish pressure. This isn’t just a guideline; it’s a direct reflection of where the majority of the day’s volume has actually been transacted.
Identifying Trend Strength and Conviction
A strong, healthy trend rarely strays too far from its VWAP. In a powerful uptrend, you’ll often see the price pull back to test the VWAP line from above, find support, and then bounce higher. We call this the "kiss and go," and it's a classic sign of institutional accumulation. Big players are using that 'fair value' price as their chance to add to long positions.
The opposite holds true in a downtrend. The price will try to rally back up to the VWAP, meet a wall of resistance, and get pushed back down. Each rejection from the VWAP confirms that sellers are still in control, viewing any pop to the average price as a fresh opportunity to sell or initiate new shorts.
The real tell is to watch the volume during these interactions. A bounce off VWAP on a surge of high volume is a much stronger confirmation signal than a weak drift away on low volume. Volume is the fuel that validates the price move.
This dynamic role as a support and resistance level isn't just anecdotal; it's statistically significant. A comprehensive analysis of 5 million intraday trades on the NYSE from 2018-2023 found that long positions entered when price crossed above VWAP with 1.5x average volume returned an annualized 12.4%. That outpaced the buy-and-hold S&P 500 returns of 9.2% by a whopping 34%. You can learn more about how to use volume weighted indicators in your trading.
Using VWAP Bands for Mean Reversion
While VWAP is a fantastic trend-following tool, it's also incredibly useful for spotting mean reversion setups. Most charting platforms, like TradingView or TC2000, let you add standard deviation bands around the central VWAP line. These bands create a channel that visually signals when a price move might be getting overextended.
When the price pushes up to the second or third standard deviation band above VWAP, it’s often considered overbought. This doesn't necessarily mean the trend is over, but it’s a strong hint that a pullback or consolidation is likely. More aggressive traders might look for short-term short opportunities here, targeting a return trip to the VWAP line itself.
Likewise, when the price plummets to the lower bands, it can be seen as oversold. This often presents a potential buying opportunity for a bounce back toward the VWAP. The bands give you a structured way to fade moves that have gone too far, too fast.
A Practical Checklist for VWAP Entries
To put this all into practice, let’s build a simple, actionable checklist. Before you even think about hitting the buy or sell button, you should be able to check off these conditions. This is how you remove emotion and ensure you’re only taking high-probability setups.
The goal isn't to find more trades; it's to find better trades. Here's a quick reference table I use to qualify my entries.
VWAP Entry Signal Checklist
| Checklist Item | Bullish Entry (Long) | Bearish Entry (Short) |
|---|---|---|
| Price Location | Is the price trading at or above the central VWAP line? | Is the price trading at or below the central VWAP line? |
| Volume Confirmation | Did the bounce off VWAP occur with above-average volume? | Did the rejection from VWAP occur with above-average volume? |
| Candlestick Pattern | Is there a bullish candlestick pattern (e.g., hammer, bullish engulfing) at the VWAP level? | Is there a bearish candlestick pattern (e.g., shooting star, bearish engulfing) at the VWAP level? |
| Market Context | Does the broader market trend support a long position in this instrument? | Does the broader market trend support a short position in this instrument? |
By running through a checklist like this, you shift from passively watching the VWAP line to actively engaging with it based on a set of rules. This disciplined approach is what separates consistently profitable traders from those who trade on gut feelings. It turns a simple indicator into a core component of a system for executing smarter entries and exits.
Using Anchored VWAP and Multiple Timeframes
While the daily VWAP gives you a fantastic baseline for the day's sentiment, a truly professional strategy layers in more advanced tools for greater context and precision. The two I rely on most are the Anchored VWAP (AVWAP) and multi-timeframe analysis. Getting a feel for these can shift your trading from being reactive to predictive.
The standard VWAP is great, but it resets every single day. That’s perfect for a typical day trader. But what if you need to track sentiment after a major, market-moving event? That's exactly where the Anchored VWAP shines. Instead of automatically starting at the opening bell, you manually "anchor" its starting point to a specific candle—a moment that represents a significant psychological shift in the market.
Doing this lets you track the average price paid by every single trader who has entered a position since that specific event. It’s like drawing a line in the sand to see who's really in control after the game has changed.
Pinpointing Key Market Inflection Points
The real power of AVWAP comes from choosing the right anchor point. You're not just picking random dates. You're identifying the exact moments that fundamentally altered how the market perceived a stock's value.
Some of the most effective anchor points I've used include:
- Major News Events: Think FDA approvals, a huge product launch, or sudden geopolitical news. Anchoring to the candle when that news broke shows you exactly how the market is absorbing the new information over time.
- Earnings Reports: Anchoring an AVWAP to the pre-market or post-market gap after an earnings release is an incredibly powerful technique. It tells you the average price paid by everyone reacting to the company's performance.
- Significant Highs or Lows: Dropping an anchor at a major swing high or low lets you see if buyers or sellers are stepping up to defend that critical price level.
- Changes in Trend: When a stock finally breaks a long-term trendline or a key moving average, anchoring to that breakout candle creates a brand new dynamic level of support or resistance to watch.
Anchoring the VWAP transforms it from a simple daily indicator into a storytelling tool. It shows you the precise price level where participants from a key event will feel pressure, giving you a massive edge in predicting future support and resistance.
Layering Timeframes for a Complete Picture
Relying on a single timeframe is like trying to navigate a city with only a street-level view—you completely miss the bigger picture. Professional traders always combine multiple timeframes to make sure their short-term moves align with the dominant, long-term trend. This discipline keeps you from getting chopped up by minor counter-trend noise.
For example, a stock might look bullish on a 5-minute chart as it bounces neatly off the intraday VWAP. But if you zoom out to a daily chart, you might discover it's trading firmly below a weekly AVWAP anchored from a recent earnings miss. That's a huge red flag indicating significant overhead resistance. Taking a long position there would mean you're fighting a much larger, more powerful trend.
This process flow gives you a basic visual for how to interpret these signals.
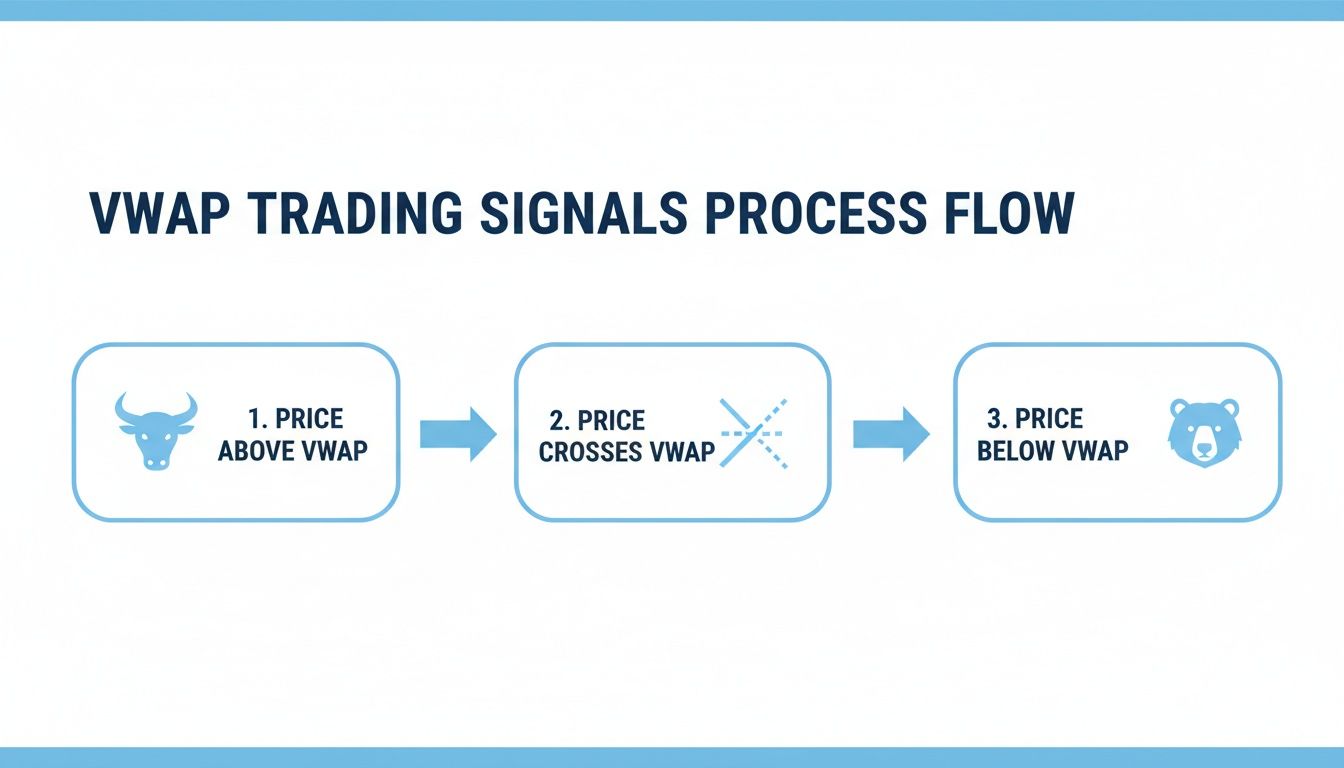
As the diagram shows, a stock holding above the VWAP is a bullish sign, while one stuck below it is bearish. That crossover point is where the big decisions are made.
A Practical Multi-Timeframe Workflow
A solid system combines these views into a clear hierarchy for decision-making. Here’s a practical workflow you can start using today:
- The Daily Chart (The Macro View): Start here. Use an AVWAP anchored from the most recent major catalyst, like an earnings report or a major low. This tells you the long-term sentiment. If the price is below this AVWAP, you should primarily be looking for short opportunities, period.
- The Hourly Chart (The Intermediate Trend): Next, look at the standard daily VWAP on an hourly chart. This helps you gauge the sentiment for the current week and pinpoint key support or resistance zones for multi-day swings.
- The 5-Minute Chart (The Entry Trigger): This is your execution timeframe. Use the standard intraday VWAP for precise timing. A long entry should only be considered if the price is above the daily AVWAP and is now bouncing off the 5-minute VWAP.
By making sure all three timeframes are in alignment, you dramatically stack the odds in your favor. This layered analysis ensures you're not just making a good trade on one chart, but that you're also trading in harmony with the broader market flow. This is the hallmark of a sophisticated VWAP strategy.
Building Your Risk Management Framework
Nailing a perfect VWAP entry is a great feeling, but that’s just the opening move. Without rock-solid risk management, even a strategy with a killer win rate can quickly drain an account. This is where the pros really separate themselves—they're obsessed with protecting their capital, not just finding the next big winner.
A professional VWAP trading strategy isn't complete without hard-and-fast rules for position sizing, stop losses, and profit targets. These can't be based on a gut feeling. They need to be calculated, systematic, and aligned with your account size and personal risk tolerance.
Calculating Your Position Size
Before you even think about clicking the "buy" button, you must know exactly how much is on the line. The professional standard is pretty clear: risk no more than 1% to 2% of your total account equity on any single trade.
This simple rule is your primary defense against a catastrophic loss. One bad trade won't sink you.
To get your position size right, you only need three numbers:
- Account Equity: The total cash value of your trading account.
- Risk Per Trade: The percentage you're willing to lose (e.g., 1%).
- Stop-Loss Distance: The price gap between your entry and your stop-loss level.
The math is simple: Position Size = (Account Equity x Risk Per Trade %) / (Entry Price - Stop Loss Price). This calculation ensures that if the trade goes against you and hits your stop, the loss is capped precisely at your predefined risk level, no matter the stock's price or how wild its swings are.
For a deeper look into this process, check out our dedicated article on building comprehensive risk management frameworks your strategic guide.
Setting Intelligent Stop Losses with VWAP
Generic advice like using a fixed percentage for a stop-loss is a rookie mistake. It completely ignores the market's current context. VWAP, on the other hand, gives you a dynamic, intelligent reference point for placing smarter stops.
Let's say you take a long trade on a bounce off the VWAP line. Where does the stop go? A logical place is just below that VWAP level. You want to give the trade enough room to work without getting shaken out by random noise. A common technique I use is to place the stop one ATR (Average True Range) value below the VWAP at the moment I enter the trade.
This approach ties your risk directly to the market structure. If the price breaks decisively below VWAP and hits your stop, it means your trade idea—that VWAP would hold as support—is officially wrong.
A stop-loss isn’t just a safety net; it’s a tool for invalidating your trade idea. When price action violates a key level like the VWAP, it’s a clear signal that your initial analysis was wrong, and it’s time to get out with minimal damage.
Defining Realistic Profit Targets
Knowing when to exit a loser is critical, but knowing when to bank profits on a winner is just as important. A VWAP-based strategy provides clear, data-driven levels to help you define those targets ahead of time.
Here are a couple of effective methods I rely on:
- Using Standard Deviation Bands: If you're playing a mean reversion setup back to the VWAP, your primary target is often the VWAP line itself. For a trend-following trade, the first or second standard deviation band above (for longs) or below (for shorts) the VWAP can be a fantastic initial profit target. These bands often mark areas where the price is getting temporarily overextended.
- Identifying Key Price Structure: This is as simple as looking left on the chart. Your target could be the next major resistance level, like a previous swing high, a significant moving average, or even an Anchored VWAP from a prior peak.
When you combine precise position sizing with VWAP-based stops and targets, you build a complete, repeatable trading process. This is how you shift from guessing and gambling to running a disciplined business of managing probabilities.
How to Backtest and Refine Your VWAP Strategy

Having a solid set of rules for your entries, exits, and risk management is a fantastic starting point. But right now, it's just a hypothesis. It needs to be proven.
This is where backtesting comes in. It’s the critical process of throwing your VWAP strategy against historical data to see if it holds up. This is how you separate what should work from what actually works, building the kind of confidence you need to pull the trigger without hesitation in a live market.
The goal here isn't a simple "pass" or "fail." Think of it as a rigorous quality control process for your trading ideas. We're going to systematically measure performance, pinpoint the weak spots, and tweak the rules until we have a robust system with a real, quantifiable edge.
Sourcing Your Data and Defining Parameters
Any credible backtest starts with clean, high-quality historical data. Full stop. For intraday VWAP strategies, that means getting your hands on tick-level or, at a minimum, 1-minute OHLCV (Open, High, Low, Close, Volume) data for the markets you trade. Garbage in, garbage out—it’s that simple.
Once your data is sorted, you need to translate your trading rules into concrete, testable parameters. This is where you leave zero room for ambiguity. Every single part of the trade has to be defined with machine-like precision.
- Entry Conditions: What’s the exact trigger? A price touch of the VWAP line? A close above it on the 5-minute chart? Does it need a volume spike of 1.5x the 20-period average? Get specific.
- Exit Conditions (Stop Loss): How are you calculating the stop? Is it a fixed percentage? A multiple of the ATR below VWAP? Or maybe a break below the last swing low?
- Exit Conditions (Profit Target): Where do you cash out? At the first standard deviation band? A key resistance level from the daily chart? Or after hitting a clean 2:1 risk-to-reward ratio?
- Trade Management: Are you using a trailing stop? If so, what are the exact rules for moving it up?
Defining these rules meticulously is everything. A vague idea like "buy a VWAP bounce" is impossible to test. A precise rule like "enter long when a 5-minute candle touches VWAP and closes above it, with volume >1.5x the 20-period average" is something you can actually validate.
Analyzing Key Performance Metrics
After the simulation runs, the real work begins. You have to analyze the output, and a simple win rate just won't cut it. Professional traders dissect performance using a handful of key metrics to understand a strategy's true personality and profitability.
Backtesting is the only way to experience years of market behavior in a matter of hours. It's where you earn your trading scars without paying the financial price, allowing you to refine your approach before a single dollar is at risk.
You have to look past the final P&L number and scrutinize the journey. Was the equity curve a smooth upward slope or a gut-wrenching rollercoaster?
Essential Backtesting Metrics
| Metric | What It Measures | Why It's Important |
|---|---|---|
| Profit Factor | Gross Profit / Gross Loss | Anything over 1.0 is profitable. A number pushing 2.0 or higher suggests a really robust edge. |
| Max Drawdown | The largest peak-to-trough drop in your account equity. | This tells you the most painful losing streak you would have endured. It's a critical measure of risk and your own psychological tolerance. |
| Win Rate | The percentage of your trades that were winners. | This is important, but it's totally meaningless without looking at your average win vs. your average loss. |
| Average Win/Loss | The average dollar amount of your winning trades versus your losing ones. | This is your risk/reward profile in a nutshell. You can be profitable with a low win rate if your winners are massive compared to your losers. |
The power of this approach is backed by serious data. A 2021 study by Empirica covering 500 U.S. large-cap stocks found VWAP algorithms could execute trades with minimal market impact. More importantly for retail traders, backtesting VWAP on Nasdaq futures (NQ) from 2020-2025 showed a 68% success rate for scalping 0.2% moves off VWAP bounces, all while keeping the max drawdown under 5%. You can dig into the methodology of these VWAP algorithm studies to see how they got these numbers.
Thankfully, you don't need to be a programmer to do this anymore. Modern platforms like ChartsWatcher have powerful backtesting engines built right in, letting you simulate and optimize your VWAP parameters without writing a single line of code. This frees you up to focus on what matters: refining the strategy.
For a complete walkthrough of this process, our guide on how to backtest a trading strategy is the perfect place to start.
Your Top VWAP Trading Questions, Answered
Once you get the hang of VWAP, the real questions start popping up. It's one thing to understand the theory, but applying it to a live, blinking chart is a totally different ballgame. That’s normal. Getting comfortable with any tool means digging into the nuances and knowing how to handle real-world situations.
Let's break down some of the most common questions that hit my inbox from traders just starting out with VWAP.
Can VWAP Be Used for Swing Trading?
This is a big point of confusion, and for good reason. The standard, session-based VWAP that resets every single morning is, at its core, an intraday tool. Its real power comes from showing you the battle between buyers and sellers within a single trading day. Because of that, it's not the right indicator for a classic swing trade that lasts several days or weeks.
But that doesn't mean the concept is off-limits for longer-term holds.
For swing traders, the tool you want is the Anchored VWAP (AVWAP). It's a fantastic adaptation. Instead of resetting daily, you anchor the calculation to a specific, significant event—think a massive earnings beat, a breakout from a year-long base, or a key pivot low. The AVWAP then draws a dynamic line of support or resistance across days, weeks, or even months. It becomes an invaluable guide for a swing trader's arsenal.
Does VWAP Work in All Market Conditions?
Not exactly. VWAP shines brightest in markets with two key ingredients: decent volume and a clear trend. It's brilliant for helping you hop on an established uptrend during a dip or for shorting a confirmed downtrend on a bounce. The indicator gives you that "fair value" price where big institutions are often looking to either build or unload positions, making it incredibly reliable when a stock is on the move.
Where it gets messy is in low-volume, choppy, sideways markets.
In those grindy, directionless environments, the price just chops back and forth over the VWAP line with zero conviction. It’s a recipe for a string of false signals and a classic case of death by a thousand papercuts. A critical skill for any VWAP trader is recognizing when a market is stuck in a range. When it is, your best bet is to either step aside or switch to a different strategy built for that kind of chop.
At its heart, VWAP is a tool for trend-following and mean reversion. If there's no trend to follow or no significant move to revert from, the indicator loses most of its predictive edge.
How Does VWAP Differ from a Simple Moving Average?
This is probably the most critical distinction to get right. Both the Simple Moving Average (SMA) and VWAP show you an "average price," but they're telling you two completely different stories about what’s happening under the surface.
- Simple Moving Average (SMA): This is all about price, and nothing else. A 20-period SMA just adds up the last 20 closing prices and divides by 20. Every candle gets the same weight, whether one share or one million shares were traded.
- Volume Weighted Average Price (VWAP): This is the game-changer because it brings volume into the equation. Price levels where tons of shares changed hands get a much heavier weighting in the calculation, while price levels with thin volume barely move the needle.
Here’s a simple way to think about it: an SMA tells you the average price. VWAP tells you the average price where the most business actually got done. This makes VWAP a far more insightful tool for seeing where institutional money is active and for spotting genuine support and resistance. An SMA can get thrown off by a low-volume price spike; VWAP just filters that noise out.
Is It Better to Use VWAP on a Specific Timeframe?
The standard VWAP calculation itself is timeframe-agnostic—it pulls in data from every trade since the market opened, regardless of your chart. But how you see it and act on it absolutely depends on the timeframe you're watching.
Most day traders live on the lower timeframes, like the 1-minute, 5-minute, or 15-minute charts. These give you a granular, real-time view of how the price is interacting with the VWAP line. A clean bounce off VWAP on a 5-minute chart is a classic, high-probability entry for countless intraday traders. It provides the clarity needed for sharp entries and exits.
Looking at VWAP on a higher timeframe, like a 1-hour chart, can still be useful for getting a sense of the overall intraday trend. However, it smooths out the minute-to-minute action so much that it's less practical for scalping or quick day trades. The key is simple: match your chart timeframe to your trading style.
Ready to stop guessing and start making data-driven decisions? The ChartsWatcher platform gives you the power to scan for high-probability VWAP setups, backtest your strategies, and receive real-time alerts so you never miss an opportunity. Take your trading to the next level by visiting https://chartswatcher.com and discover a smarter way to trade.
