A Modern Guide to Powerful Price Action Strategies
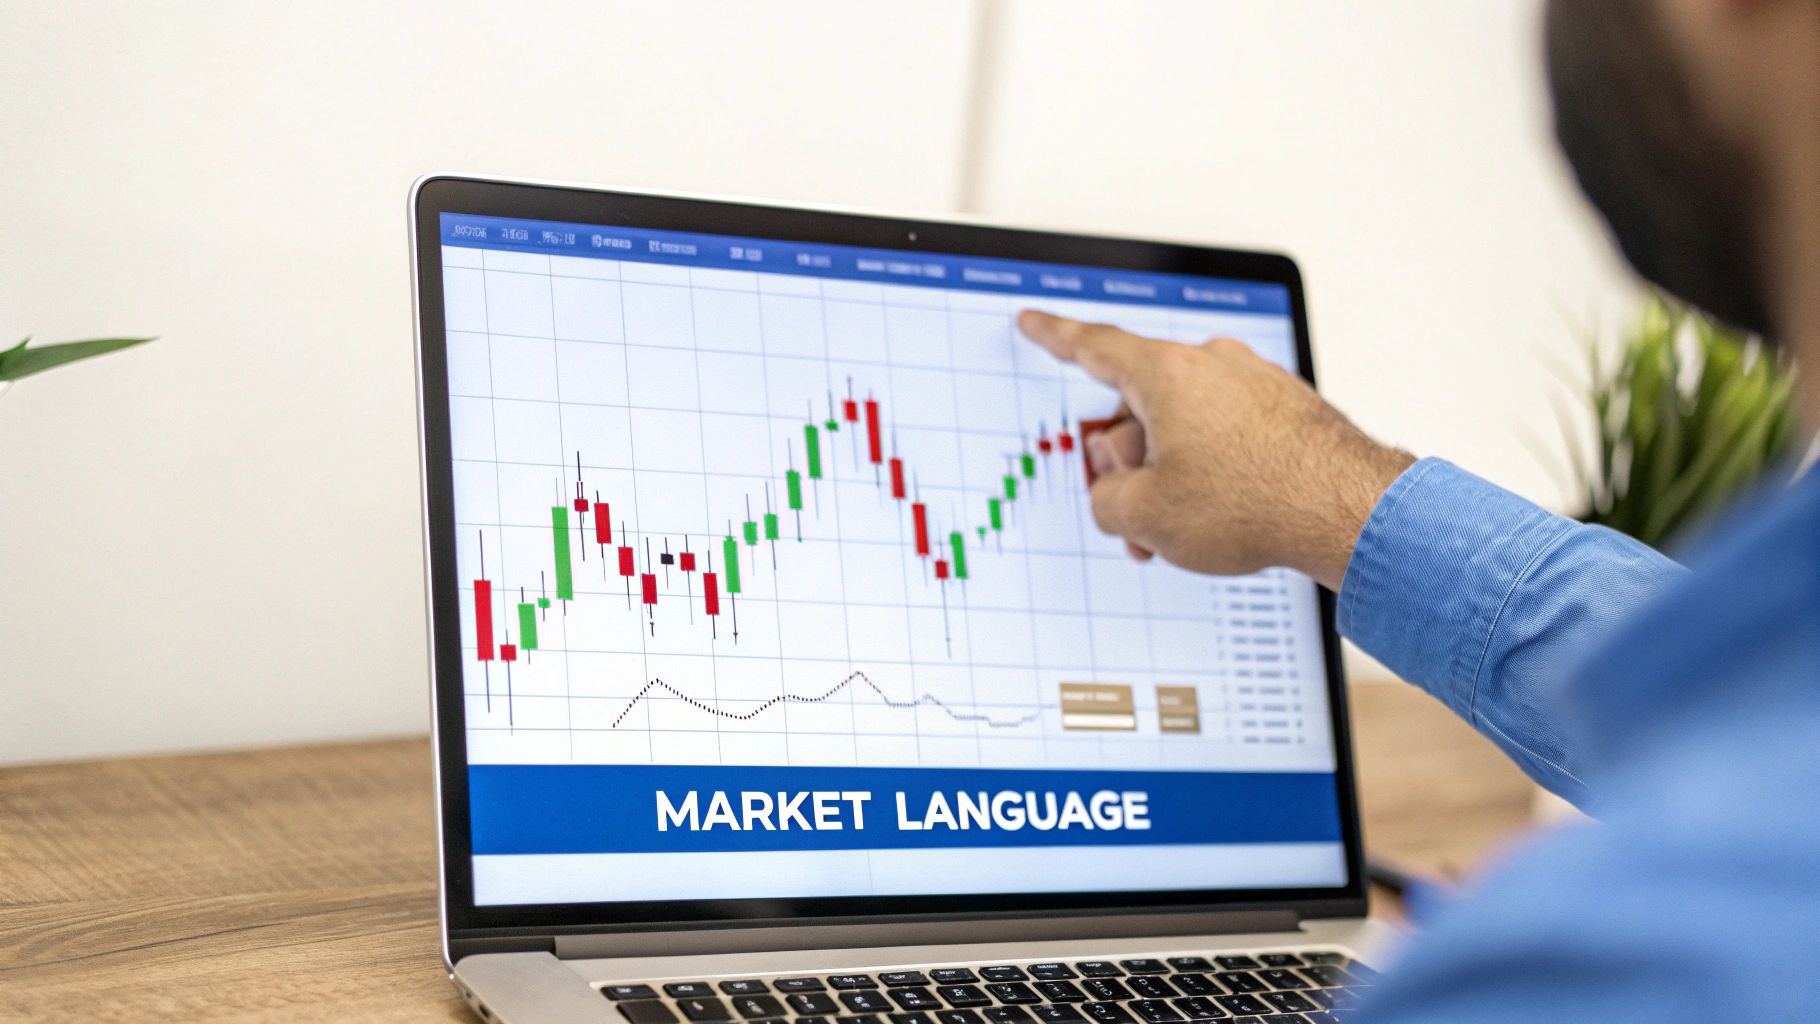
Price action is, quite simply, trading based on what price is doing right now. You’re making decisions based on the movement you see on a “naked” chart—no clutter, no mess. It’s a pure, minimalist approach that skips lagging indicators like RSI or MACD and instead focuses on reading market sentiment directly from price swings.
Understanding Price Action Without the Noise
If you've ever felt overwhelmed by charts covered in lines, oscillators, and bands, you're not alone. The real appeal of price action trading is its simplicity. It strips away all the noise and forces you to focus on the single most important data point: price itself.
Every single tick up or down is a footprint left by the battle between buyers and sellers. This isn’t some new fad, either. The idea has surprisingly deep roots, tracing all the way back to Japanese rice trader Munehisa Homma in the 1600s. He created candlestick charts to track rice prices, formalizing the idea that you could read crowd psychology right off the chart—a concept that still drives trillions of dollars in global markets today.
At its heart, trading with price action is about learning to speak the market’s native language. It’s built on a few foundational pillars that help you interpret the story unfolding on your screen.
The Pillars of Price Action Analysis
Before you can build a strategy, you have to get a handle on the core concepts. These are the building blocks of everything we'll discuss.
We can break down these fundamental ideas into a simple framework.
Core Price Action Concepts at a Glance
| Concept | What It Reveals | Practical Application |
|---|---|---|
| Trends | The market's dominant direction. | Identify if buyers (uptrend) or sellers (downtrend) are in control to trade with the flow. |
| Support & Resistance | Key horizontal price levels where reversals have occurred. | Pinpoint logical areas to enter trades, place stops, or take profits. |
| Market Structure | The pattern of swing highs and lows that builds the trend. | Spot the earliest signs of a trend weakening or reversing. |
Understanding these pillars is the key to seeing the market clearly.
-
Trends: This is the market's general direction. An uptrend is a series of higher highs and higher lows, showing buyers are in control. A downtrend, with its lower lows and lower highs, signals sellers have the upper hand.
-
Support and Resistance: Think of these as horizontal zones where the market has reversed before. Support is a price floor where buyers tend to jump in, while resistance is a ceiling where sellers usually emerge.
-
Market Structure: This is the underlying framework of swing highs and lows that defines the trend. Recognizing a break in that structure—like an uptrend failing to make a new high—is often one of the earliest clues that a reversal is on the table. For a deeper dive, check out our trader's guide to market structure trading.
The real skill in price action trading isn’t just identifying a pattern; it's understanding the context in which that pattern appears. A bullish signal at a key support level is far more powerful than one appearing in the middle of a choppy, undefined range.
By focusing on these raw elements, you stop reacting to lagging indicators and start proactively reading the flow of money. You begin to see where supply and demand are imbalanced, which helps you find logical spots to enter or exit a trade with a clear risk-to-reward profile.
This shift in perspective is what separates many consistently profitable traders from the crowd. It's about trading what the market is doing, not what an indicator suggests it might do.
Spotting High-Probability Price Patterns
Understanding the market's overall trend is just the starting point. The real craft of price action trading comes alive when you can spot specific, repeatable candlestick patterns that signal a potential change in momentum. These little formations are the visual footprints of the constant tug-of-war between buyers and sellers.
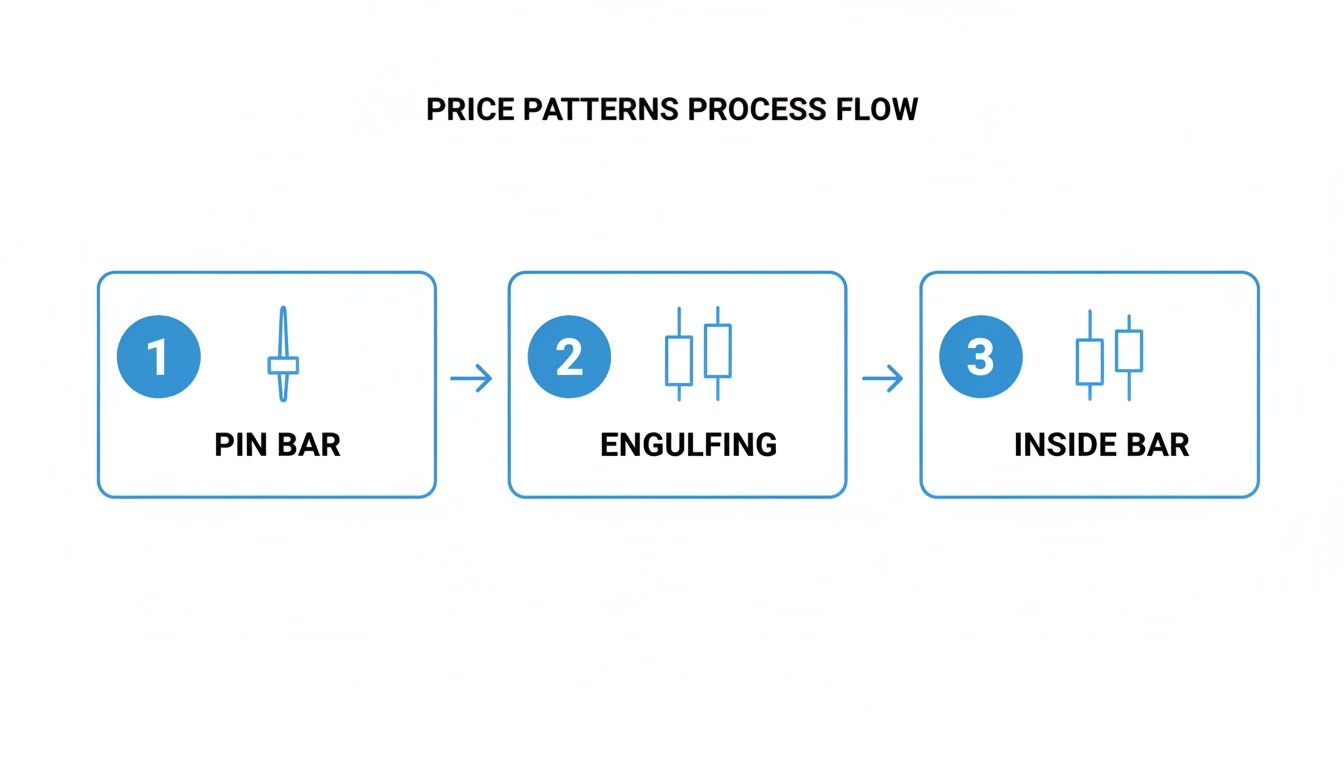
Don't think of them as guaranteed wins, but rather as high-probability clues. They show you when one side is gaining an edge, losing its grip, or when the market is just catching its breath before the next big move. You're far better off mastering a few key patterns than trying to learn dozens. We'll focus on the three heavy hitters: Pin Bars, Engulfing Bars, and Inside Bars.
The Rejection Signal: The Pin Bar
The Pin Bar, often called a "rejection candle," is one of the most potent single-candle signals you'll find on a chart. Its defining features are a long wick (or "tail") and a small body, making it look a lot like a pin.
That long wick tells a powerful story. It shows that price tried to push aggressively in one direction, only to be smacked down by overwhelming opposition, forcing it to close right back where it started.
- A bullish pin bar has a long lower wick. This tells us sellers tried to tank the price, but buyers came roaring back, driving it higher by the close.
- A bearish pin bar has a long upper wick. Here, buyers attempted a rally but were crushed by sellers who shoved the price back down.
Context is absolutely critical. A bullish pin bar popping up at a major support level is a much stronger signal than one appearing in the middle of nowhere. It's a visual confirmation that buyers are actively defending that price level.
The Momentum Shift: Engulfing Patterns
The Engulfing Pattern is a two-candle formation that screams "reversal." It often signals a powerful and immediate shift in market direction. As the name implies, it happens when one candle’s body completely swallows, or "engulfs," the body of the candle before it.
This pattern is a dead-simple visual cue that the balance of power has just swung dramatically.
- A Bullish Engulfing Pattern forms when a big green (up) candle completely covers the body of the prior, smaller red (down) candle. It shows buyers have stepped in with decisive force, wiping out the previous session's losses and hinting at a move higher.
- A Bearish Engulfing Pattern is the opposite: a large red candle's body consumes the previous smaller green candle. This is a classic sign that sellers have wrestled control from buyers, suggesting a potential top or a continuation down.
The most powerful engulfing patterns show up after a sustained move. For instance, seeing a huge bearish engulfing candle form at a resistance level after a long uptrend is a textbook sign that the rally is out of gas.
The Coiling Spring: The Inside Bar
The Inside Bar pattern signals consolidation—a period of indecision that often precedes a big breakout. It's a two-bar pattern where the second bar (the "inside bar") is completely contained within the high-to-low range of the bar before it (the "mother bar").
Think of it as the market taking a breather. Volatility dries up as neither buyers nor sellers have the strength to push price past the previous period's range. This coiling of energy is frequently the prelude to a massive price expansion.
The Inside Bar represents a temporary truce between buyers and sellers. The breakout that follows—either above the mother bar's high or below its low—often kicks off the market's next big directional leg.
This pattern is incredibly useful for finding breakout trades within an established trend. Imagine a strong uptrend that pulls back for a moment and forms an inside bar. A breakout above the mother bar's high is a high-probability signal to jump back in and ride the trend.
Learning these patterns isn't about memorization; it's about understanding the market psychology they represent. Each one tells a story about the battle for control. When you can read these stories in the context of the overall market structure, you graduate from just looking at charts to actually seeing what the price is telling you.
Building Your Own Trading System From Scratch
Spotting a great-looking price pattern on a chart feels good, but it's really just the first step. A single pattern—no matter how perfect it looks—isn't a strategy. It's just a potential signal, a flicker of opportunity in a sea of noise.
A true trading system is the complete rulebook that dictates every move you make. It covers your entry, your exit, and how you manage your risk, effectively taking emotion and guesswork out of the equation. This is where you turn a neat observation into a repeatable, testable edge in the market. When you build your own system, you're forced to think through every single detail. You’re no longer just hunting for a bullish pin bar; you're defining the exact market conditions that make that pin bar worth your capital.
This is your blueprint for action.
Think of each of these patterns as a trigger. They represent a clear psychological battle between buyers and sellers, and your job is to have a pre-defined plan ready to execute the moment one appears.
Nail Down Your Entry Triggers
Your entry trigger is the specific, non-negotiable event that tells you, "It's time to go." Vague rules like "buy after a pin bar" are a recipe for disaster. They leave too much room for interpretation and second-guessing.
Instead, a robust entry rule sounds something like this:
- Bullish Pin Bar: "I will buy at the break of the pin bar's high, but only if the bar forms at a known support level and the 20-period moving average is pointing up."
- Bearish Engulfing: "I will sell at the break of the engulfing bar's low, but only if it occurs at a major resistance zone and rejects the 50-period moving average."
See the difference? These rules add context, which is where the real edge in price action strategies comes from. Backtesting data consistently shows that adding simple trend or location filters can improve risk-adjusted returns by 10–30% over trading patterns in isolation. Context is everything. You can read more about how this improves price action performance on priceaction.com.
Define Your Exits: Stop-Loss and Profit Targets
Once you're in, the plan still runs the show. Your stop-loss isn't just an arbitrary price point to limit losses; it’s the exact level where your original trade idea is proven wrong.
A logical stop-loss is placed where the market structure would have to break for your setup to be invalidated. For a bullish setup, this is often just a few ticks below the low of your signal candle or the most recent swing low.
Profit targets need to be just as logical. Don't just hope for the moon. Ask yourself: where are the sellers likely to show up and push the price back down? Common target areas include:
- The next major resistance level.
- A measured move based on a previous price swing.
- A fixed risk-to-reward ratio, like taking profits at 2:1 R:R.
Put Your Search on Autopilot
Let’s be honest: manually scanning hundreds of charts for these hyper-specific conditions is a soul-crushing and error-prone task. This is where you let technology do the heavy lifting.
A good market scanner is your best friend here. Instead of burning out your eyes, you can translate your system's rules into an automated search. For example, using a tool like ChartsWatcher, you can build a custom scan that only pings you when a stock meets all your criteria:
- The stock is trading above its 50-day moving average.
- A bullish engulfing pattern just formed on the daily chart.
- The pattern’s low is within 1% of a key support level.
This approach flips the script. You spend less time hunting for needles in a haystack and more time analyzing high-probability setups that perfectly match your trading plan. It enforces discipline by filtering out all the noise and tempting, half-baked setups that wreck accounts. You build a consistent, repeatable process that can be tested, refined, and executed with precision.
How to Realistically Backtest Your Strategy
Let's be blunt: an untested trading system isn't a system at all. It's just a hypothesis. Backtesting is where you take those well-defined rules you’ve created and throw them against the harsh reality of historical market data. It’s the critical step where you find out if your great idea is actually a profitable strategy, all without risking a single dollar.
This isn't about chasing some "perfect" system that never loses—those don't exist outside of marketing fantasies. The real goal here is to get to know your strategy’s personality. You need to uncover its strengths, weaknesses, and statistical DNA before you ever have to face the emotional rollercoaster of live trading.
Setting Up Your Backtest Environment
To run a reliable test, you need two things: clean historical data and a capable backtesting engine. The quality of your data is absolutely non-negotiable. Using flawed, incomplete, or inaccurate data will give you misleading results and a dangerous sense of false confidence.
Thankfully, getting good data is easier than ever. Commercial providers now offer 15–20 years of 1-minute bars for over 10,000 global stocks. You can also find deep history for over 100 major futures contracts and tick-by-tick or minute data for roughly 70 major forex pairs going back to around 2010. This kind of depth is what allows for robust testing of price-action rules across bull markets, bear markets, and everything in between. You can learn more about the evolution of market data on cboe.com.
Once the data is sorted, you need a platform to run the simulation. While manually scrolling through old charts has its place for brainstorming, it's far too slow and subjective for serious testing. A software-based approach is the only way to go. Platforms like ChartsWatcher let you programmatically define your strategy's rules and simulate its performance across years of data in just a few minutes.
Key Metrics to Analyze
After your backtest finishes, you’ll get a performance report packed with numbers. It's tempting to just look at the total profit and call it a day, but the real story is buried in the details. Understanding these metrics is what separates amateurs from pros.
Here’s what you absolutely need to dig into:
- Total Net Profit: The bottom line. It's the first thing everyone looks at, but it's meaningless without the context of the other numbers.
- Profit Factor: This is your gross profit divided by your gross loss. Anything above 1.0 means you're profitable. Most professional traders I know won't even look at a system unless its profit factor is 1.5 or higher.
- Win Rate: The percentage of trades that were winners. Don't get hung up on this one; a high win rate is not a requirement for profitability, especially if your average winning trade is much larger than your average loser.
- Maximum Drawdown: The biggest drop in your account equity from a peak to a subsequent low. This is a direct measure of risk and tells you the worst pain you would have had to endure to stick with the strategy.
Key Takeaway: If you only look at one metric, make it the maximum drawdown. It answers the most important question: "Could I actually handle this strategy when it's going through its worst losing streak?" If the drawdown is 40%, you have to be brutally honest with yourself. Could you stomach losing nearly half your account without panicking and abandoning the system?
Putting these numbers together paints the full picture. A strategy with a modest 45% win rate but a strong profit factor of 2.1 and a manageable drawdown could be a fantastic system. On the flip side, a system with a 70% win rate but a tiny profit factor and terrifying drawdowns is probably a recipe for disaster.
For a deeper dive, check out our detailed guide on how to backtest trading strategies like a pro.
Avoiding Common Backtesting Traps
Backtesting is a powerful tool, but it's also riddled with traps that can produce dangerously over-optimistic results. Just being aware of them is half the battle.
One of the biggest culprits is overfitting, also known as curve-fitting. This happens when you endlessly tweak your rules and parameters until they perfectly match the historical data you're testing on. The system looks incredible on paper but falls apart in live trading because you didn't find a real edge—you just modeled the past's random noise.
Another huge mistake is ignoring trading costs. Every single trade you take will have costs attached, from commissions to slippage (the difference between the price you wanted and the price you got). These might seem small on a trade-by-trade basis, but over hundreds or thousands of trades, they add up and can easily turn a profitable-looking backtest into a money-loser in the real world. Always factor in realistic cost estimates to get an honest assessment of performance.
Putting Your Strategy to Work in Live Markets
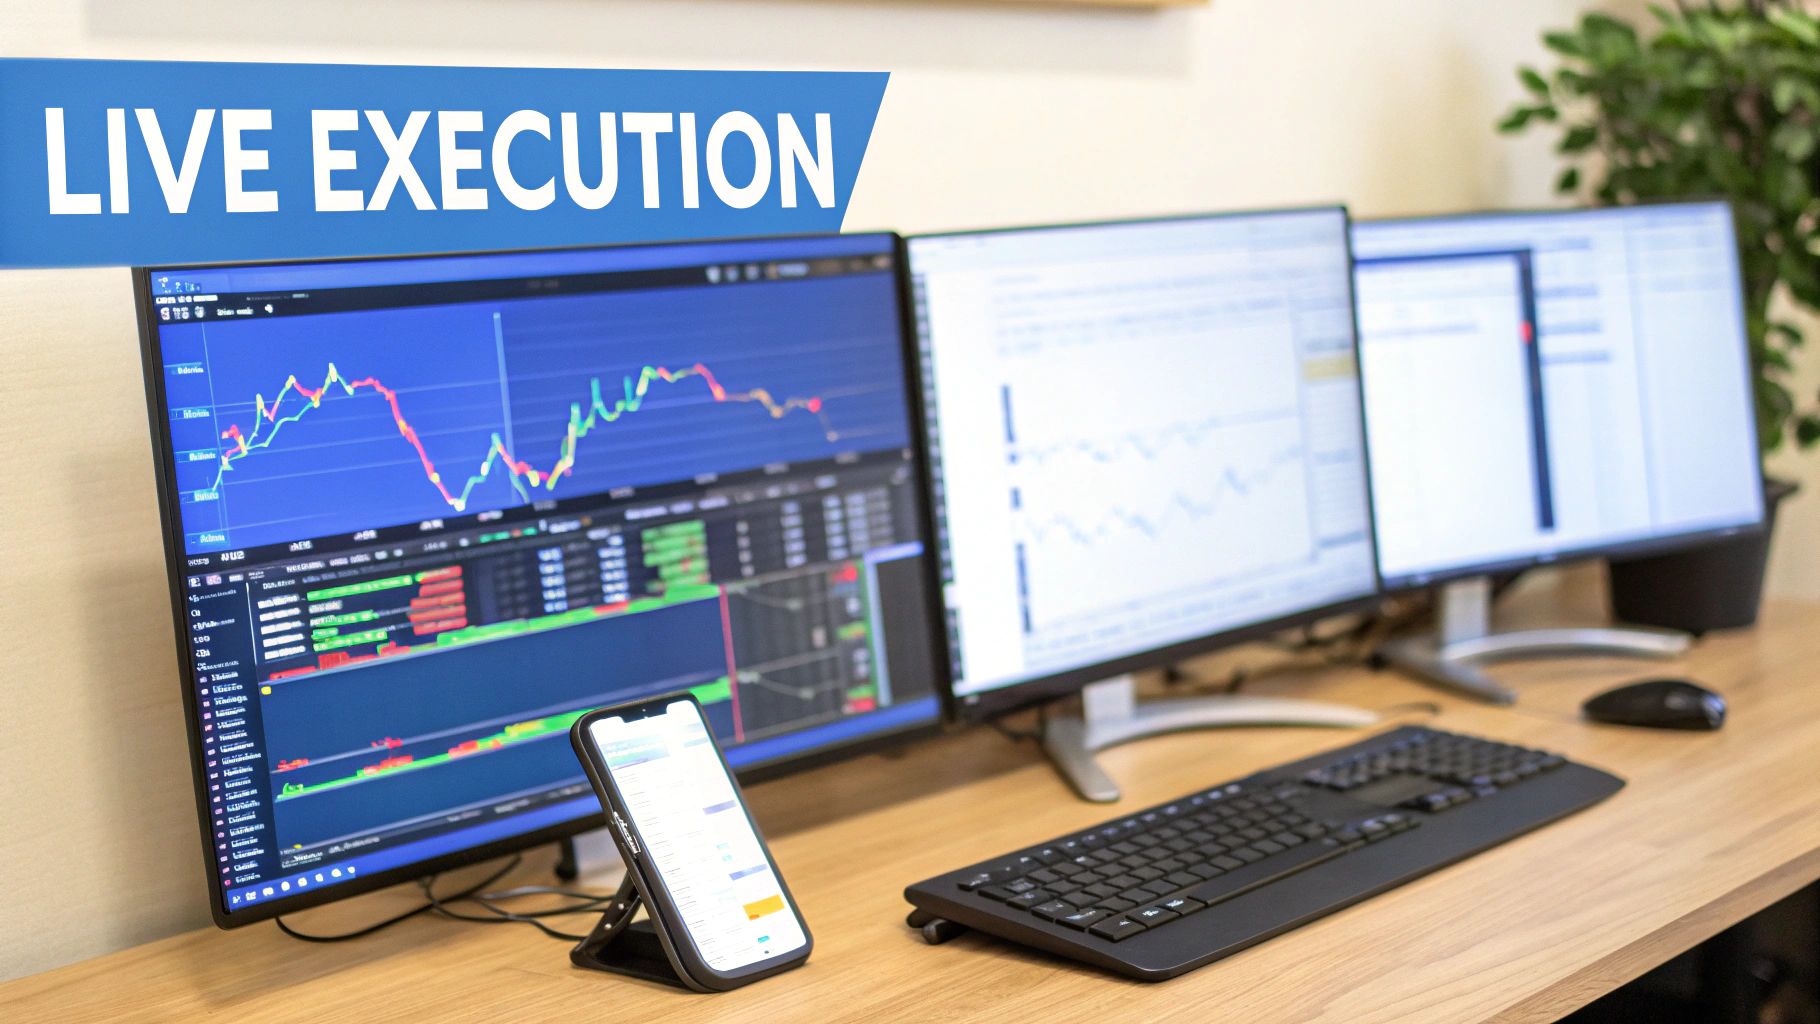
This is where the rubber meets the road. The leap from the clean, predictable world of a backtest to the chaotic reality of live markets is where most traders fail. Suddenly, every single tick of the price chart has real money—and real emotion—attached to it.
Making this jump successfully isn’t just a technical exercise; it's a test of your discipline, your process, and your mental toughness. Backtesting proved your strategy had a historical edge, but live execution determines if you can actually capture that edge.
Your mindset has to shift. You're no longer an analyst trying to predict the market's next move. Instead, you're the manager of a proven system, tasked with one job: flawlessly executing your rules when a valid setup appears.
Automate Your Observation, Not Your Decisions
One of the biggest traps in trading is excessive screen time. Staring at charts for hours on end, waiting for that perfect pattern, is a recipe for disaster. It leads to fatigue, impatience, and ultimately, bad decisions. You start seeing patterns that aren't really there or talking yourself into a subpar trade just to feel like you're doing something.
There's a much smarter way: automate the monitoring process. This is where a powerful scanner becomes your most valuable tool.
-
Real-Time Alerts: Stop hunting for setups. Configure your scanner to do the heavy lifting. With a tool like ChartsWatcher, you can build an alert based on the exact rules you defined in your trading plan. When a stock forms a perfect pin bar at a key support level, ding—you get a notification.
-
Custom Dashboards: Ditch the noise. Build a dashboard that shows you only what matters to your strategy. This might be a list of stocks approaching key levels, a watchlist filtered by your trend criteria, or a real-time feed of your active alerts. It keeps you focused on the highest-probability opportunities.
When you let technology monitor the market, you free yourself from being chained to the screen. You can step away, confident you won’t miss anything, and engage only when your specific conditions are met. This preserves your mental energy for the only part that matters: executing the trade.
Your goal should be to work smarter, not harder. Let technology do the tedious work of finding setups. Save your brainpower for managing your trades and analyzing performance.
Taming the Psychological Demons
Let's be honest: executing price action strategies in a live market is 90% psychology. The second real money is on the line, powerful emotions like fear and greed will show up and try to sabotage your plan.
-
Hesitation: You see the perfect setup. The alert goes off. But you freeze. "What if this is the one that fails?" That's the fear of losing talking. The only way to push through it is to have unshakable confidence in your backtested edge and a commitment to follow your plan no matter what.
-
Impulsiveness: The market is ripping higher, and you feel that familiar FOMO (fear of missing out). You jump into a trade that almost fits your rules, but not quite. That's greed. The cure is patience and the discipline to wait for your A+ setup.
The solution to both of these problems is a completely mechanical, rule-based approach. Your trading plan is your shield. If the rules say "enter," you enter. If they say "the stop goes here," you place it there. No second-guessing. No "gut feelings."
The Unfair Advantage of a Trading Journal
Finally, the single most important tool for your long-term growth is a trading journal. This is where you document every single trade—not just the P&L, but the why behind it.
A good journal entry includes a screenshot of the setup, your reasons for taking the trade, where you got out, and a few notes on how you were feeling. Over time, this data becomes a goldmine. You'll start to see patterns in your own behavior, spotting the mistakes you keep making and reinforcing the actions that lead to your biggest wins. It’s how you refine your strategy based on hard data, not just your emotional reaction to the last few trades.
Got Questions About Price Action? Let's Clear Things Up.
As you get your hands dirty with price action, a few questions always seem to pop up. It's totally normal. This isn't a black-and-white field; nuance is everything, and figuring out the common sticking points early on can save you a ton of headaches. Let's tackle some of the most frequent questions I hear from traders trying to build and master their strategies.
Can You Fully Automate Price Action Strategies?
This is the holy grail for a lot of traders, isn't it? The short answer is: sort of. While you can absolutely fully automate the process of finding setups, the final execution trigger often benefits from a human eye. True price action trading involves reading the context—things like the subtle strength of a trend or the real conviction behind a breakout. That's a feel that algorithms still struggle to replicate perfectly.
The best approach, in my experience, is a hybrid one. Let the machines do what they do best: the heavy lifting.
- Scanning: Set up a tool like ChartsWatcher to grind through thousands of charts, tirelessly looking for your exact setup criteria 24/7.
- Alerting: Get a notification the second a high-probability pattern appears in the right market environment.
- Analysis: Now, you step in. Apply your trained eye to the handful of pre-qualified setups the scanner found.
This way, you get the best of both worlds. You're leveraging the incredible efficiency of automation without giving up the nuanced insight that a human trader brings. You avoid burnout from staring at screens all day and make sure your capital is only risked on the A+ opportunities.
What’s the Best Timeframe for Price Action Trading?
Good news: price action principles are fractal. That's just a fancy way of saying the patterns work on pretty much any timeframe, from a one-minute chart right up to a weekly one. The patterns are reflections of human psychology, and that doesn't change whether you're looking at a day or a month.
There's no single "best" timeframe. The right one is the one that fits your personality and schedule.
- Day traders will naturally gravitate to the 5-minute or 15-minute charts to get in and out of moves within the day.
- Swing traders (like myself) often live on the 4-hour and daily charts, aiming to hold positions for a few days or weeks.
- Position traders take the long view, making decisions based on the weekly and even monthly charts.
The most important thing is consistency. If you develop and backtest a strategy on the daily chart, you need to execute it on the daily chart. Hopping between timeframes without a clear, structured multi-timeframe analysis plan is a surefire way to get conflicting signals and wreck your decision-making.
How Do I Deal with Big News Events?
Major economic news—think central bank meetings or jobs reports—can throw a grenade into the market. For a short period, volatility goes through the roof, and all technical analysis can go right out the window. Price becomes driven by high-frequency algorithms and pure, raw reaction, not the established patterns we look for.
For this reason, many seasoned price action traders simply choose to be flat—holding no positions—around high-impact events. It's a simple, effective risk management tactic.
The wild, unpredictable swings can easily take out your stop-loss on what was otherwise a perfectly good setup. A common rule of thumb is to avoid entering any new trades in the 30 minutes before and after a major news release is scheduled. If you're already in a trade, you have a few options: tighten your stop-loss to reduce your risk, or maybe even bank some partial profits before the event hits.
Do I Really Need Indicators with Price Action?
By definition, pure price action trading is done on a "naked" chart. The whole philosophy is that the price itself tells you everything you need to know.
But let's be pragmatic. Some traders find it helpful to use one or two simple indicators to provide context, not as direct buy or sell signals.
A perfect example is using a 20 or 50-period moving average. It’s not there to give you an entry signal. Instead, it’s a brilliant tool for quickly and objectively confirming the direction and strength of the underlying trend. Seeing a textbook bullish pin bar form right at a rising 50-period moving average adds another powerful layer of confirmation to the setup. The indicator isn't the reason to take the trade; it's just confirming that the market environment is primed for the price action signal you've already spotted.
The goal is to keep your charts clean. Avoid the "analysis paralysis" that comes from having a dozen conflicting indicators plastered everywhere. If an indicator doesn't serve a clear, specific purpose that complements your price action analysis, it's just noise. Get rid of it.
Ready to stop hunting for setups and start analyzing high-probability opportunities? ChartsWatcher lets you build custom scans and alerts based on your unique price action strategies. Let our platform do the heavy lifting so you can focus on execution. Discover the power of automated scanning at chartswatcher.com.
