8 Trend Following Strategies to Boost Profits
Riding the Waves of Market Trends
In the world of finance, understanding market trends is essential for success. History, from the 17th-century tulip mania to the late-90s tech bubble, shows both the potential and the risks of trending markets. Trend following strategies, rooted in technical analysis and refined through years of observation, provide a structured way to identify and profit from market momentum.
The key to effective trend following is systematically identifying a trend's emergence, continuation, and eventual end. This allows traders to enter positions early, manage risk, and exit profitably. It requires a solid understanding of technical indicators, chart patterns, and risk management.
This article explores eight powerful trend following strategies based on these core concepts. These strategies provide the tools and knowledge to navigate the market in 2025 and beyond.
Different Trading Styles, One Goal
Whether you're a day trader looking for quick profits, a swing trader focusing on intermediate-term moves, or a long-term investor seeking sustained growth, the insights here will help you analyze market dynamics. You'll be better equipped to identify promising opportunities and develop solid trading plans. Get ready to explore the world of trend following and discover how these techniques can enhance your trading.
1. Moving Average Crossover
The Moving Average Crossover is a cornerstone of trend-following strategies. Traders prize it for its simplicity and effectiveness in identifying established trends. This strategy uses the interplay between two or more moving averages (MAs) with different time periods to create buy and sell signals. It's a classic technical indicator that filters out market noise and helps traders spot shifts in momentum.
How It Works
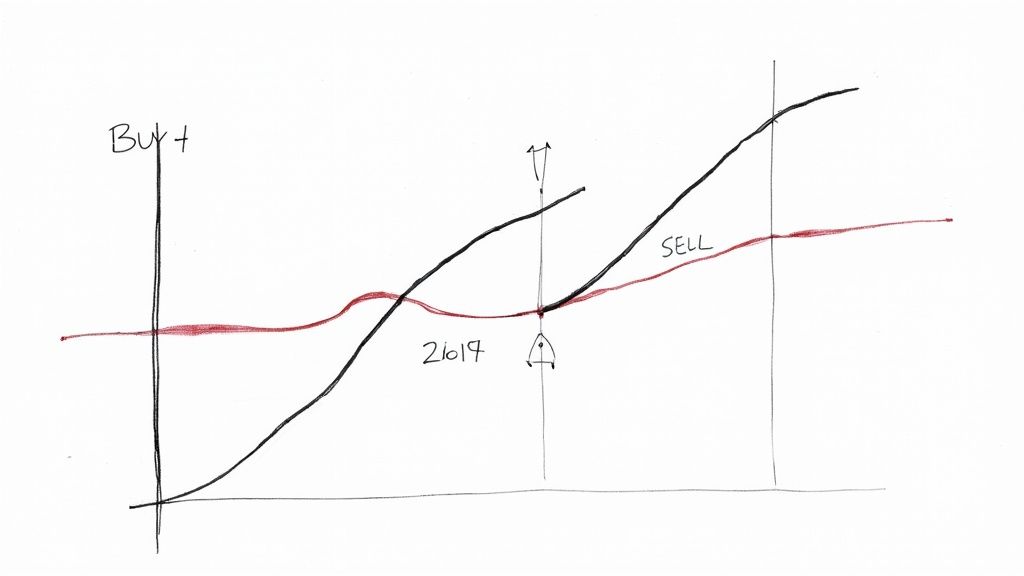
The core concept is simple. When a shorter-term MA crosses above a longer-term MA, it generates a buy signal. This is known as a bullish crossover. Conversely, when the shorter-term MA crosses below the longer-term MA, it generates a sell signal, called a bearish crossover. This crossover suggests a potential change in market sentiment and the start or continuation of a trend.
Features and Benefits
- Multiple MA Combinations: Traders can use various MA periods, tailoring the strategy to their preferred time frame. Common combinations include the 50-day and 200-day MAs, and the 20-day and 50-day MAs for shorter-term trends. The 50/200 day combination is often referred to as the "Golden Cross" (bullish) and "Death Cross" (bearish).
- Simplicity and Automation: The MA crossover is easy to understand and implement. Its clear signals make it suitable for automated trading systems using platforms like MetaTrader.
- Broad Applicability: This strategy applies to various asset classes, including stocks, currencies, commodities, and indices.
- Reduced Emotional Impact: Using objective signals generated by the crossover can minimize emotional decision-making.
Pros and Cons
Here's a quick breakdown of the advantages and disadvantages:
| Pros | Cons |
|---|---|
| Easy to understand and implement | Prone to whipsaws in choppy markets |
| Identifies medium to long-term trends | Signals lag price action |
| Reduces emotional decision-making | Requires parameter optimization |
| Applicable across most tradable markets | May generate false signals in low volatility |
Real-World Examples
- The "Golden Cross" in the S&P 500 has historically been a strong signal for long-term investors.
- Trend followers using MA crossovers profited during the 2008 financial crisis by identifying the downtrend.
- Many ETFs and managed futures funds use MA crossover strategies.
Historical Context and Popularization
The use of moving averages gained popularity thanks to technical analysts like John Murphy. Trend-following pioneers like Bill Dunn and the Turtle Traders, mentored by Richard Dennis, further solidified the MA crossover as a powerful tool. These traders proved that systematic strategies based on simple rules could generate substantial returns.
Practical Tips for Implementation
- Confirmation Indicators: Use additional indicators like volume or momentum oscillators (e.g., RSI, MACD) to confirm signals.
- Exponential Moving Averages (EMAs): Consider using EMAs, which give more weight to recent price data.
- Market-Specific Optimization: Test different MA combinations and periods to find the optimal settings.
- Risk Management: Implement proper position sizing and techniques like stop-loss orders.
The Moving Average Crossover is a valuable tool for trend followers. It provides a straightforward way to identify and exploit market trends while minimizing emotional biases. Understanding its limitations and implementing it with careful consideration of market conditions and risk management is crucial for success.
2. Breakout Trading
Breakout trading is a cornerstone of trend-following strategies. It capitalizes on the momentum created when an asset's price moves through a significant support or resistance level. This decisive movement often signals a shift in market sentiment. It can also indicate the potential start of a sustained trend, offering traders a chance to profit from the price action. The strategy's clear entry and exit signals make it popular with both new and experienced traders.

How Breakout Trading Works
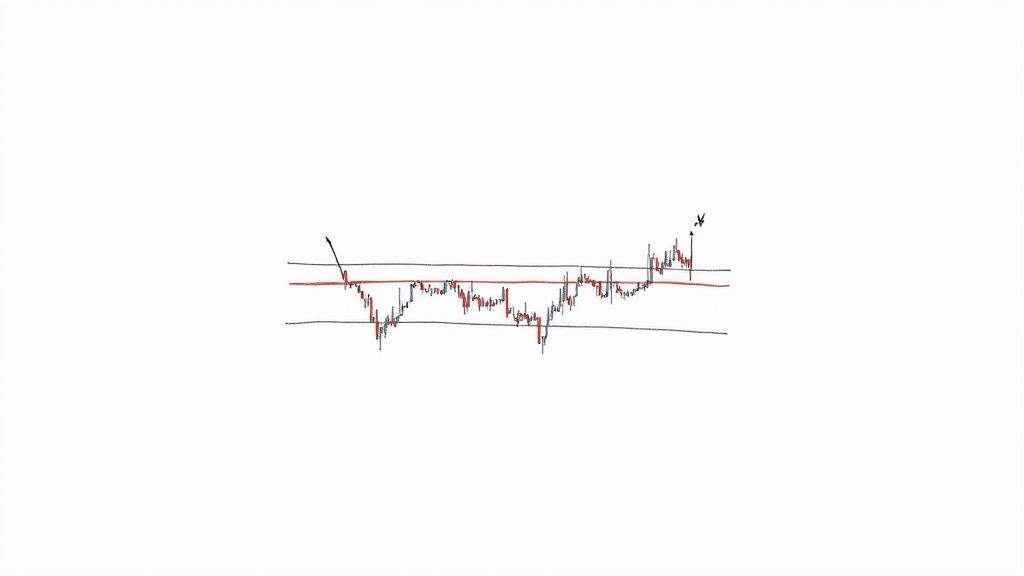
Breakout trading revolves around identifying established trading ranges, chart patterns, or key support/resistance levels. These zones represent periods of price consolidation, where supply and demand are relatively balanced. A decisive break beyond these boundaries suggests one side of the market (buyers or sellers) has taken control. This shift can initiate a new trend.
Traders typically place entry orders just beyond the breakout level. The idea is that momentum will push the price further in the breakout's direction after the breakout occurs. For example, a buy order would be placed slightly above the resistance level in an upside breakout. In a downside breakout, a sell order would be placed slightly below the support level.
Features and Benefits
Breakout trading offers several advantages:
- Clear Entry and Exit Signals: The breakout level provides a clear entry point. Stop-loss orders, placed just below the breakout level (for long positions) or above it (for short positions), define the exit point if a false breakout occurs.
- Potential to Capture Major Trend Moves: A true breakout allows traders to enter a trade early in a potentially significant price move, maximizing profit potential.
- Effective in Volatile Markets: Breakout strategies are effective in markets with a strong directional bias. Volatility helps fuel sustained price movements.
Pros and Cons
| Pros | Cons |
|---|---|
| Provides clear entry and exit signals | Subject to false breakouts ('fakeouts') |
| Can capture the beginning of major trend moves | Requires vigilant monitoring of price action |
| Works well in volatile markets | Less effective in low-volatility markets |
| Relatively simple concept to understand | Entry timing significantly impacts profitability |
Real-World Examples and Evolution
Breakout trading's origins can be traced back to the early 20th century with the work of Jesse Livermore. Its popularity grew with Richard Dennis and the Turtle Trading system, which systematically exploited breakouts. Linda Bradford Raschke further refined the approach with her LBR Breakout method. Bitcoin's surge past the $20,000 resistance level in December 2020 is a prominent example of a successful breakout. Conversely, crude oil's breakdown below key support levels in 2014 signaled a major downtrend. Many commodity trading advisors (CTAs) continue to rely on breakout systems.
Practical Tips for Implementation
- Confirmation is Key: Wait for a candlestick close beyond the breakout level. This helps confirm the breakout's validity and reduces the risk of false signals.
- Volume as a Validation Tool: Increased trading volume during a breakout often suggests stronger conviction and a lower likelihood of a fakeout.
- Volatility-Based Stop Losses: Use volatility-based stop losses, such as those based on Average True Range (ATR), instead of fixed-price stops to account for market fluctuations.
- Beware of News Events: Important news releases or economic events can trigger temporary breakouts that quickly reverse.
Breakout trading remains popular due to its straightforward logic and the potential to capture significant market moves. By understanding its nuances and using prudent risk management, traders can use this strategy effectively. It offers a robust and time-tested method for identifying and profiting from emerging trends.
3. Donchian Channel Strategy
The Donchian Channel Strategy is a classic trend-following method. It provides a reliable and proven way to capture market momentum. Developed by Richard Donchian, known as the "Father of Trend Following," this strategy identifies and profits from emerging trends. It does this by tracking price breakouts from dynamically adjusted channels. Its continued popularity and use in many successful trading systems highlight its effectiveness in various market conditions.
How It Works
The Donchian Channel plots the highest high and lowest low of an asset's price over a specific period. This period, called a lookback period, is typically 20 days. This creates a dynamic price channel that captures the market's recent volatility. A buy signal occurs when the current price exceeds the channel's upper band (the highest high of the last N periods). This suggests a potential uptrend. Conversely, a sell signal happens when the price falls below the lower band (the lowest low of the last N periods), indicating a possible downtrend. The strategy's main goal is to capture the momentum of new trends by pinpointing these breakout points.
Key Features and Benefits
-
Clear Entry and Exit Signals: The channel's boundaries offer objective entry and exit points. This helps remove emotional decisions from trading.
-
Adaptability: The lookback period can be modified to suit different market situations and trading preferences. Shorter periods make it more sensitive to price changes, while longer periods filter out more noise.
-
Built-in Risk Management: The channel acts as a dynamic stop-loss level. Trailing stops based on the channel's boundaries can further improve risk management.
-
Volatility-Based Position Sizing: Many traders use position sizing rules based on market volatility. This allows for larger positions in calmer markets and smaller positions during volatile periods.
Pros and Cons
Pros:
-
Captures Significant Trends: The strategy aims to profit from sustained trends across various markets.
-
Objective Trading Rules: Clear rules minimize emotional bias and encourage disciplined trading.
-
Adaptable to Different Markets: Adjusting parameters allows for customization based on market volatility and individual preferences.
-
Inherent Risk Management: Trailing stops and channel boundaries help manage risk.
Cons:
-
Whipsaws in Range-Bound Markets: During periods of price consolidation, the strategy can produce false signals. This can lead to losses from erratic price swings.
-
Missed Entry Points: Waiting for a breakout can sometimes mean missing the initial part of a trend.
-
Parameter Sensitivity: The strategy's performance depends heavily on the chosen lookback period.
-
Potential for Drawdowns: Sudden trend reversals can result in significant drawdowns.
Real-World Examples and Evolution
The Donchian Channel strategy gained fame through its inclusion in the Turtle Trading system. This system produced exceptional results in the 1980s. Developed by Richard Dennis and William Eckhardt, it showcased the Donchian Channel's ability to generate substantial profits in the commodities markets. The Turtle Traders' success solidified the strategy's position as a strong tool for trend following. Today, many systematic Commodity Trading Advisors (CTAs) continue to use Donchian Channels.
Practical Tips for Implementation
-
Trend Filters: Adding trend filters, like moving averages, can reduce false signals during range-bound markets.
-
Volatility Adjustment: Adjust the channel length according to the traded instrument's volatility. Higher volatility usually requires longer lookback periods.
-
Pyramiding: Consider gradually increasing positions as a trend develops, adding to winning trades as new highs are reached.
-
Alternative Exit Strategies: Explore different exit strategies. These could include trailing stops or taking partial profits at pre-set levels. This helps maximize profits and manage risk.
The Donchian Channel strategy offers a solid method for capturing market trends. Its clear rules, adaptability, and risk management features make it useful for all traders. While it has limitations, understanding its nuances and using the tips above can improve its effectiveness. This can contribute to long-term trading success.
4. Momentum-Based Trend Following
Momentum-Based Trend Following is a strategy that profits from the tendency of strong price movements to continue. Instead of reacting to current prices, this approach focuses on the rate of price change. This allows traders to identify and exploit powerful directional moves, often before traditional trend-following methods catch on. It's a valuable tool for capturing significant market swings.
Unlike strategies based on moving averages, momentum trading identifies assets exhibiting the strongest upward or downward price momentum. It operates on the principle that "winners keep winning" and "losers keep losing," at least for the short to medium term. Several methods achieve this:
- Rate-of-Change (ROC) and Relative Strength Indicators: These tools measure the speed and magnitude of price changes. They help traders distinguish genuine strong momentum from normal price fluctuations.
- Cross-Sectional Momentum: This compares the performance of different assets within a group (e.g., stocks in the S&P 500). It ranks them by relative momentum. This diversifies portfolios and focuses investment in the strongest performers.
- Time-Series Momentum: This compares the current price of an asset to its past prices over a specific timeframe. A quick price increase suggests strong positive momentum, while a rapid decline indicates negative momentum.
The effectiveness of momentum-based trend following is clear in real-world use and historical performance. AQR Capital Management, a quantitative investment firm co-founded by Cliff Asness, a prominent figure in momentum investing, uses this strategy in its managed futures programs. The outperformance of momentum factor strategies in global equity markets further confirms its effectiveness. Commodity Trading Advisors (CTAs) successfully used momentum strategies during the 2008 financial crisis, demonstrating its resilience during extreme market stress. For more insight, check out Our guide on Identifying Market Trends.
While momentum-based trend following offers advantages, it's important to understand its potential drawbacks:
Pros and Cons of Momentum-Based Trend Following
| Pros | Cons |
|---|---|
| Early Trend Identification: Captures trends sooner than moving average systems. | Frequent Rebalancing: Requires regular portfolio adjustments. |
| Multi-Asset Class Applicability: Works across various asset classes. | Reversal Vulnerability: Susceptible to losses during sharp market reversals. |
| Portfolio Diversification: Cross-sectional momentum allows for diversified portfolios. | Computational Intensity: More computationally complex than simpler strategies. |
| Crisis Resilience: Historically strong performance during market downturns. | Higher Transaction Costs: More frequent trading increases transaction costs. |
Tips for Implementing Momentum-Based Trend Following
Here are some practical tips for implementing momentum-based trend following:
- Longer Lookback Periods: Using lookback periods of 3-12 months provides more stable signals.
- Combined Momentum Signals: Integrate absolute and relative momentum measures.
- Risk-Adjusted Position Sizing: Implement strategies based on volatility to manage risk.
- Sector-Specific Momentum: For equity strategies, consider sector-specific momentum.
The work of academics like Jegadeesh and Titman, who documented the "momentum effect," and Gary Antonacci, known for his Dual Momentum approach, has further developed momentum investing. Its ability to capture early trends, its adaptability, and its potential for strong risk-adjusted returns make it a valuable trend-following strategy.
5. Volatility Breakout Systems
Volatility Breakout Systems represent a more advanced type of trend-following strategy. Instead of using fixed price levels for entries and exits, these systems adapt to current market conditions by using volatility measurements. This adaptability makes them a powerful tool for traders looking to profit from big price swings while mitigating risks during calmer periods. This dynamic approach gives Volatility Breakout Systems a well-deserved spot on this list of essential trend-following strategies.
These systems work on the idea that breakouts are more likely to be real when they happen alongside increased volatility. By measuring market volatility using indicators like the Average True Range (ATR) Average True Range (ATR) or standard deviation, traders can set dynamic thresholds for entry and exit. A common setup might be to enter a long position when the price goes above a certain multiple (like 1.5x or 2x) of the ATR above the previous day's high. Stop-loss and take-profit levels are also adjusted based on the current volatility, making sure risk management stays in line with market conditions.
Features and Benefits
-
Volatility Measurement: Uses indicators like ATR or standard deviation to measure market volatility.
-
Dynamic Entry & Exit: Triggers entries when the price breaks through a volatility-based threshold, and sets dynamic stop-loss and take-profit levels.
-
Volatility-Based Position Sizing: Often factors volatility into position sizing, lowering risk during periods of high volatility.
-
Adaptability: Automatically adjusts to changing market conditions, improving performance across different environments.
-
Reduced False Signals: Filters out noise in low-volatility markets, resulting in better trading signals.
-
Objective Criteria: Provides clear, data-driven rules for entry and exit based on how the market is behaving.
-
Built-in Risk Management: Offers risk management through volatility-adjusted position sizing and stops.
Pros
-
Adapts automatically to changing market conditions.
-
Reduces false signals in low-volatility environments.
-
Provides objective entry and exit criteria.
-
Built-in risk management through volatility-adjusted position sizing.
Cons
-
More complex to implement than breakout systems with fixed levels.
-
Requires more advanced programming and testing.
-
Parameter selection can have a big impact on performance.
-
Might lead to wider stops during periods of high volatility, potentially increasing the risk of being stopped out.
Real-World Examples and Evolution
Volatility breakout systems became well-known through the work of traders like Larry Williams, known for his volatility-based trading systems used in short-term futures. Toby Crabel, author of "Day Trading with Short Term Price Patterns," further popularized the concept with his volatility-based opening range breakout strategies. Systematic hedge funds, such as Winton Capital, are also known to use sophisticated volatility breakout models. These approaches demonstrate the effectiveness of volatility breakout systems in various markets and timeframes.
Practical Tips for Implementation
-
Start Simple: Begin with ATR-based breakouts, as these are simpler to implement and understand.
-
Optimize Lookback Period: Experiment with different volatility lookback periods (for example, 10-day, 20-day ATR) to find what works best for your target market.
-
Multiple Timeframes: Think about incorporating volatility filters across multiple timeframes to improve signal quality.
-
Inverse Volatility Position Sizing: Adjust position size in inverse proportion to volatility. This reduces risk during high-volatility periods and increases it during lower-volatility periods when breakout signals have a better chance of being successful.
By understanding how volatility breakout systems work, traders can develop strong trend-following strategies that adapt to the constantly changing market. These systems provide a powerful mix of objective entry and exit rules with built-in risk management, making them a valuable resource for any serious trader.
6. Multi-Timeframe Trend Following
Multi-Timeframe Trend Following is a strategy that takes trend trading a step further than simply responding to price changes on a single chart. It uses a broader perspective by analyzing trends across multiple time horizons, providing a more robust and nuanced approach to trading. This technique is valuable for any trend follower because it helps filter out market noise, confirm the direction of a trend, and improve the timing of entries and exits.
This approach is based on the idea that stronger, more reliable trends are confirmed across multiple timeframes. For example, a bullish trend on a weekly chart is more significant if it's also an uptrend on the daily and hourly charts. On the other hand, a bullish signal on a short-term chart that contradicts a bearish longer-term trend might be a false signal to avoid.
Features and Benefits
-
Simultaneous Analysis: Multi-timeframe analysis involves looking at least at two, often three, different timeframes at the same time. A typical combination includes daily, weekly, and monthly charts.
-
Hierarchical Timeframes: Longer timeframes (weekly, monthly) usually indicate the main trend direction, while shorter timeframes (daily, hourly) are used to pinpoint entry and exit points.
-
Indicator Flexibility: Traders can use different indicators specific to each timeframe, maximizing the effectiveness of their analysis. A longer timeframe might use a Moving Average, while a shorter timeframe uses a Relative Strength Index (RSI).
-
Trend Strength Assessment: Comparing trend strength across timeframes adds an extra layer of confirmation. A strong uptrend across all timeframes gives more confidence than a weak uptrend on a daily chart contradicted by a weekly downtrend.
Pros
-
Reduced Noise: Filtering signals through multiple timeframes significantly reduces false signals compared to using just one timeframe.
-
Enhanced Context: Understanding the bigger picture from longer timeframes leads to better trading decisions.
-
Improved Timing: Identifying entries and exits based on shorter timeframe confirmations within the larger trend can maximize profits.
-
Adaptability: Multi-timeframe analysis helps traders adjust to changing market conditions by adapting strategies based on evolving trends.
Cons
-
Complexity: Using multiple timeframes can be more complex and time-consuming than single-timeframe analysis.
-
Analysis Paralysis: Conflicting signals between timeframes can sometimes cause indecision.
-
Timeframe Relationships: Finding the right relationship between timeframes (like the 4x rule) requires careful planning and backtesting.
-
Delayed Entries: Waiting for alignment across timeframes can sometimes delay entries and cause traders to miss part of a move.
Examples and Evolution
The idea of multi-timeframe analysis has been around for a long time, going back to Charles Dow's trend theories. He stressed confirming trends across different periods. More recently, traders like Linda Raschke, known for her “3X” strategy, and Alexander Elder, with his “Triple Screen” trading system, have refined these concepts. John Murphy's method of using weekly charts for trend direction and daily charts for entry timing is another example. Currency traders often use monthly trends to filter daily trade setups, showing how this works in different markets.
Practical Tips for Implementation
-
The 4x Rule: A good guideline is to use timeframes at least four times apart (hourly, daily, weekly). This provides enough separation to capture different market rhythms.
-
Prioritize Higher Timeframes: If there are conflicting signals, prioritize the higher timeframe.
-
Tailor Indicators: Use indicators suited to each timeframe. Longer timeframes might use slower moving averages, while shorter ones could use more responsive oscillators.
-
Start Simple: Begin with basic trend identification methods like trendlines and moving averages on multiple timeframes before adding more complex indicators.
By understanding Multi-Timeframe Trend Following, traders can improve their ability to identify and profit from market trends. This approach offers a valuable advantage in navigating the financial markets, making it an important strategy for any serious trend follower.
7. Systematic Channel Breakout Strategy
The Systematic Channel Breakout Strategy is a key trend following methodology. It offers a rules-based approach to capturing profits from emerging trends. Instead of relying on subjective interpretations like discretionary methods, this strategy uses predefined rules for every part of the trade. This includes everything from identifying price channels to managing risk. This systematic approach aims to identify and exploit breakouts, deploying capital when price action shows commitment to a new direction.
This strategy's core strength lies in its precise framework. It utilizes clearly defined rules for building price channels, often using moving averages, Donchian channels, or Keltner channels. Donchian channels can be a valuable tool for traders. Breakout confirmation is also systematic, requiring the price to close outside the channel boundaries. This may be combined with increased volume or other confirming indicators.
Importantly, the strategy incorporates rules-based position sizing and risk management. It often sticks to a fixed percentage of capital risked per trade, such as 1-2%, to protect against large drawdowns. Many systematic breakout strategies also include trend filters, like moving average crossovers or ADX (Average Directional Index) readings. These help reduce false signals from sideways markets.
Benefits of a Systematic Approach
The benefits of this systematic approach are many. By following pre-defined rules, it removes emotional bias from trading decisions, promoting disciplined execution. The quantifiable nature of the strategy allows for thorough backtesting to check its performance and optimize parameters. You might be interested in: Our guide on how to backtest a trading strategy to understand the importance of this process.
The strategy can be automated for consistent execution. This frees up the trader's time and ensures adherence to the rules. Systematic trading also gives clear metrics for performance evaluation, allowing for continuous improvement and adaptation.
Historical Context and Notable Examples
The Systematic Channel Breakout Strategy’s rise is often linked to trading legends like Richard Dennis and the famous Turtle Trading experiment. This experiment trained novice traders to follow simple breakout rules. It showed that systematic trading could be learned and used profitably. Other prominent figures like Bill Dunn of Dunn Capital Management and Ed Seykota, a pioneer of computerized trading systems, further established the strategy’s place in trend following. Examples like Salem Abraham’s systematic breakout approach in managed futures also demonstrate the strategy's wide range of applications.
Drawbacks and Challenges
However, this strategy isn't perfect. It needs a lot of historical data for proper testing and optimization. Performance can suffer in long sideways markets where false breakouts are common. Parameter optimization can lead to overfitting to past data, resulting in poor future performance. The strategy also can't adapt to changing market conditions without reoptimization, requiring constant monitoring and adjustment.
Practical Tips for Implementation
For those implementing a Systematic Channel Breakout Strategy, several practical tips can boost performance. Using volatility filters can help reduce false breakouts. Testing system performance in different market situations helps ensure robustness. Using robust position sizing, often limiting risk to 1-2% per trade, is crucial for long-term success. Finally, consider time-based exits for trades that don't hit profit targets. This can help reduce losses during periods of market indecision.
Conclusion
The Systematic Channel Breakout Strategy provides a robust, testable, and potentially profitable framework for capturing market trends. Its systematic nature removes emotional bias and allows for automation, making it a good tool for both new and experienced traders. While challenges exist, understanding and addressing these limitations can lead to consistent and profitable trend following.
8. Adaptive Trend Following

Adaptive Trend Following represents the latest iteration of trend-following strategies. Its inclusion on this list stems from its ability to address a key weakness of traditional trend following: fixed parameters. Markets are dynamic, constantly fluctuating between trending and ranging periods, high and low volatility. A system optimized for one specific market regime may underperform in another. Adaptive systems strive to overcome this challenge by dynamically adjusting to prevailing market conditions.
Instead of using static lookback periods, breakout thresholds, and stop-loss distances, adaptive trend following uses algorithms that automatically modify these parameters based on real-time market analysis. This dynamic optimization is driven by statistical measures that identify the current market regime.
For instance, volatility clustering can be used to inform position sizing. A regime-switching model might dictate which trend-following indicator (e.g., short-term versus long-term moving average) is currently more effective.
Features and Benefits
-
Dynamic Parameter Adjustment: The core strength of adaptive systems lies in their ability to adjust parameters such as lookback periods, entry/exit thresholds, and position sizing based on current market dynamics.
-
Market Regime Identification: Using statistical measures, these systems can identify whether the market is trending or ranging, volatile or calm, enabling the strategy to adapt accordingly.
-
Volatility Normalization: Many adaptive strategies use volatility normalization to adjust position sizes based on market volatility, aiming for consistent risk exposure.
-
Potential for Machine Learning Integration: More sophisticated adaptive systems can incorporate machine learning algorithms for pattern recognition and predictive modeling, further improving their adaptability.
Real-World Examples
Some of the most successful quantitative hedge funds employ adaptive trend following. Renaissance Technologies' Medallion Fund, known for its exceptional returns, is thought to incorporate adaptive trend-following components. Similarly, Two Sigma's Compass fund and AHL's Evolution fund utilize adaptive strategies and machine learning for trend identification. These examples demonstrate the potential of this approach in real-world trading scenarios.
Pros
-
Enhanced Performance Across Market Regimes: By adapting to changing conditions, these systems aim to deliver more consistent returns compared to fixed-parameter strategies.
-
Mitigation of Curve-Fitting: Dynamic adaptation reduces the risk of overfitting to historical data, bolstering the strategy's robustness.
-
Drawdown Reduction: Adaptive systems can adjust risk exposure during unfavorable market periods, potentially minimizing drawdowns.
-
Robust Long-Term Performance: Adaptability offers the potential for more stable and consistent long-term returns.
Cons
-
Complexity: Developing and implementing adaptive systems is significantly more complex than traditional trend following, demanding advanced programming and statistical expertise.
-
Difficulty in Analysis: Diagnosing performance issues can be challenging due to the system's dynamic nature.
-
Over-Optimization Risk: Incorporating too many adaptive components can lead to over-optimization and poor out-of-sample performance.
Practical Tips for Implementation
-
Start Simple: Begin with a single adaptive component, such as volatility-adjusted position sizing, before adding more complex adaptations.
-
Rigorous Testing: Thoroughly backtest your regime detection algorithms and parameter adjustments on out-of-sample data to avoid overfitting.
-
Monitor for Instability: Continuously monitor the system for parameter instability, a potential indicator of over-optimization.
-
Consider Ensemble Approaches: Combining multiple adaptive models in an ensemble approach can improve robustness and reduce reliance on any single model.
Evolution and Popularization
The concept of adaptive trend following gained prominence through the work of pioneers like Perry Kaufman, known for his Adaptive Moving Average system. David Harding of Winton Capital Management and Howard Bandy's research on adaptive trading systems also contributed significantly to its development and growing popularity.
Adaptive trend following isn’t a simple "set and forget" strategy. It requires ongoing monitoring, analysis, and refinement. However, for those willing to dedicate the necessary time and effort, the potential rewards – consistent, robust performance across various market conditions – can be substantial.
8 Trend Following Strategies: Head-to-Head Comparison
| Strategy | 🔄 Complexity | ⚡ Resources | 📊 Outcomes | 💡 Use Cases | ⭐ Advantages |
|---|---|---|---|---|---|
| Moving Average Crossover | Low – Simple, rule‐based design | Low – Minimal data and calculations | Captures medium/long-term trends; may lag signals | Broad markets; ideal for trend following | Easy to implement; reduces emotional bias |
| Breakout Trading | Low-Medium – Clear rules but requires vigilance | Medium – Needs real-time monitoring | Identifies major moves; risk of false breakouts | Suitable for volatile markets with strong directional moves | Provides clear entry/exit signals; straightforward concept |
| Donchian Channel Strategy | Medium – Uses fixed lookback channels | Low-Medium – Simple high/low calculations | Objective trend capture with set entry/exit criteria | Best in markets with defined highs/lows and breakouts | Built-in risk management; straightforward criteria |
| Momentum-Based Trend Following | Medium-High – Requires momentum indicators and ranking | Medium-High – Data intensive with regular rebalancing | Early trend detection with strong performance during crises | Ideal for diversified, multi-asset portfolios | Identifies trends early; robust performance historically |
| Volatility Breakout Systems | High – Adapts rules based on volatility measures | Medium-High – Involves dynamic volatility calculations | Provides adaptive entries; reduces false signals in quiet periods | Best for markets with varying volatility levels | Adaptive risk management; objective signal generation |
| Multi-Timeframe Trend Following | High – Integrates signals from multiple timeframes | Medium-High – Requires broader, layered data | Enhances signal confirmation and timing; reduces false signals | Suited for traders needing robust trend confirmation | Increased context; precision in timing |
| Systematic Channel Breakout | High – Rules-based system needing parameter optimization | High – Extensive historical data and backtesting | Consistent performance with clear, testable metrics | Ideal for automated trading in trending markets | Removes emotion; systematic and backtestable approach |
| Adaptive Trend Following | Very High – Dynamic, algorithmic complexity | High – Advanced algorithms and extensive data use | Robust performance across shifting market regimes; minimizes drawdowns | Best for sophisticated, quantitative trading environments | Highly adaptable; maintains performance in diverse settings |
Mastering Trend Following in 2025 and Beyond
Trend following remains a potent strategy in the financial markets. The core principles, identifying and profiting from established trends, still apply whether you're using classic moving average crossovers or more complex, adaptive strategies. Throughout this article, we’ve explored eight different trend following methods:
- Moving Average Crossover
- Breakout Trading
- Donchian Channel Strategy
- Momentum-Based Trend Following
- Volatility Breakout Systems
- Multi-Timeframe Trend Following
- Systematic Channel Breakout Strategy
- Adaptive Trend Following
Each method offers a unique approach to identifying, entering, and managing trades based on the current market direction.
Successfully implementing these concepts requires more than simply understanding the mechanics. It requires carefully evaluating your personal risk tolerance, your trading style, and the specific nature of the markets you trade. Effective risk management is critical. Always use proper position sizing and stop-loss orders to protect your capital. Backtesting your chosen strategy against historical data is also essential to understanding its potential performance and drawbacks.
Adapting to the Changing Market
The financial landscape is in constant flux. Algorithmic trading, increased market volatility, and the rise of new asset classes all impact how trends develop and behave. Continuous learning and adaptation are key to maintaining an advantage. Stay up-to-date on market developments, explore new indicators, and refine your strategies based on performance analysis. The future of trend following likely involves incorporating advanced technologies like machine learning and artificial intelligence (AI) to identify and capitalize on subtle changes in market dynamics.
Key Takeaways
- Trend following strategies provide a solid framework for capturing market movements.
- Risk management and backtesting are vital for long-term success.
- Continuous learning and adaptation are crucial in today's dynamic markets.
- Integrating technology can improve the efficacy of trend following strategies.
Elevate Your Trading with ChartsWatcher
Ready to enhance your trend following approach? ChartsWatcher offers a powerful platform built for professional traders. From customizable dashboards and real-time alerts to robust backtesting features, ChartsWatcher gives you the resources needed to pinpoint, analyze, and profit from market trends with accuracy. Gain a competitive edge with our dynamic multi-screen configurations, advanced filtering, and in-depth data analysis. Visit ChartsWatcher today to learn more and explore our flexible pricing plans.
