8 Effective Price Action Trading Strategies for 2025
Unlocking Market Secrets with Price Action
This listicle delivers eight powerful price action trading strategies to sharpen your trading skills. Learn how to interpret raw price data for informed decisions using techniques like support/resistance, candlestick patterns, inside bars, pin bars, breakouts, swing highs/lows, multiple time frame analysis, and order block trading. Mastering these price action trading strategies is essential for navigating market conditions and improving your trading performance. Let's unlock the potential of price action.
1. Price Action Support and Resistance Trading
Price action support and resistance trading is a cornerstone of technical analysis and arguably the most widely utilized of all price action trading strategies. This method focuses on identifying key horizontal price levels where the market has historically reversed or paused, indicating a shift in the balance between supply and demand. These zones act as barriers, with support representing a price level where buying interest tends to outweigh selling pressure, preventing further price declines. Conversely, resistance represents a level where selling pressure dominates buying interest, hindering further price advances. Traders leverage these established support and resistance zones to anticipate potential price reversals or breakouts and make informed trading decisions. They look for bounces off support levels to enter long positions or rejections from resistance levels to initiate short positions. This strategy relies solely on interpreting the raw price data displayed on a chart, making it a pure form of price action analysis.

This strategy’s effectiveness stems from the self-fulfilling nature of support and resistance. As more traders observe and trade these levels, their significance increases. Swing highs and lows of prior price action are typically used to define these crucial zones. A swing high is a candlestick with at least one lower high on both the left and right, indicating a peak in price. A swing low is a candlestick with at least one higher low on both the left and right, representing a trough in price. Connecting these swing highs and lows forms the basis of horizontal support and resistance lines.
A key aspect of support and resistance trading is multi-timeframe analysis. Examining price action across different timeframes, such as daily, hourly, and 15-minute charts, helps to identify stronger and more reliable support and resistance levels. For instance, a support level that holds on the daily, weekly, and monthly charts signifies a much more significant area of buying interest compared to a level only visible on a 15-minute chart.
Traders frequently enhance the accuracy of support and resistance trading by combining it with candlestick patterns. Specific candlestick formations, like bullish hammers or bearish engulfing patterns, appearing at support or resistance levels, can provide further confirmation of potential reversals, increasing the probability of successful trades.
Examples of Successful Implementation: Bitcoin repeatedly tested the $20,000 level as major support throughout 2022, attracting buyers and triggering price rebounds. Similarly, the S&P 500 has encountered resistance at psychological round numbers like 4,000 and 5,000, leading to price pullbacks. In the forex market, the EUR/USD pair might repeatedly bounce off a support level like 1.0500. Finally, assets like gold often encounter resistance at previous all-time high levels, presenting selling opportunities.
Pros:
- Simplicity and Universal Application: Easily understood and applicable to any market (stocks, forex, cryptocurrencies, commodities).
- Multi-Timeframe Compatibility: Works on any timeframe, from 1-minute intraday charts to monthly long-term charts.
- Clear Entry and Exit Points: Provides well-defined entry and exit points, facilitating risk management with precise stop-loss orders.
- Reliance on Raw Price Data: No lagging indicators needed; solely based on current and historical price data.
- Self-Validating: The more traders recognize and act on a level, the stronger it becomes.
Cons:
- Zone Not Price: Support and resistance are zones, not exact price points, which can lead to some ambiguity.
- False Breakouts: Susceptible to false breakouts and whipsaws, triggering premature entries or exits.
- Level Significance: Determining the most significant levels can be challenging, requiring experience and practice.
- Trending Markets: Can be less effective in strongly trending markets where price may persistently break through levels.
Actionable Tips:
- Prioritize major levels tested multiple times, as more touches increase significance.
- Use wider stops around support/resistance zones to account for price fluctuations.
- Incorporate volume analysis to confirm the strength of support and resistance.
- Recognize that round numbers often act as psychological support/resistance.
This strategy’s universal application, clear entry/exit signals, and reliance on readily available price data make it a foundational tool for professional traders, stock market analysts, financial institutions, independent investors, and educators alike. By mastering the principles of support and resistance trading, market participants can enhance their ability to anticipate price movements, manage risk, and ultimately improve their trading performance within the framework of price action trading strategies.
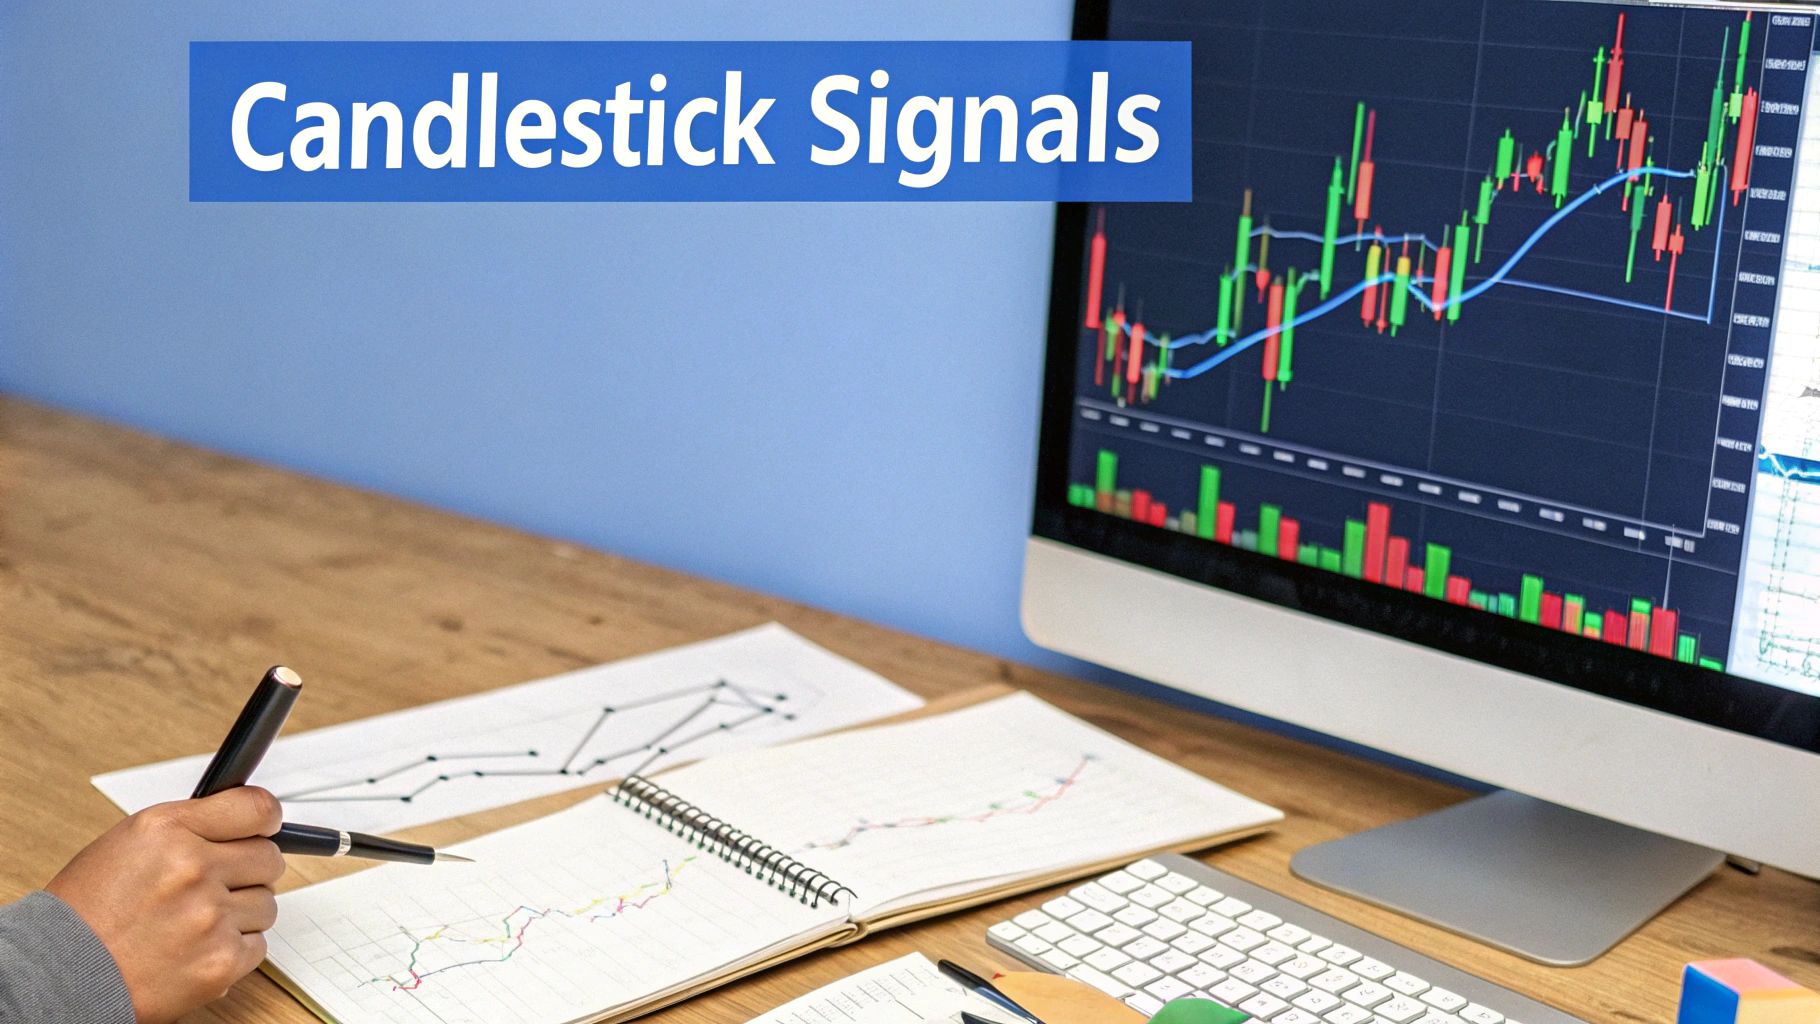
2. Candlestick Pattern Trading
Candlestick pattern trading is a powerful price action trading strategy that allows traders to interpret the ongoing battle between buyers and sellers in the market. It focuses on identifying specific formations of Japanese candlesticks to predict potential price reversals or continuations. These patterns, ranging from single to multi-candle formations, provide visual cues about market sentiment and offer valuable insights into potential future price movements. Traders leverage these visual signals to time their entries and exits, essentially reading the story each candlestick formation tells about prevailing market behavior. This method deserves its place on the list of effective price action strategies because of its visual clarity, applicability across markets and timeframes, and its potential to provide insights into market psychology.
Each candlestick represents a specific time period, displaying the open, high, low, and close prices. For example, a bullish candlestick (typically green or white) shows that the closing price was higher than the opening price, suggesting buying pressure. Conversely, a bearish candlestick (usually red or black) indicates the close was lower than the open, reflecting selling pressure. Specific combinations of these candles create patterns like engulfing patterns, hammers, shooting stars (reversal patterns), and harami or doji (continuation patterns). These patterns can be used in conjunction with other price action trading strategies and technical indicators, such as support and resistance levels, to confirm potential trading setups. Learn more about Candlestick Pattern Trading for a deeper dive into some key reversal patterns.
Successful implementation of candlestick pattern trading can be observed across various markets. The evening star pattern often precedes major corrections in Bitcoin, providing early warning signs for traders. Conversely, a bullish engulfing pattern at the bottom of the March 2020 market crash signaled a potential recovery, offering a lucrative entry point for astute traders. Similarly, hammer candlesticks forming at support levels often precede rallies in stock indices, while doji candlesticks at market tops can indicate indecision and a potential reversal.
Pros of Candlestick Pattern Trading:
- Clear Visual Signals: Easily recognizable with practice.
- Versatility: Works across all markets and timeframes.
- Dual Functionality: Useful for both entry and exit decisions.
- Market Psychology Insight: Offers a glimpse into sentiment shifts.
- Historical Reliability: Established patterns with proven track records.
Cons of Candlestick Pattern Trading:
- Subjectivity: Interpretation can lead to confirmation bias.
- Context Dependence: Lower reliability when used in isolation.
- Confirmation Needed: Some patterns require validation from subsequent price action.
- Choppy Market Issues: Can generate excessive signals in volatile markets.
- Variable Effectiveness: Pattern performance differs across market conditions.
Tips for Effective Candlestick Pattern Trading:
- Consider Market Context: Analyze patterns within the broader market environment.
- Focus on Key Levels: Look for patterns at support/resistance for high-probability setups.
- Confirm with Price Action: Validate patterns with subsequent price movements before entering.
- Master a Few Patterns: Concentrate on a select group of reliable patterns.
- Use Larger Timeframes: Longer timeframes generate more dependable signals.
Pioneered by Steve Nison, who introduced these techniques to Western markets, and further developed by analysts like Thomas Bulkowski and John Murphy, candlestick pattern trading remains a valuable tool for professional traders, stock market analysts, financial institutions, independent investors, and trading educators alike. By understanding the nuances of these patterns and combining them with sound risk management principles, traders can significantly enhance their price action trading strategies.
3. Inside Bar Trading Strategy
The Inside Bar trading strategy is a popular price action technique focusing on volatility compression and expansion. It's a powerful tool for identifying potential breakouts and deserves its place in any price action trader's arsenal due to its clear setup, defined risk parameters, and applicability across various markets and timeframes. This strategy hinges on identifying a specific candlestick pattern: the "inside bar." This pattern occurs when a price bar's high and low are entirely contained within the high and low of the preceding bar (the "mother bar"). This inside bar represents a period of consolidated price action, often suggesting a lull before a significant move. Traders utilizing this strategy are essentially anticipating the release of pent-up energy, resulting in a strong directional breakout.
How It Works:
The Inside Bar strategy leverages the concept of market equilibrium. The mother bar represents an initial price move, followed by the inside bar demonstrating a period of indecision or equilibrium where neither bulls nor bears can establish control. This consolidation sets the stage for a potential breakout. Traders typically place entry orders above the mother bar's high (for a bullish breakout) and below the mother bar's low (for a bearish breakout). Stop-loss orders are placed on the opposite side of the inside bar, creating a clearly defined risk profile. When price breaks decisively through either the mother bar's high or low, it signals a potential resurgence of volatility and the start of a new directional move.
Examples of Successful Implementation:
- S&P 500: Imagine the S&P 500 approaching a key resistance level. An inside bar forms on the daily chart, suggesting indecision. A breakout above the mother bar's high signals a potential continuation of the uptrend and a new leg higher.
- Cryptocurrency Markets: During periods of consolidation in Bitcoin, multiple inside bars might form on the hourly chart. A strong breakout from this pattern could indicate the start of a new bullish or bearish trend.
- Forex Pairs: An inside bar forming at the extreme of a trend in a forex pair like EUR/USD could suggest a potential reversal opportunity. A break below the mother bar's low in a downtrend could signal further downside momentum.
- Commodities Markets: A daily inside bar forming in Gold before a major news announcement could foreshadow a news-driven breakout.
Actionable Tips for Using the Inside Bar Strategy:
- Prioritize Strong Moves: Focus on inside bars that form after a strong directional move, as these tend to have a higher probability of leading to a successful breakout.
- Higher Timeframes: Daily and weekly inside bars often provide more reliable signals than those on lower timeframes.
- Precise Entry and Stop-Loss: Use the mother bar's high and low as entry triggers and stop-loss placements. This provides a well-defined risk-reward ratio.
- Trend Analysis: Combine the inside bar strategy with trend analysis. Trade breakouts that align with the direction of the larger trend.
- Volume Confirmation: Look for decreasing volume during the inside bar formation and a surge in volume on the breakout. This adds further confirmation to the signal.
Pros:
- Clearly Defined Risk: Precise entry and stop-loss levels allow for effective risk management.
- Versatile Applicability: Works across all market environments and timeframes.
- High-Probability Setups: Can identify high-probability breakout opportunities.
- Strong Risk-to-Reward Potential: Offers the potential for significant profits relative to risk.
- Easy Identification: Simple visual pattern with minimal subjective interpretation.
Cons:
- False Breakouts: Ranging markets can produce false breakouts, leading to losses.
- Whipsaw Trading: Multiple inside bars can create whipsaw price action and confuse traders.
- Context Matters: Effectiveness varies based on market conditions and placement within the broader market structure.
- Overabundance of Signals: Can generate too many signals in certain market conditions, requiring careful filtering.
- Patience Required: Requires patience to wait for confirmed breakouts.
Popularized By:
Traders like Nial Fuller have extensively written about and popularized the inside bar trading strategy. Al Brooks incorporates inside bars within his broader price action trading methodology. Mark Douglas has explored the psychological aspects of trading compressed volatility patterns like inside bars.
This strategy, while powerful, is not a standalone holy grail. It works best when integrated into a comprehensive trading plan that includes sound risk management principles and a broader understanding of market context. When used correctly, the Inside Bar strategy can be a valuable addition to any price action trader's toolkit.
4. Pin Bar (Pinocchio Bar) Strategy
The Pin Bar (also known as the Pinocchio Bar) strategy is a popular price action trading strategy that centers around identifying a specific candlestick pattern resembling Pinocchio's nose. This pattern, characterized by a long wick (or shadow) juxtaposed against a small body, represents a decisive rejection of price at a particular level. This rejection signals a potential reversal in price direction, making it a valuable tool for traders looking to capitalize on shifts in market sentiment. Its clear visual signal and defined entry and exit points make it a favored technique among those utilizing price action trading strategies.
How it Works:
The Pin Bar forms when the market attempts to move in one direction but is forcefully rejected, ultimately closing near the opposite end of its range. The long wick acts as a visual representation of this rejection, showing where buyers or sellers stepped in and pushed the price back. The small body highlights the lack of follow-through in the initial price move, emphasizing the shift in control.
Features and Benefits:
- Clear Visual Signal: The elongated wick immediately draws attention to a potential reversal point, providing traders with a visually distinct signal.
- Precise Entry and Stop-Loss Placement: The pin bar's structure allows for well-defined entry points (near the close of the pin bar or on a break of its high/low) and stop-loss orders (just beyond the tip of the wick). This precision is crucial for effective risk management.
- Predictive Value: Pin bars often precede significant price moves, providing traders with an early opportunity to capitalize on emerging trends within their price action trading strategies.
- Versatility: This strategy works across all markets (stocks, forex, commodities, etc.) and timeframes (from short-term intraday charts to long-term weekly or monthly charts), offering flexibility for different trading styles.
- Captures Market Psychology: The pin bar captures a clear shift in market sentiment within a single period, offering insight into the underlying dynamics of supply and demand.
Pros and Cons:
Pros:
- Clear visual signal of rejection and potential reversal.
- Provides precise entry and stop-loss placement.
- Often precedes significant price moves.
- Effective across all markets and timeframes.
- Captures market psychology in a single bar.
Cons:
- Can generate false signals in choppy or ranging markets.
- Requires confirmation from subsequent price action.
- Subjective interpretation of what constitutes a valid pin bar (wick length relative to body).
- Less effective in low-volatility environments.
- Can lead to premature entries against strong trends.
Examples of Successful Implementation:
- Bullish pin bars forming at major support levels preceded the 2020 stock market recovery.
- Bearish pin bars appearing at Bitcoin resistance levels often signaled corrections.
- Pin bars at Fibonacci retracement levels in forex markets have provided high-probability trading setups.
- Weekly pin bars at market extremes have signaled major reversals in commodity markets.
Actionable Tips:
- Trade pin bars that align with the overall trend for higher probability setups.
- Focus on pins that form at key market levels, such as support/resistance, round numbers, or trendlines.
- Enter on the close of the pin bar or on a break of the pin bar's high/low, depending on your risk tolerance.
- Place stops beyond the "nose" (wick) of the pin bar to minimize potential losses.
- Look for increased volume on the pin bar for added confirmation of the reversal signal.
Popularized By:
Notable figures like Martin Pring, Nial Fuller, and Lance Beggs have played a significant role in popularizing the pin bar strategy within the broader context of price action trading. Their teachings have helped traders understand and apply this powerful pattern effectively.
Why it Deserves its Place in the List:
The Pin Bar strategy offers a clear, concise, and actionable way to identify potential reversals in price. Its visual appeal, combined with the precise entry and stop-loss levels it provides, makes it a valuable tool for traders of all experience levels looking to implement effective price action trading strategies. By understanding the nuances of the pin bar, traders can enhance their ability to read the market and make informed trading decisions.
5. Breakout Trading
Breakout trading is a powerful price action trading strategy that focuses on identifying and capitalizing on significant price movements that occur when an asset's price breaks out of an established range, trend line, or chart pattern. This approach operates on the principle that consolidated price action, often represented by periods of sideways movement or predictable trends, builds potential energy. When this energy is finally released, it often results in a rapid and substantial price move in the breakout direction. Traders using this strategy look for the price to move beyond these established boundaries with increased momentum and volume, signaling a potential shift in market sentiment and the start of a new trend. This makes it a popular choice among professional traders, stock market analysts, financial institutions, and independent investors alike.

Breakout trading can be applied across a variety of instruments and timeframes, from day trading to long-term investing. It's effective in both trending and ranging markets, adding to its versatility as a price action trading strategy. The strategy often works well with recognizable chart patterns such as triangles, rectangles, flags, and pennants. For instance, within the CANSLIM method, cup-and-handle patterns are a key breakout signal. These patterns act as visual representations of consolidating price action before a potential breakout.
Examples of successful breakout trading include Bitcoin breaking above its previous all-time highs in 2020, leading to massive uptrends. Another example is the S&P 500 breaking out of the coronavirus pandemic trading ranges in April 2020. Currency markets also exhibit breakout behavior, like when the EUR/USD breaks long-term descending trend lines, often preceding major trend shifts. Finally, many technology stocks have shown substantial rallies after breaking out of cup-and-handle patterns. Learn more about Breakout Trading
Pros:
- Captures powerful momentum moves: Breakout trading allows traders to enter positions at the very beginning of potentially large price swings, maximizing profit potential.
- Clear entry and exit parameters: The breakout level provides a clear entry point, while the opposite side of the previous consolidation zone can serve as an initial stop-loss level. This contributes to well-defined risk management.
- High potential risk-to-reward ratios: Successful breakouts can offer significant returns relative to the initial risk taken.
- Objective entry criteria: The method offers objective entry criteria based on observable price levels, minimizing subjective interpretation.
Cons:
- False breakouts (Whipsaws): Not all breakouts lead to sustained trends. False breakouts, or whipsaws, can result in losses if not managed carefully.
- Chasing price: Delayed entries can lead to chasing price and entering at unfavorable levels.
- Volatility: Post-breakout price action can be volatile, requiring active risk management.
- Profit target determination: Determining appropriate profit targets can be challenging.
Tips for Effective Breakout Trading:
- Confirmation is key: Wait for a confirmed close beyond the breakout level, rather than just a wick, to reduce the risk of false breakouts. Stock scanners and stock screeners can help automate this process.
- Volume matters: Increased volume on the breakout confirms its legitimacy and suggests stronger conviction behind the move.
- Beware of traps: Be cautious of breakouts at commonly watched levels, as these can be areas where stop hunts occur, designed to trigger stop-loss orders before a genuine breakout.
- Retest entry: Consider waiting for a retest of the broken level as a more conservative entry point, offering better risk-to-reward ratios.
- Measure potential: Use the width of the preceding consolidation or chart pattern to estimate the potential magnitude of the breakout move. This helps determine reasonable profit targets.
Pioneered by traders like Jesse Livermore in the early 20th century and further developed by figures like William O'Neil (CANSLIM) and Alexander Elder, breakout trading remains a relevant and potent strategy in modern markets. Its focus on capturing significant price movements makes it a valuable tool for price action traders aiming to capitalize on powerful market trends.
6. Swing High/Low Trend Trading
Swing High/Low Trend Trading is a powerful price action trading strategy that deserves a prominent place in any trader's toolkit. It focuses on identifying the underlying directional bias of the market by observing the sequence of swing highs and swing lows. This core principle allows traders to align their trades with the prevailing market momentum, arguably the path of least resistance, making it a popular choice among professional traders, stock market analysts, and independent investors alike. This strategy works across various asset classes, from stocks and forex to commodities and cryptocurrencies, and can be applied on multiple timeframes, making it suitable for both short-term day traders and longer-term swing traders.
At its heart, Swing High/Low Trend Trading relies on the observation that in an uptrend, prices create a series of higher highs (HH) and higher lows (HL). Conversely, in a downtrend, prices form lower lows (LL) and lower highs (LH). By tracking these swing points, traders can not only determine the current trend direction but also anticipate potential reversal points and identify optimal entry locations. This approach forms the bedrock of trend following methodologies and provides a robust framework for participating in trending markets.
How it Works:
The strategy involves systematically identifying swing points on a price chart. A swing high is a candlestick pattern where the price reaches a peak and is preceded and followed by lower highs. A swing low is a candlestick pattern where the price reaches a trough and is preceded and followed by higher lows. Connecting these swing points with trend lines offers a clear visual representation of the prevailing trend. Traders then look for opportunities to enter the market in the direction of the established trend, ideally on pullbacks towards previous swing highs or lows.
Examples:
- S&P 500 (2009-2020): The bull market during this period showcased a textbook example of higher highs and higher lows, offering numerous opportunities for swing traders to profit from the upward momentum.
- Bitcoin (2022): The bear market phase of 2022 was characterized by a consistent pattern of lower highs and lower lows, signaling a strong downtrend.
- Crude Oil: Observing shifts in crude oil's swing point structure often reveals major market reversals, allowing traders to anticipate significant price movements.
- EUR/USD: Swing point analysis on the EUR/USD pair can uncover multi-year trend changes, providing crucial insights for long-term currency traders.
Actionable Tips:
- Confirmation is Key: Wait for at least two sets of swing point confirmations (two higher highs and two higher lows for an uptrend, and vice versa for a downtrend) before determining the trend direction.
- Multi-Timeframe Analysis: Use multiple timeframes to ensure trend alignment. A bullish signal on a daily chart should ideally be supported by a bullish trend on a weekly chart.
- Pullback Entries: Enter on pullbacks to previous swing points within the established trend. This minimizes risk and maximizes profit potential.
- Stop-Loss Placement: Place stop-loss orders below swing lows in uptrends and above swing highs in downtrends to protect capital in case of a trend reversal.
- Trend Exhaustion: Be vigilant for changes in swing point patterns, such as double tops or double bottoms, which can signal trend exhaustion and potential reversals.
Pros:
- Alignment with Market Momentum: Trades are aligned with the prevailing trend, increasing the probability of success.
- Objective Trend Identification: Offers objective criteria for determining trend direction.
- Versatility: Works across all timeframes and markets.
- Clear Trade Management: Swing points provide clear guidelines for entries, stop-losses, and take-profit targets.
- Avoids Countertrend Trading: Helps traders avoid the pitfalls of trading against the trend.
Cons:
- Real-Time Identification Challenges: Identifying swing points in real-time can be challenging, especially in volatile markets.
- Sudden Reversals: Trends can reverse without warning, leading to losses if not managed properly.
- Late Entries: Waiting for confirmed swing points can sometimes result in late entries, potentially missing a portion of the move.
- Patience Required: The strategy requires patience to wait for proper setup conditions.
- Fewer Signals: May generate fewer trading signals compared to other strategies.
Swing High/Low Trend Trading, popularized by trading legends like Richard Wyckoff, Richard Dennis, Robert Prechter, and Charles Dow, is a time-tested method that empowers traders to capitalize on market trends. By understanding and implementing the principles outlined above, traders can significantly enhance their ability to navigate the complexities of the financial markets and achieve consistent profitability.
7. Multiple Time Frame Analysis
Multiple Time Frame Analysis (MTFA) is a powerful price action trading strategy that provides a holistic view of the market by examining price movements across different timeframes. Instead of relying on a single timeframe, which can be misleading, MTFA synthesizes information from longer-term trends and shorter-term price fluctuations to identify high-probability trading opportunities. This approach allows traders to align their trades with the prevailing market direction while fine-tuning their entries and exits for optimal results. It is a crucial strategy for serious traders aiming to improve market understanding and enhance their decision-making process.
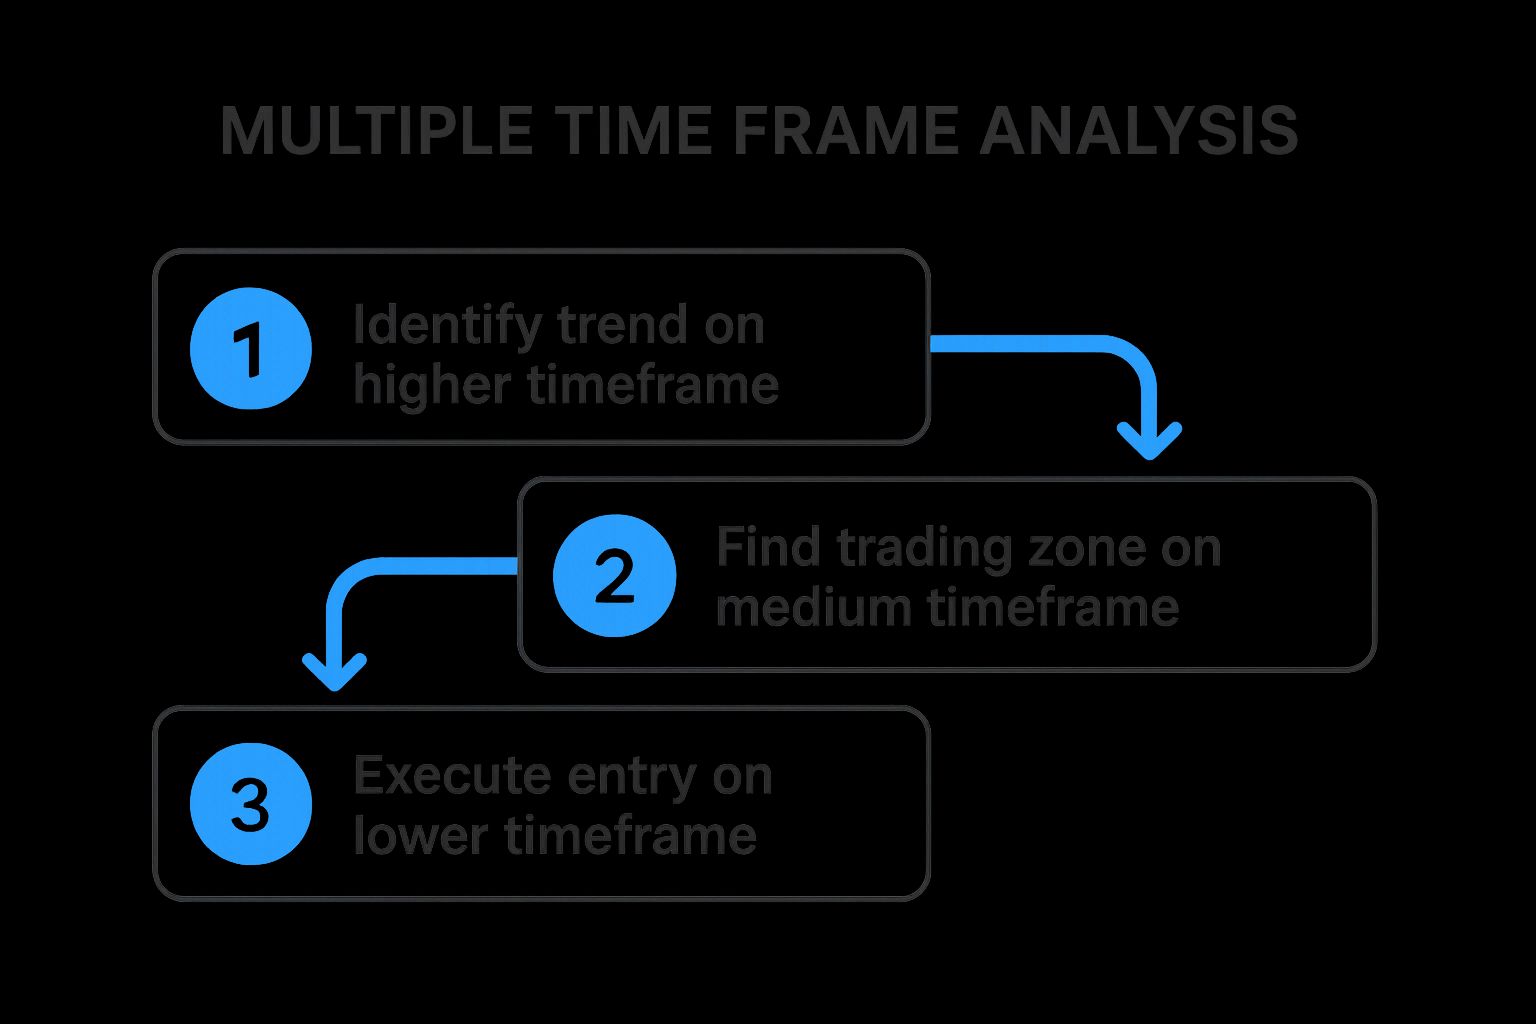
The infographic below illustrates the typical workflow of a Multiple Time Frame Analysis. This process begins with analyzing the higher timeframe to determine the overall trend. Then, a medium timeframe is used to identify potential trading zones based on market structure and support/resistance levels. Finally, a lower timeframe pinpoints precise entry and exit points, allowing for optimized trade execution.
As shown in the infographic, the sequential nature of MTFA, starting from broader market context and narrowing down to specific entry points, helps traders avoid impulsive decisions based on short-term market noise. By aligning trades with the larger trend, the probability of success significantly increases.
MTFA typically involves analyzing three timeframes simultaneously: a higher timeframe for trend identification, a medium timeframe for identifying potential setups and support/resistance zones, and a lower timeframe for precise entry and exit timing. For example, a swing trader might use the weekly chart to determine the overall trend of the S&P 500, the daily chart to identify potential swing trading setups and key support/resistance levels, and the hourly chart for precise entries and stop-loss placement. This layered approach provides a more comprehensive understanding of market dynamics than simply relying on a single timeframe.
Features of MTFA:
- Analysis of three or more timeframes simultaneously
- Top-down approach from higher to lower timeframes
- Alignment of trades with higher timeframe direction
- Use of lower timeframes for entry precision
- Integration of support/resistance across multiple time horizons
Pros:
- Provides comprehensive market context and reduces false signals
- Improves trade timing and entry precision
- Helps identify the highest probability trading opportunities
- Reduces emotional decision-making through structured analysis
- Effective in all market conditions and instruments
Cons:
- Can lead to analysis paralysis with too many timeframes
- Requires managing multiple charts simultaneously
- Time-consuming compared to single timeframe analysis
- Can create conflicting signals between timeframes
- Steeper learning curve for beginning traders
Tips for using MTFA:
- Typically use a 4:1 ratio between timeframes (e.g., daily, 4-hour, 1-hour)
- Always trade in the direction of the higher timeframe trend when possible
- Look for confluence between timeframes for strongest setups
- Start analysis from the highest timeframe and work downward
- Use no more than three timeframes to avoid confusion and overanalysis
MTFA has been popularized by renowned figures in technical analysis and trading psychology, including John Murphy, Mark Douglas, Brian Shannon, and Thomas DeMark. Their work highlights the importance of understanding market context and the power of combining multiple timeframes for improved trading results.
This video further elaborates on the practical application of MTFA.
Multiple Time Frame Analysis deserves its place on this list of price action trading strategies because it offers a structured and robust approach to understanding market dynamics and identifying high-probability trading setups. By incorporating multiple perspectives, traders can make more informed decisions, improve their timing, and ultimately enhance their overall trading performance. This is an invaluable tool for professional traders, stock market analysts, financial institutions, independent investors, and trading educators alike.
8. Order Block Trading: Unlocking Institutional Order Flow
Order Block Trading stands out among price action trading strategies because it offers a powerful lens into the often-hidden world of institutional activity. This advanced technique centers on identifying "order blocks," specific price ranges where large institutional orders have demonstrably impacted the market's direction. By understanding and anticipating these influential footprints, traders can potentially align themselves with significant money flow and capitalize on high-probability reversals. This makes it a highly valuable tool for professional traders, stock market analysts, financial institutions, and independent investors alike.
Essentially, an order block is a price area where substantial buying or selling pressure from institutions occurred before a strong directional move. It's often visually identifiable as the last candle against the prevailing trend – the final point of opposition – just before a significant breakout or breakdown. The underlying premise is that institutions, with their vast resources, will often defend these price levels where they've established substantial positions. Order Block Trading capitalizes on this potential by providing traders with precise entry points for trades when price revisits these key zones.
How it Works:
Order Block Trading involves several key steps:
- Identification: Pinpointing potential order blocks by looking for strong momentum candles and then identifying the last opposing candle (the order block) immediately preceding the surge.
- Validation: Focusing on order blocks that correspond with recent swing highs or lows, confirming their significance in shaping market structure.
- Entry: Waiting patiently for the price to revisit the order block zone. The entire range of the block is considered, not just a specific price level.
- Risk Management: Setting stop-losses just beyond the opposite extreme of the order block, defining clear risk parameters for each trade.
- Confirmation: Combining order block analysis with other confluence factors like Fibonacci retracement levels, support/resistance zones, or round numbers to increase the probability of a successful trade.
Examples of Successful Implementation:
- Identifying Bitcoin's major accumulation zones (order blocks) prior to significant bullish breakouts, allowing traders to enter early in the uptrend.
- Recognizing 'fair value' areas in stock index futures where large institutions rebalance their portfolios, providing opportunities to trade anticipated reversals.
- Capitalizing on currency pair reversals from significant order blocks following major economic announcements, exploiting the predictable institutional response to news events.
- Observing weekly order blocks in commodity markets that repeatedly influence price over extended periods, enabling long-term swing trading strategies.
Actionable Tips for Using Order Block Trading:
- Prioritize fresh (recently formed) order blocks as they tend to be more reliable indicators of current institutional activity.
- Focus on order blocks that align with higher timeframe analysis (e.g., daily or weekly charts) for increased significance.
- Use volume analysis in conjunction with order blocks to confirm the strength of institutional involvement.
- Be patient and disciplined, waiting for price to return to the order block zone rather than chasing entries.
Pros and Cons:
Pros:
- Targets high-probability reversal zones with historical significance.
- Provides precise entry points with defined risk parameters.
- Aligns trading with potential institutional activity.
- Offers potentially high risk-to-reward ratios.
- Works across various liquid markets and timeframes.
Cons:
- Identification can be subjective and requires experience.
- Differentiating order blocks from standard support/resistance can be challenging.
- Requires patience to wait for price to revisit the order block.
- Order blocks can lose validity over time as market conditions change.
- Represents an advanced concept that demands dedicated study and practice.
Popularized By:
Key figures in developing and popularizing order block concepts include ICT (Inner Circle Trader) with his emphasis on smart money principles, Sam Seiden and his supply and demand methodology, Michael Huddleston through his FVG (Fair Value Gap) analysis, and the foundational work of Richard Wyckoff on institutional price influence.
Order Block Trading, while demanding practice and refinement, offers traders a unique edge within the realm of price action trading strategies. By focusing on institutional order flow, this method equips traders with the potential to identify high-probability trades and achieve superior returns. It’s a powerful tool that deserves a place in any serious trader's arsenal.
Price Action Strategies Comparison Chart
| Strategy | Implementation Complexity 🔄 | Resource Requirements ⚡ | Expected Outcomes 📊 | Ideal Use Cases 💡 | Key Advantages ⭐ |
|---|---|---|---|---|---|
| Price Action Support and Resistance Trading | Moderate - requires practice to identify zones effectively | Low - uses raw price data, no indicators | Reliable entry/exit zones, defined risk management | Markets where clear price reversal zones exist, any timeframe | Simple application, universal across markets, self-validating |
| Candlestick Pattern Trading | Moderate - subjective interpretation needed | Low - visual pattern recognition | Visual signals of reversals/continuations | Identifying market sentiment shifts, timing entries/exits | Easy to recognize, works on all markets/timeframes, psychological insights |
| Inside Bar Trading Strategy | Moderate - clear patterns but needs patience | Low - chart pattern based | Precisely defined entries, high-risk/reward setups | Breakout opportunities after volatility compression | Clear entries/stops, works in all markets/timeframes, simple identification |
| Pin Bar (Pinocchio Bar) Strategy | Low to Moderate - clear visual but subjective validity | Low - single candlestick pattern focus | Early reversal signals, precise stops/entries | Spotting rejections at key levels, trend-aligned reversals | Clear signals, captures market psychology, effective across markets/timeframes |
| Breakout Trading | Moderate to High - requires momentum and volume confirmation | Medium - monitoring volume and price action | Captures strong momentum moves early, high R:R | Trending or range-bound markets, after consolidation phases | Objective entry criteria, powerful momentum capture, works in various markets |
| Swing High/Low Trend Trading | Moderate to High - requires identifying swing points in real-time | Low to Medium - chart analysis | Aligns with trend direction, avoids countertrend trades | Trend following in any market/timeframe | Objective trend criteria, works across all timeframes, clear trade guidelines |
| Multiple Time Frame Analysis | High - managing and aligning multiple timeframe charts | Medium to High - multiple charts/screens needed | Improved trade context and timing, reduces false signals | Complex market environments demanding precision | Comprehensive market view, high probability setups, reduces emotional trades |
| Order Block Trading | High - advanced, subjective identification of institutional zones | Medium - requires deep market knowledge | High-probability reversals aligning with institutional activity | Institutional trading alignment, liquid markets | Targets key institutional zones, precise entries, exceptional R:R potential |
Elevate Your Trading with ChartsWatcher
This article explored eight powerful price action trading strategies, ranging from classic support and resistance trading and candlestick pattern recognition to more advanced concepts like order block trading and multiple time frame analysis. Mastering these strategies empowers you to interpret raw market data, anticipate potential price movements, and make informed trading decisions based on objective observation rather than relying solely on indicators. Understanding swing highs and lows, pin bar formations, inside bars, and breakout patterns provides a robust framework for navigating the complexities of the market. The key takeaway is that consistent profitability in trading requires a deep understanding of price action, coupled with diligent practice and continuous refinement of your chosen strategies.
For those of you building trading-focused businesses, predictable revenue streams are crucial for sustainable growth. Similar to how the ecommerce subscription model creates recurring revenue and fosters customer loyalty in online retail, applying these price action trading strategies can bring consistency and predictability to your investment approach. This resource, the Ultimate Guide to Ecommerce Subscription Model: Expert Strategies for Predictable Growth from Sharpei, offers valuable insights for businesses seeking a stable revenue model.
These price action trading strategies offer a path to more confident and informed trading decisions. By combining a solid understanding of these core principles with the right tools, you can significantly enhance your market analysis and trading performance. Take your price action trading to the next level with ChartsWatcher. Visit ChartsWatcher to explore how its customizable dashboards, real-time data, and advanced charting tools can help you effectively implement these strategies and confidently approach the markets in 2025 and beyond.
