7 Proven Trade Setups for Day Trading Success in 2025
In the fast-paced world of day trading, success isn't about luck; it's about discipline, strategy, and recognizing high-probability patterns. Many aspiring traders fail because they lack a defined playbook, jumping into trades based on gut feelings rather than proven methodologies. This leads to inconsistent results and, ultimately, blown accounts. The solution is to master a handful of reliable trade setups for day trading that provide a clear framework for entry, exit, and risk management.
This article breaks down seven of the most effective setups used by professional traders to consistently navigate the markets. We will explore the precise mechanics of each strategy, from identifying the initial conditions on a chart to executing with confidence. You will learn how to spot powerful patterns like the Morning Gap and Go, Bull Flag continuations, and Opening Range Breakouts.
Furthermore, we'll demonstrate how a powerful tool like ChartsWatcher can streamline this entire process, helping you scan for, analyze, and act on these opportunities in real-time. By the end of this guide, you will have a comprehensive blueprint for these setups, empowering you to approach the market with a structured plan. This knowledge is your key to trading with more precision and consistency, moving beyond guesswork to a rules-based system.
1. Morning Gap and Go Strategy
The Morning Gap and Go is a powerful momentum-based day trading setup designed to capture explosive moves during the first hour of the market open. This strategy focuses on stocks that "gap up" or "gap down" from their previous day's closing price. A gap occurs when a stock opens at a significantly different price, creating a literal gap on the chart with no trading activity in between.
This price jump is almost always driven by a fundamental catalyst, such as a strong earnings report, FDA approval, a product launch, or other significant news. The core idea is to identify these gapping stocks and ride the initial wave of momentum as the market reacts to the news. For this reason, it's one of the most popular trade setups for day trading among active traders.
How the Gap and Go Works
Traders using this setup screen for stocks gapping up or down between 5% and 15% pre-market. The key is to find gaps supported by unusually high volume, often three to five times the stock's average daily volume. This high volume confirms institutional interest and suggests the price move has strength behind it.
Once a qualified candidate is identified, the trader waits for the market to open. The first 5 to 15 minutes are crucial for confirming the direction of the momentum. A common entry tactic is to buy when the price breaks above the high of the first 5-minute candle for a gap up, or short-sell when it breaks below the low for a gap down.
For example, if Tesla (TSLA) announces better-than-expected delivery numbers and gaps up 8% pre-market on 5x its average volume, a Gap and Go trader would watch for a strong opening. If the first 5-minute candle is bullish and the price moves decisively above its high, it signals a strong entry point to go long.
Key Metrics for a Strong Setup
For a quick reference on the ideal parameters for this strategy, see the summary box below.
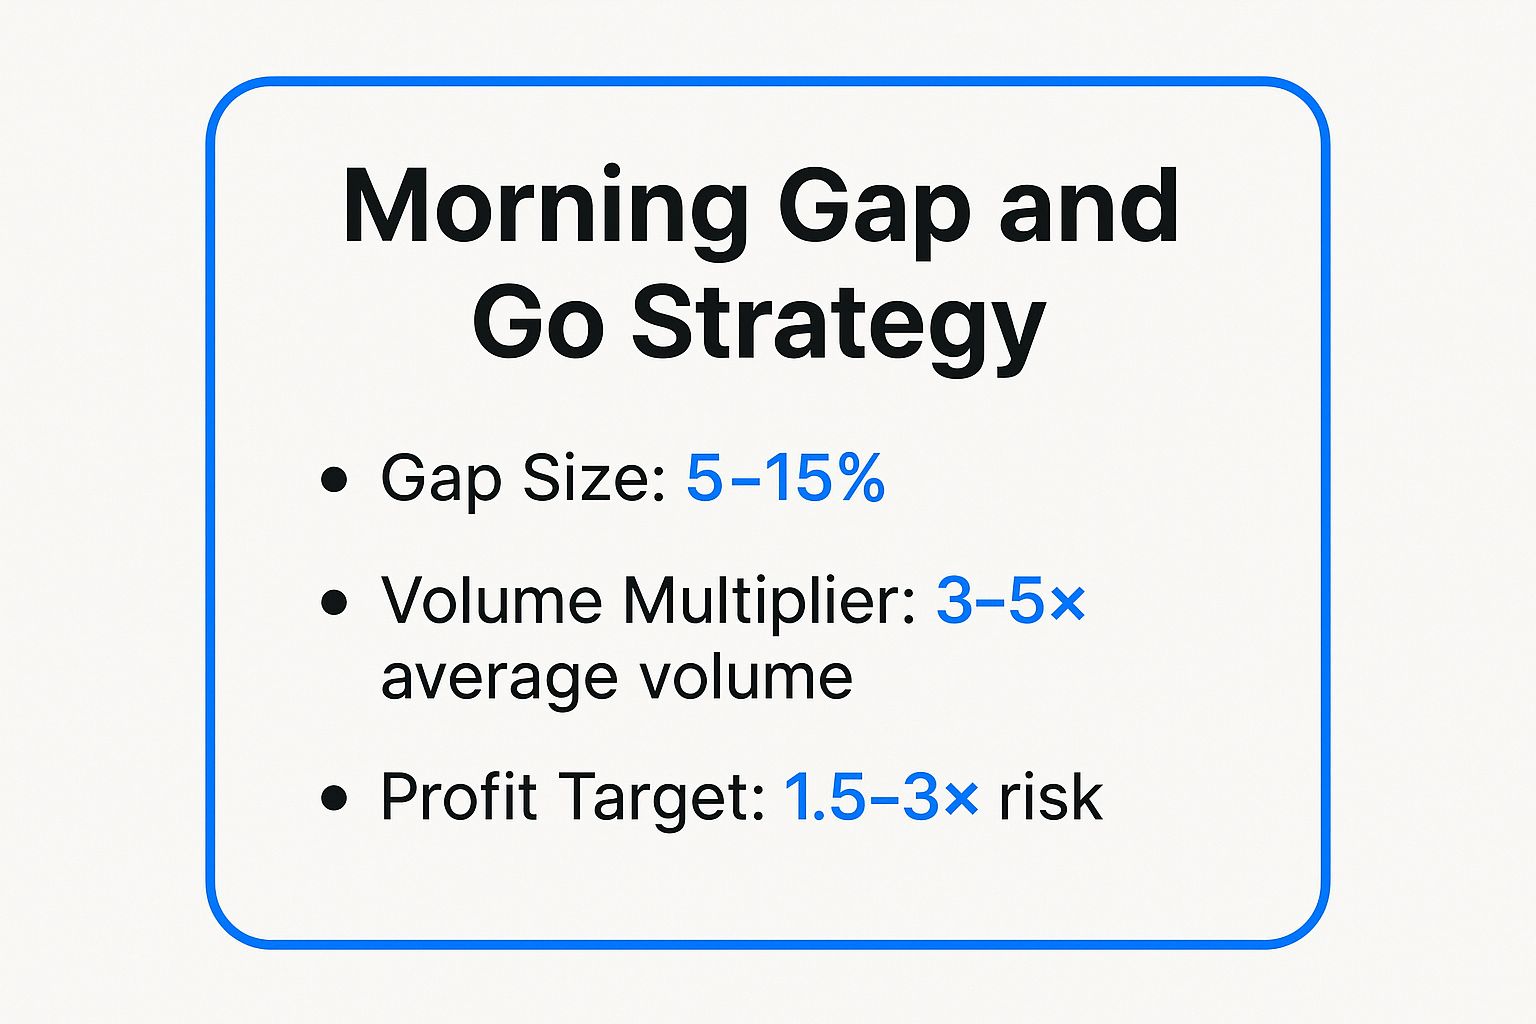
These metrics provide a solid framework for identifying high-probability Gap and Go opportunities while managing risk effectively.
Actionable Tips for Implementation
To successfully execute this strategy, consider these practical tips:
- Pre-Market Preparation: Start scanning for potential gappers about 30-60 minutes before the market opens using a reliable scanner. Filter for stocks with a clear news catalyst.
- Wait for Confirmation: Avoid jumping in right at the opening bell. Patience is key. Wait for the first 5-minute candle to close to establish an initial range and confirm the momentum's direction.
- Use Level 2 Data: Assess the order flow using Level 2 quotes. A heavy presence of buyers (on the bid) for a gap up can provide extra confidence in the trade's strength.
- Risk Management: Always define your stop-loss before entering. A common placement is just below the low of the entry candle or the low of the first 5-minute range. Avoid overly large gaps (over 20%) as they can be extremely volatile and prone to sharp reversals, often called "gap fills."
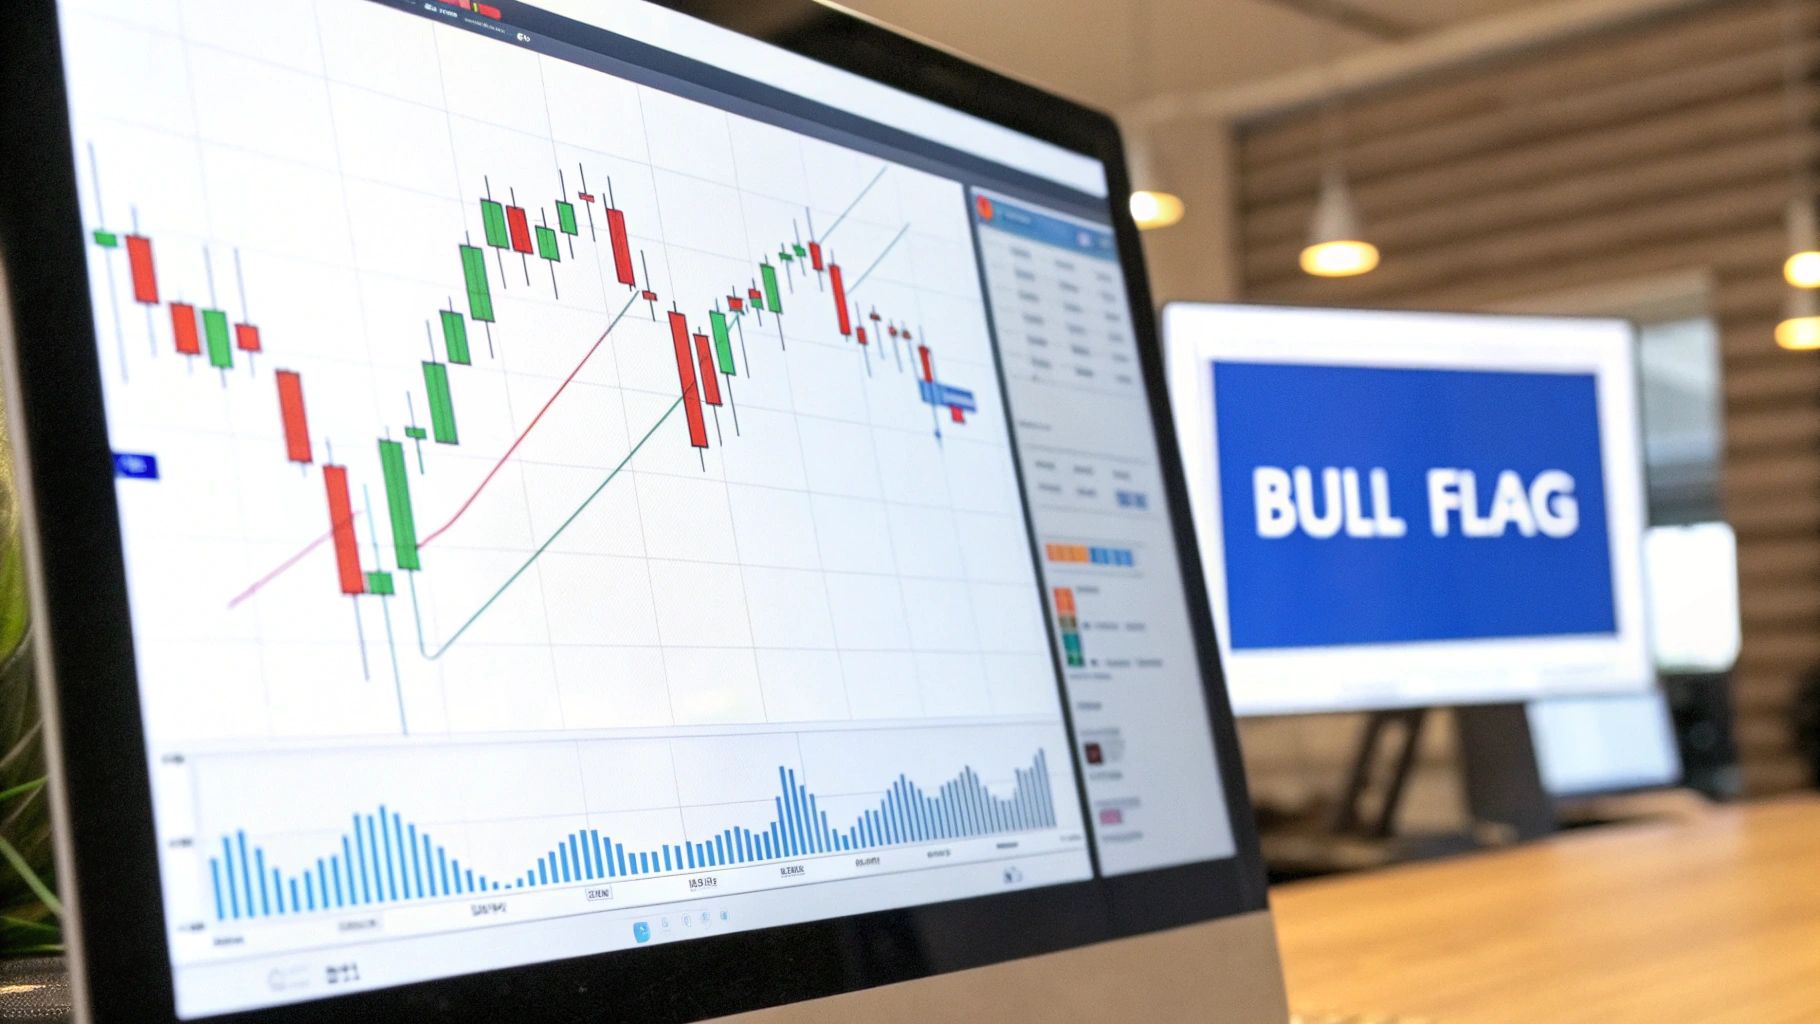
2. Bull Flag/Bear Flag Continuation Pattern
The Bull Flag and Bear Flag are classic continuation patterns that signal a brief pause in a strong trend before it resumes. These setups are highly favored by day traders because they offer clear entry and exit points within powerful, established momentum. A Bull Flag forms after a sharp, high-volume upward move (the "flagpole"), followed by a period of light-volume consolidation that drifts slightly downward (the "flag"). A Bear Flag is its inverse, appearing after a steep drop.
This consolidation represents profit-taking by early movers, not a reversal of the underlying trend. The pattern is confirmed when the price breaks out of the flag's consolidation range on renewed volume, continuing in the original direction. Because they form quickly and resolve predictably, these are considered some of the most reliable trade setups for day trading.
How Bull and Bear Flags Work
The setup begins with identifying a "flagpole," which is a significant, near-vertical price move. For a Bull Flag, traders look for a strong rally. For a Bear Flag, they look for a sharp decline. The key is that this initial move must occur on unusually high volume, which confirms strong conviction behind the trend.
Following the flagpole, the price enters a consolidation phase, forming the "flag." This phase should have noticeably lower volume than the flagpole, indicating that the institutional selling or buying pressure has temporarily subsided. The flag typically forms a rectangular or slightly sloped channel. The trade entry occurs when the price breaks decisively out of this channel’s boundary. For a Bull Flag, a trader buys as the price breaks above the upper trendline of the flag. For a Bear Flag, a trader short-sells as it breaks below the lower trendline.
For instance, if AAPL gaps up on strong earnings and forms a flagpole, a trader would watch the subsequent consolidation. If it forms a tight, downward-sloping channel on lower volume for 20 minutes, a breakout above that channel's resistance on a spike in volume signals a high-probability entry to go long.
Actionable Tips for Implementation
To successfully trade flag patterns, focus on these practical execution details:
- Confirm Volume Patterns: The most critical element is volume. The flagpole must have high volume, and the flag consolidation must have low, diminishing volume. A volume surge on the breakout is your final confirmation.
- Context is Key: Look for flags that form after a clear catalyst or breakout from a key level. A flag appearing in choppy, directionless markets is less reliable.
- Timeframe Matters: These patterns work across timeframes, but for day trading, the 1-minute, 5-minute, and 15-minute charts are most effective. Intraday flags that consolidate for more than a couple of hours often lose their momentum and may fail.
- Define Your Risk: Set your stop-loss just below the low of a Bull Flag's consolidation or just above the high of a Bear Flag's consolidation. This creates a well-defined and favorable risk-to-reward ratio. Your profit target can often be estimated by measuring the height of the flagpole and adding it to the breakout point.
3. VWAP (Volume Weighted Average Price) Bounce/Rejection
The Volume Weighted Average Price (VWAP) is a dynamic technical indicator representing the true average price a stock has traded at throughout the day, based on both price and volume. Many institutional traders and algorithms use VWAP as a key benchmark for execution quality. This makes it a powerful "mean" or equilibrium point; prices tend to revert to it, and strong trends use it as a dynamic support or resistance level.
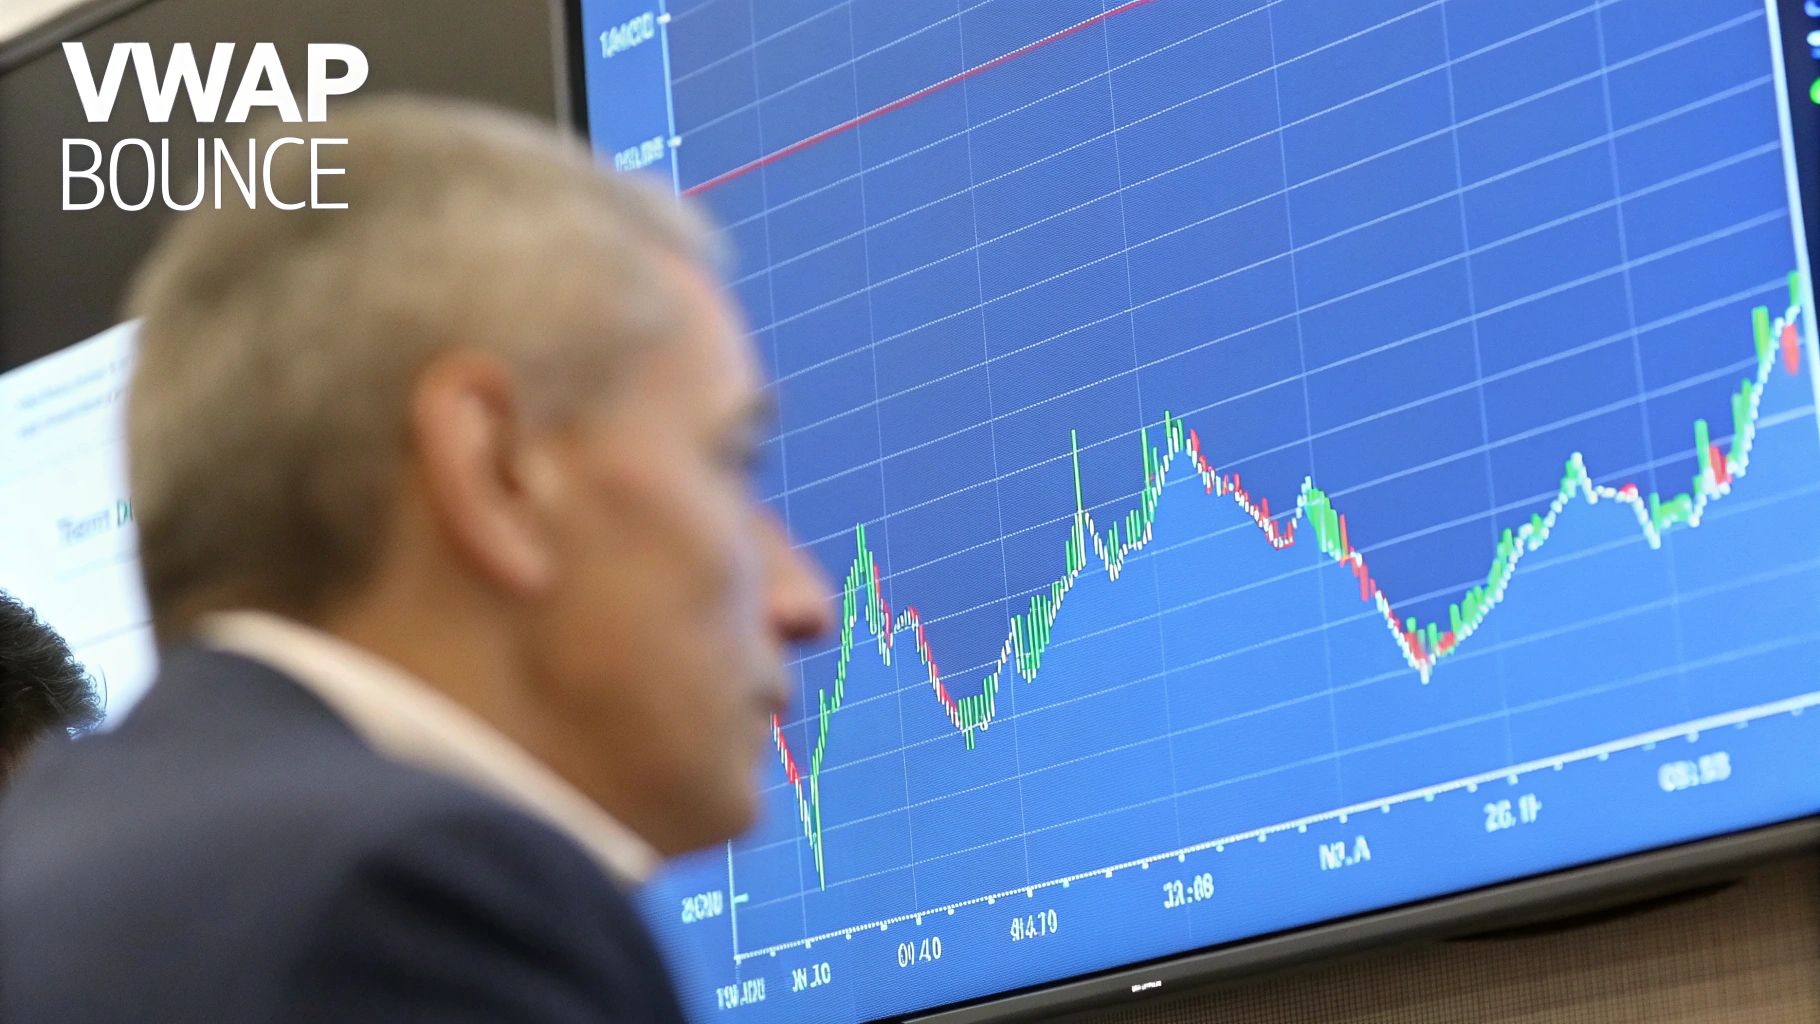
The VWAP Bounce/Rejection strategy is built on this principle. It involves buying when a stock in an uptrend pulls back and "bounces" off the VWAP line, or short-selling when a stock in a downtrend rallies up and is "rejected" by the VWAP line. Because it reflects the real-time sentiment of large market participants, it is considered one of the most reliable trade setups for day trading.
How VWAP Bounce/Rejection Works
This setup relies on identifying stocks that are clearly trending and respecting the VWAP. For a long setup (bounce), traders look for a stock trading consistently above its VWAP. When the price pulls back to test the VWAP line, traders watch for signs of buyers stepping in, confirming it as a support level. The entry is triggered as the price starts to move away from VWAP, resuming its uptrend.
Conversely, for a short setup (rejection), a trader seeks a stock trading below its VWAP. During a counter-trend rally, the price approaches the VWAP from below. If sellers re-emerge and push the price back down, it signals a high-probability entry to go short, anticipating a continuation of the downtrend.
For instance, if a high-volume stock like Amazon (AMZN) is in a strong uptrend and its price dips to the VWAP line, a trader might see buying volume increase on the 1-minute chart. This bounce is the signal to enter a long position, placing a stop-loss just below the VWAP to manage risk.
Key Metrics for a Strong Setup
For a quick reference on the ideal parameters for this strategy, see the summary box below.
- Stock Price vs. VWAP: For long trades, price should be above VWAP; for short trades, price should be below VWAP.
- Volume: Look for an increase in volume as the price touches the VWAP, confirming institutional participation.
- Candlestick Patterns: Watch for bullish reversal candles (like hammers) at VWAP for bounces or bearish candles (like shooting stars) for rejections.
- Daily Volume: This strategy works best on liquid stocks with an average daily volume greater than 1 million shares.
These metrics help you filter for stocks where VWAP is most likely to act as a significant and predictable level.
Actionable Tips for Implementation
To successfully execute this strategy, consider these practical tips:
- Combine with Other Indicators: Use VWAP in conjunction with moving averages (like the 9 or 20 EMA) or RSI to confirm momentum. A bounce off VWAP that coincides with an oversold RSI reading is a stronger signal.
- Context is King: Analyze the broader market context. A VWAP bounce on SPY during an overall market uptrend is more reliable than a bounce during a choppy or bearish day.
- Patience at the Touch: Don't enter the moment price touches VWAP. Wait for a confirmation candle to close, showing that the level is holding and the price is moving in your intended direction.
- Manage Risk Tightly: Your stop-loss should be placed on the other side of the VWAP. If you're buying a bounce, your stop goes just below the VWAP line. If the price breaks and holds on the other side, your trade thesis is invalidated.
4. Opening Range Breakout (ORB)
The Opening Range Breakout (ORB) is a classic day trading strategy that capitalizes on the initial directional bias established shortly after the market opens. Popularized by legendary traders like Toby Crabel and Larry Williams, this setup involves identifying the high and low of a specific initial period, typically the first 15, 30, or 60 minutes of trading, and then placing a trade when the price breaks out of this defined range.
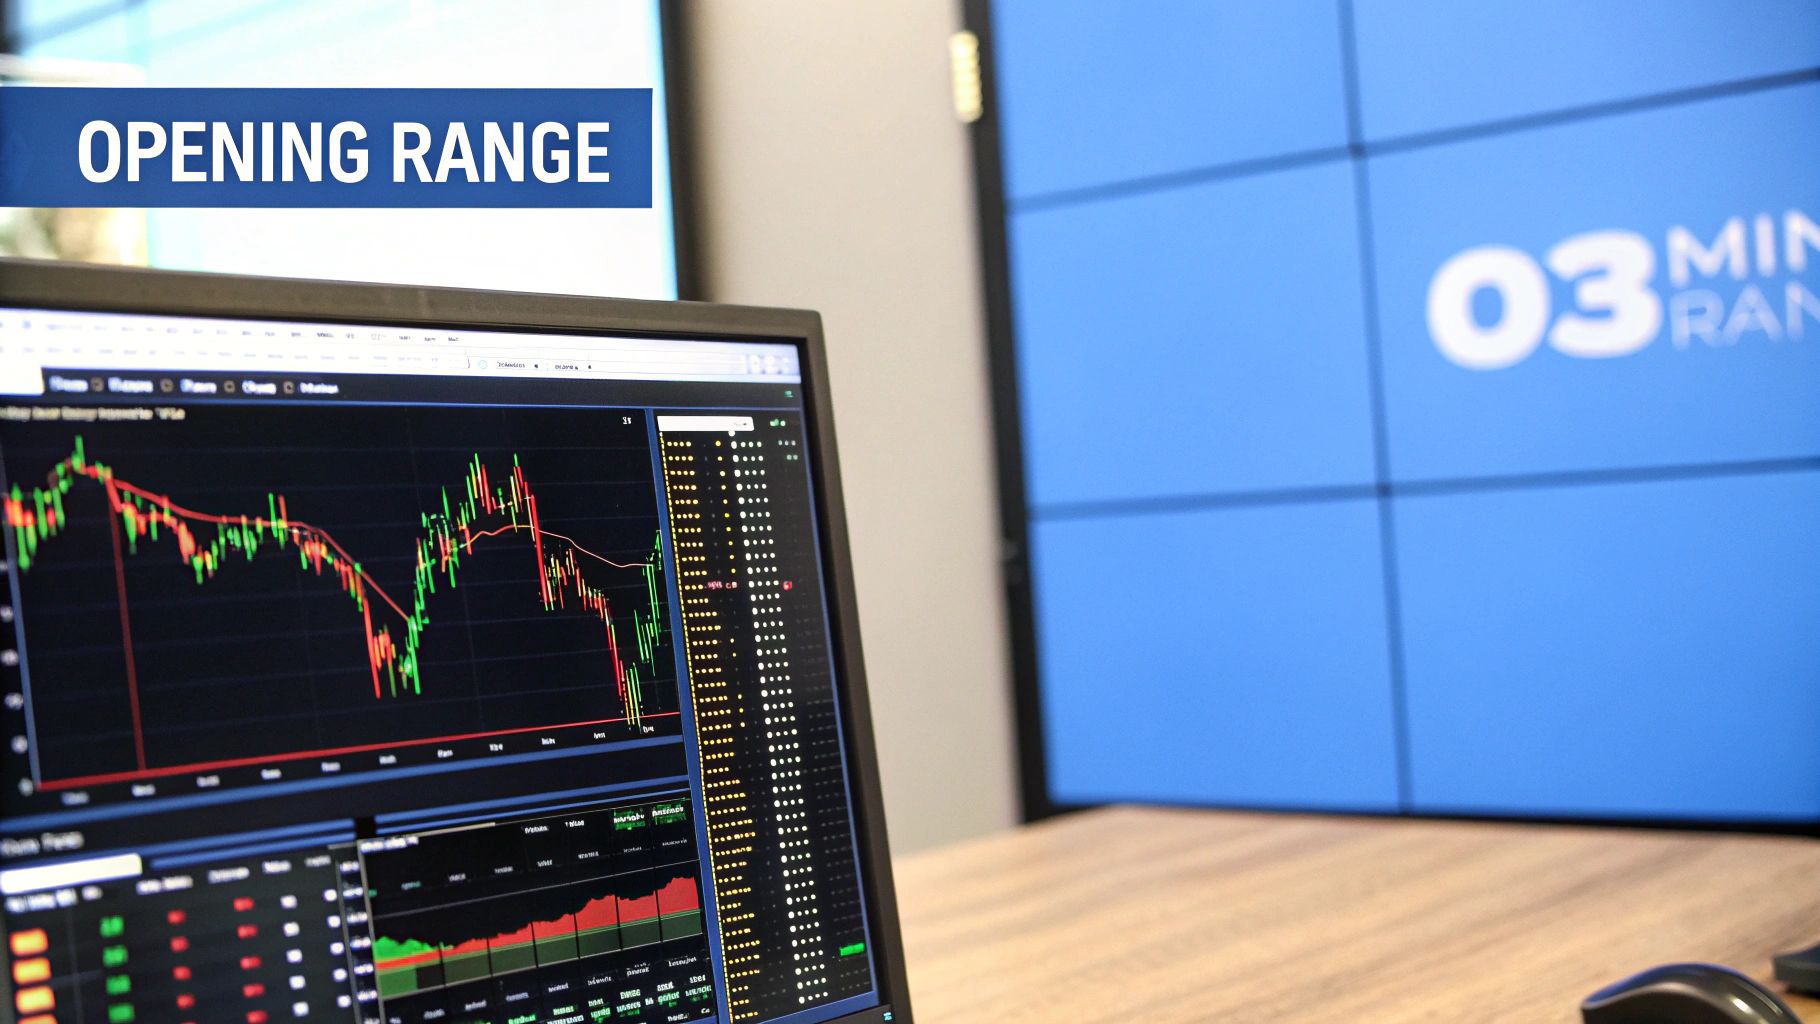
The underlying principle is that the opening range represents an initial equilibrium between buyers and sellers. A decisive breakout signals that one side has gained control, often setting the trend for a significant portion of the trading day. This makes it one of the most reliable trade setups for day trading, especially on days with market-moving news or for stocks with a specific catalyst.
How the Opening Range Breakout Works
To execute an ORB, a trader first defines the "opening range" period. A common choice is the first 30 minutes (ORB 30). Once this period ends, the high and low prices achieved within it become the key trigger points. A buy order is placed just above the range's high, and a short-sell order is placed just below the range's low.
The breakout must be accompanied by a surge in volume to be considered valid. This volume confirmation suggests strong participation and reduces the likelihood of a "false breakout," where the price briefly pierces the range only to reverse.
For example, consider NVDA on a day it releases positive AI-related news. A trader might define the opening range as the first 30 minutes of trading. If the range is between $905 and $915, a breakout above $915 on high volume would signal a strong long entry. The initial price target could be a multiple of the range size, such as two times its height ($10 range x 2 = $20 target, or $935).
Key Metrics for a Strong Setup
For a quick reference on the ideal parameters for this strategy, see the summary box below.
These metrics provide a solid framework for identifying high-probability Opening Range Breakout opportunities while managing risk effectively.
Actionable Tips for Implementation
To successfully execute this strategy, consider these practical tips:
- Wait for Volume Confirmation: A breakout without a significant increase in volume is a red flag. Wait for volume to be at least 1.5 to 2 times the average for that time of day before entering.
- Adjust Range for Volatility: On highly volatile days, such as during FOMC announcements or major economic data releases, consider using a wider opening range (e.g., 60 minutes) to avoid getting stopped out by initial noise.
- Consider Overall Market Direction: An ORB trade has a higher probability of success if it aligns with the broader market trend. A breakout to the upside is stronger if the S&P 500 (SPY) is also trending up.
- Set Clear Profit Targets: Plan your exits. A common technique is to scale out of the position, taking the first profit at a 1:1 risk/reward ratio and a second profit at a target equal to two or three times the height of the opening range. Your stop-loss should be placed on the opposite side of the range.
5. Momentum Scalping with Level 2
Momentum Scalping with Level 2 is a high-frequency trading strategy designed for traders who thrive on speed and precision. This approach involves capturing small profits from minor price fluctuations by reading real-time order flow and momentum. Traders using this setup enter and exit positions within seconds or minutes, aiming to compound small gains throughout the day.
This strategy is built on interpreting Level 2 market data, which displays the order book for a specific stock, showing the real-time bid and ask prices from different market makers. By analyzing the size and speed of these orders, scalpers can anticipate short-term price movements. Because it requires intense focus and quick decision-making, it is one of the most demanding but potentially rewarding trade setups for day trading.
How Momentum Scalping with Level 2 Works
The core of this strategy is to identify imbalances in supply and demand. Traders look for stocks with high relative volume and clear directional momentum. A strong setup occurs when a large number of buyers (bids) are absorbing all the available shares at a certain price level (the ask), causing the price to tick upward.
Once a stock with high volume and a tight bid-ask spread is identified, the trader monitors its Level 2 data and Time & Sales window. The goal is to spot large orders appearing on the bid, which suggests strong buying pressure, or large orders on the ask, indicating selling pressure. The scalper then enters a position to ride the immediate momentum.
For example, if a high-volume stock like TSLA is approaching a key resistance level and you see large buy orders refreshing on the bid side of the Level 2 screen while the ask side is thinning out, it signals a potential breakout. A scalper would quickly enter a long position, aiming to exit for a small profit as soon as the price ticks up a few cents.
Key Metrics for a Strong Setup
To effectively scalp momentum, focus on these critical elements for identifying high-probability opportunities and ensuring quick execution.
Actionable Tips for Implementation
To successfully execute this high-speed strategy, consider these practical tips:
- Focus on Tight Spreads: Only trade stocks with a bid-ask spread of less than $0.05. Wider spreads increase your transaction costs and make it difficult to profit from small price moves.
- Use Hotkeys for Execution: Speed is everything in scalping. Configure hotkeys for buying, selling, and canceling orders to ensure you can execute trades instantly without fumbling with your mouse.
- Master Level 2 Analysis: Understanding how to read order flow is non-negotiable. Learn more about how to read Level 2 data in our complete guide. Look for patterns like "iceberg" orders or a "bid stack" to gauge institutional interest.
- Manage Risk with Position Sizing: Since you are aiming for small gains, you must use strict risk management. Use smaller position sizes and have a hard stop-loss on every trade. Never let a small scalp turn into a large losing position.
6. Red to Green (R2G) Reversal Strategy
The Red to Green (R2G) Reversal is a potent day trading setup that capitalizes on a powerful shift in market sentiment. This strategy focuses on stocks that open lower for the day (in the "red") but then reverse course and break above their previous day's closing price, turning positive (or "green"). This move often signifies a failed breakdown and a rush of buying pressure.
This reversal is frequently fueled by a combination of factors: early morning panic selling that gets exhausted, short sellers covering their positions to lock in profits, and value-focused buyers stepping in at perceived support levels. The core idea is to identify this inflection point where sellers lose control and buyers take over, riding the subsequent momentum. This makes it one of the most dynamic trade setups for day trading for those skilled at reading intraday sentiment shifts.
How the Red to Green Works
Traders using this setup scan for stocks that initially sold off at the market open, often due to a negative catalyst or broad market weakness. The key is not to trade the initial weakness but to wait for signs of a bottom forming. The pivotal moment is when the stock price climbs back toward and crosses the previous day's close (the R2G line).
Once a potential candidate is on the watchlist, the trader observes its price action and volume. A classic entry signal is when the stock reclaims the previous day's close on significantly higher-than-average volume. This volume surge is critical as it confirms that the reversal has conviction and isn't just a minor bounce.
For instance, imagine a growth stock sells off 4% at the open after a mixed earnings report. An R2G trader would watch it closely. If the stock establishes a higher low, grinds its way back up, and then surges through its prior day's closing price with a massive spike in buying volume, it signals a strong entry point to go long. The former resistance (the prior close) now acts as a key support level.
Key Metrics for a Strong Setup
For a quick reference on the ideal parameters for this strategy, see the summary box below.
These metrics provide a solid framework for identifying high-probability R2G opportunities while managing the inherent risks of reversal trading.
Actionable Tips for Implementation
To successfully execute this strategy, consider these practical tips:
- Wait for Confirmation: Patience is paramount. Avoid "catching a falling knife" by trying to guess the bottom. Wait for the stock to prove its strength by establishing a higher low and then decisively breaking the previous day's closing price.
- Volume is Your Guide: A true R2G move is accompanied by a dramatic increase in volume. If the stock crosses the key level on light volume, the move is more likely to fail. Use a volume-weighted average price (VWAP) as an additional confirmation tool.
- Check for Support: The strongest R2G reversals often happen after the initial sell-off finds support at a key technical level, such as a major moving average (50 or 200 SMA), a prior day's low, or a significant long-term trendline.
- Manage Risk Tightly: Define your stop-loss before entering. A common placement is just below the prior day's close or below the low of the candle that broke through the R2G level. This ensures you cut losses quickly if the reversal fails.
7. Support and Resistance Breakout Strategy
The Support and Resistance Breakout Strategy is a timeless and foundational approach to day trading that focuses on significant price levels where buying or selling pressure has historically reversed direction. Support is a price level where a downtrend can be expected to pause due to a concentration of demand. Resistance is the opposite, a price level where an uptrend is likely to pause due to a concentration of supply.
This strategy operates on the principle that when price decisively breaks through one of these established barriers, it often signals a powerful shift in market sentiment. This breakout can trigger a cascade of stop-loss orders and attract momentum traders, propelling the price further in the direction of the break. Its reliability and clear visual cues make it one of the most respected trade setups for day trading.
How the Support and Resistance Breakout Works
Traders using this setup identify key horizontal support and resistance levels on their charts, often using data from previous trading sessions like the prior day's high and low. The more times a level has been tested and held, the more significant it becomes. The core of the strategy is to wait for the price to break above a resistance level or below a support level with a notable increase in trading volume.
Volume confirmation is crucial; a breakout on low volume is often a "fakeout" and is more likely to fail. A high-volume breakout, however, confirms conviction from other market participants and increases the probability of a sustained move. For example, if the SPY ETF repeatedly fails to break above $500 over several hours, that level becomes a key resistance. A trader would watch for a powerful move above $500 accompanied by a surge in volume to initiate a long position.
Actionable Tips for Implementation
To effectively trade breakouts from these key levels, consider these practical tips:
- Prioritize Major Levels: Use the previous day's high and low, as well as multi-day highs and lows, as your primary levels. These are widely watched by institutional and retail traders alike, making breakouts from them more significant.
- Demand Volume Confirmation: Do not enter a breakout trade without a clear spike in volume. Set an alert on your trading platform to notify you when volume exceeds its recent average, confirming the move's strength.
- Look for Confluence: A support or resistance level is stronger if it aligns across multiple timeframes. For instance, if a key resistance on the 15-minute chart is also a weekly high, a breakout carries much more weight.
- Be Patient with Re-tests: A common pattern is for the price to break a level and then pull back to "re-test" it from the other side. This re-test can offer a lower-risk entry point, as the old resistance becomes new support (and vice versa).
For traders looking to master this technique, understanding how to accurately draw and interpret these levels is paramount. To dive deeper, you can explore this support and resistance trading strategy guide on chartswatcher.com for a comprehensive look at real-world applications.
Day Trading Setup Strategy Comparison
| Strategy | Implementation Complexity 🔄 | Resource Requirements ⚡ | Expected Outcomes 📊 | Ideal Use Cases 💡 | Key Advantages ⭐ |
|---|---|---|---|---|---|
| Morning Gap and Go Strategy | Medium 🔄 (pre-market screening, quick entry) | Moderate ⚡ (volume data, Level 2 data) | High momentum gains, quick profits 📊 | Trending markets, earnings beats, news catalysts | High probability setups, clear rules ⭐ |
| Bull Flag/Bear Flag Continuation | Medium 🔄 (pattern identification, patience) | Low to Moderate ⚡ (charting tools) | High probability continuation 📊 | All timeframes, after strong directional moves | Defined risk, clear targets across timeframes ⭐ |
| VWAP Bounce/Rejection | Low to Medium 🔄 (tracking VWAP line) | Low ⚡ (VWAP indicator, volume data) | Reliable entries/exits based on institutional behavior 📊 | High-volume liquid stocks, institutional trading | Institutional reference, adaptable strategy ⭐ |
| Opening Range Breakout (ORB) | Medium 🔄 (monitor first 15-60 mins range) | Moderate ⚡ (volume data, charting) | Capture momentum early in session 📊 | Earnings season, catalyst stocks, morning trades | Simple, mechanical, clear risk management ⭐ |
| Momentum Scalping with Level 2 | High 🔄 (real-time Level 2 data, fast execution) | High ⚡ (advanced tools, direct market access) | Small, frequent profits, very fast 📊 | High relative volume, tight spreads, scalp trades | Quick profits, limited exposure ⭐ |
| Red to Green (R2G) Reversal | Medium 🔄 (monitor intraday reversal) | Moderate ⚡ (volume data, catalyst tracking) | Capture reversal momentum 📊 | Stocks opening down heavily, oversold bounces | Clear psychological targets, strong momentum ⭐ |
| Support and Resistance Breakout | Medium 🔄 (level identification, volume confirmation) | Low to Moderate ⚡ (charting, volume data) | Directional moves from key price points 📊 | Trending markets, breakout plays across instruments | Proven TA principles, applicable broadly ⭐ |
From Theory to Execution: Building Your Personal Trading Edge
We have journeyed through seven distinct and powerful trade setups for day trading, each representing a unique methodology for capitalizing on short-term market movements. From the explosive pre-market dynamics of the Morning Gap and Go to the calculated precision of the Opening Range Breakout, and from the trend-confirming power of Bull and Bear Flags to the institutional gravity of VWAP, these strategies form a comprehensive toolkit. You’ve seen how to identify entries, manage risk, and set logical profit targets for each one.
The fundamental takeaway is not to become a jack-of-all-trades, but a master of one or two. True proficiency in day trading comes from deep, specialized knowledge, not a superficial understanding of many strategies. Your personality, risk tolerance, and the amount of time you can dedicate to the screen will naturally guide you toward the setups that feel most intuitive.
Key Insight: A successful trading career isn't built on finding a "holy grail" setup. It's built on finding a setup that aligns with your psychology and then executing it with iron-clad discipline, consistency, and relentless practice.
Forging Your Path: From Knowledge to Actionable Skill
The transition from theoretical knowledge to real-world profitability is the most critical phase of your development as a trader. It’s where the concepts on the screen become tangible results in your account. To navigate this crucial step, focus on a structured, deliberate process.
Here are your actionable next steps:
- Select Your Niche: Review the setups we've covered. Does the fast-paced nature of Momentum Scalping excite you, or does the methodical approach of a Support and Resistance Breakout feel more comfortable? Choose one or two setups to focus on exclusively for the next 90 days.
- Immerse Yourself in Data: Use a simulator or paper trading account to backtest and forward-test your chosen strategy. Your goal is to see it in every possible market condition, identifying its strengths and, more importantly, its weaknesses. Track every trade in a journal, noting the entry, exit, rationale, and outcome.
- Refine Your Rules of Engagement: No setup is one-size-fits-all. Based on your testing, create a rigid, written trading plan. Define your exact entry criteria, your non-negotiable stop-loss placement (e.g., below the low of the ORB candle, a specific dollar amount, etc.), and your profit-taking strategy (e.g., target 2R, scale out at key levels).
- Leverage Technology for an Edge: In today's markets, manual scanning is inefficient. As you move from theory to execution and build your personal trading edge, consider how modern tools can enhance your analytical capabilities. Mastering techniques like using AI for financial analysis can provide deeper insights and automate pattern recognition, giving you a significant advantage. This allows you to focus less on searching and more on executing high-probability trades.
The Power of Deliberate Practice
Mastering these trade setups for day trading is a journey of a thousand trades, not a single lightbulb moment. Each setup, whether it’s a Red to Green reversal or a VWAP bounce, is a tool. Just as a master carpenter knows precisely which chisel to use for a specific cut, a master trader knows which setup to deploy for a specific market condition.
This mastery is achieved through deliberate practice and unwavering discipline. It's about showing up every single day, adhering to your plan even when emotions run high, and continuously learning from both your wins and your losses. By committing to this process, you transform generic strategies into a personalized edge that can serve you for a lifetime. You are not just learning setups; you are building a business, and your dedication is the ultimate key to its success.
Ready to stop hunting for setups and start executing them with precision? ChartsWatcher provides the institutional-grade scanning, real-time alerts, and advanced charting you need to master any of the trade setups for day trading discussed in this guide. Stop missing opportunities and start trading with a data-driven edge by signing up for ChartsWatcher today.
