7 Advanced Stop Loss Strategies That Actually Work in 2025
Master Your Exits: Why Standard Stop Losses Are Costing You Money
Every trader knows the pain of being 'stopped out' just before a stock reverses and skyrockets. It’s a frustrating, all-too-common experience that often stems from using overly simplistic or one-size-fits-all risk management. While the concept of a stop loss is fundamental, the strategy behind where you place it is what separates consistently profitable traders from the rest. Generic advice like 'always use a 5% stop' fails to account for a critical factor: market context and asset volatility. This flawed approach leads to premature exits, missed opportunities, and a portfolio that bleeds from a thousand tiny cuts.
In this guide, we move far beyond the basics. We will dissect seven distinct and advanced stop loss strategies, exploring the specific logic that powers each one. You'll learn not just what they are, but why they work in different scenarios, how to adapt them to changing market conditions, and crucially, how to implement and backtest them using sophisticated tools like ChartsWatcher. Prepare to transform your approach to risk and learn how to protect your capital with the precision of a professional, ensuring your exits are as well-planned as your entries.
1. Strategy 1: The Fixed Percentage Stop Loss – Simple, But Is It Smart?
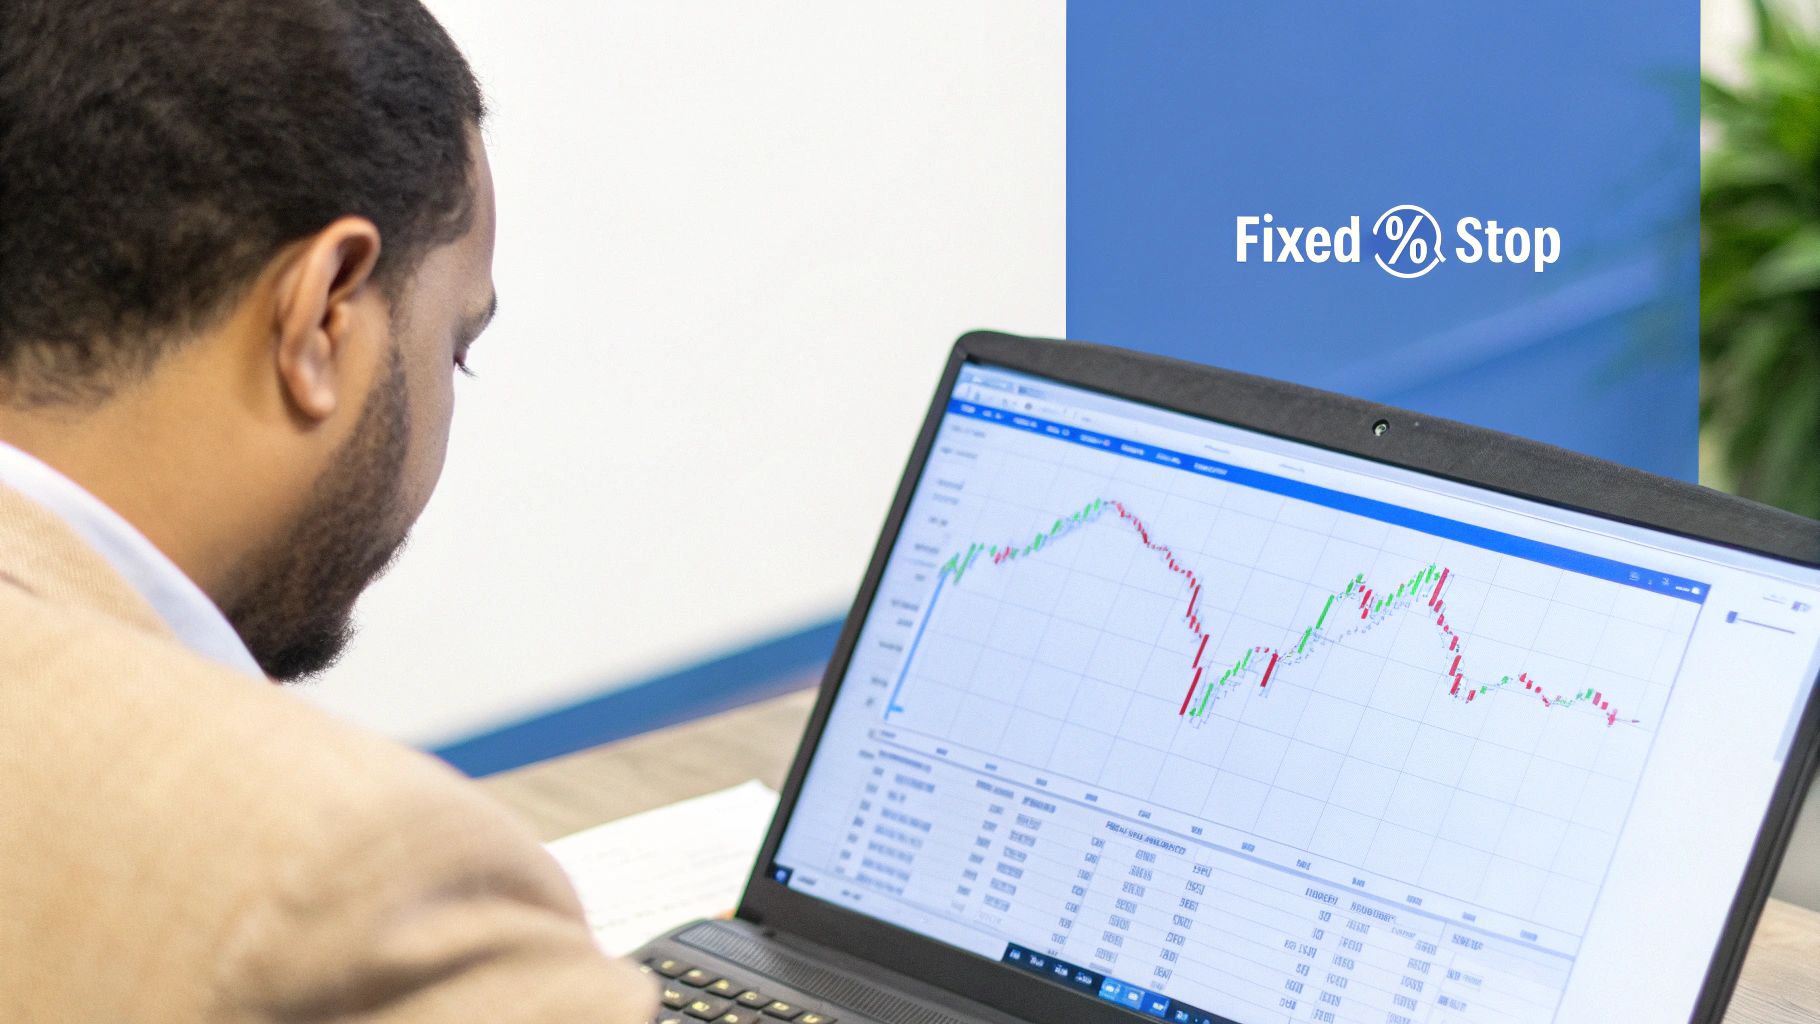
The fixed percentage stop loss is one of the most fundamental and widely used stop loss strategies, forming the bedrock of many traders' risk management plans. Its principle is refreshingly simple: you determine a specific percentage of your capital you are willing to risk on a single trade and place your stop loss order at that level below your entry price. This method forces a consistent, disciplined approach, removing the emotional impulse to hold onto a losing trade in the hope of a rebound.
For example, if you purchase a stock at $100 and decide your maximum tolerable loss is 5%, you would set a stop loss order at $95. If the stock price drops to that level, your position is automatically closed, capping your loss. This mechanical approach, popularized by figures like William O'Neil, is excellent for beginners because it installs a non-negotiable risk parameter for every trade, making risk calculation straightforward and repeatable.
Why It's a Go-To Strategy
The primary advantage is its simplicity and its power to enforce discipline. By setting a fixed rule, you prevent decision-making based on fear or greed during live market action. However, this rigidity is also its main drawback. A fixed percentage does not account for an asset's unique volatility. A 5% stop might be appropriate for a stable, low-volatility blue-chip stock, but it could be far too tight for a volatile cryptocurrency or a small-cap growth stock, leading to premature exits, or "whipsaws," from otherwise profitable positions.
Practical Implementation & Actionable Tips
Using this strategy effectively requires nuance rather than a one-size-fits-all number. Consider these tips:
- Adapt to Volatility: Don't use the same percentage for every asset. A conservative investor might use a 2-3% stop on a stock like Johnson & Johnson, while a crypto trader might need a 10-15% stop for Bitcoin to avoid being stopped out by normal daily fluctuations.
- Backtest Your Percentages: Use historical data on a platform like ChartsWatcher to test how different percentages (e.g., 5%, 8%, 10%) would have performed on the specific asset you are trading. This helps you find a percentage that aligns with the asset's typical price movements.
- Factor in Costs: Ensure your chosen percentage accounts for transaction costs like commissions and slippage. A very tight 1% stop could easily be erased by trading fees alone, resulting in a net loss even if the stop is triggered at your price.
2. The Trailing Stop Loss – Letting Your Winners Run
The trailing stop loss is a dynamic and powerful evolution of the fixed stop, designed to both protect your initial capital and lock in profits as a trade moves in your favor. Unlike a static stop that remains fixed at a specific price, a trailing stop automatically adjusts upward (for a long position) as the asset's price rises. It is typically set as a specific percentage or dollar amount below the current market price, creating a moving floor that only goes up, never down. This dynamic nature is why many consider it one of the most effective stop loss strategies for trend-following.
For example, imagine you buy a stock at $50 and set a 10% trailing stop. Your initial stop loss is at $45. If the stock rallies to $60, your trailing stop automatically moves up to $54 (10% below the new high of $60). Should the stock then pull back and hit $54, your position is closed, securing a $4 profit per share. This method, advocated by legendary traders like Jesse Livermore, allows you to capture the majority of a strong trend without prematurely exiting or giving back all your gains.
Why It's a Go-To Strategy
The core strength of the trailing stop is its dual function: it acts as a risk management tool at the start of a trade and morphs into a profit-protection mechanism as the trade succeeds. This removes the difficult psychological decision of when to take profits, automating the process and preventing greed from turning a winning trade into a loser. However, its main challenge lies in setting the correct trailing distance. A trail that is too tight will get you stopped out by normal price fluctuations in a healthy trend. A trail that is too wide risks giving back a significant portion of your unrealized profits before it triggers.
Practical Implementation & Actionable Tips
Mastering the trailing stop requires balancing patience with protection. Consider these professional tips:
- Base it on Volatility: Don’t pick an arbitrary percentage. Use a volatility indicator like the Average True Range (ATR). For instance, setting a trailing stop at 2x or 3x the ATR value helps ensure your stop is outside the normal daily "noise" of the asset.
- Wait for Confirmation: Avoid applying a trailing stop immediately upon entering a trade. Use an initial hard stop loss first. Once the trade moves into a clear profit (e.g., up by one risk unit), you can then switch to a trailing stop to begin protecting those gains.
- Widen in Strong Trends: For an asset in a very strong, established uptrend, consider using a wider-than-usual trail (e.g., 20-25%). This was a successful approach for traders holding stocks like Amazon during its major bull runs, as it allowed them to stay in the position through minor pullbacks and capture a larger portion of the overall move.
3. The ATR-Based Stop Loss – Adapting to Market Volatility
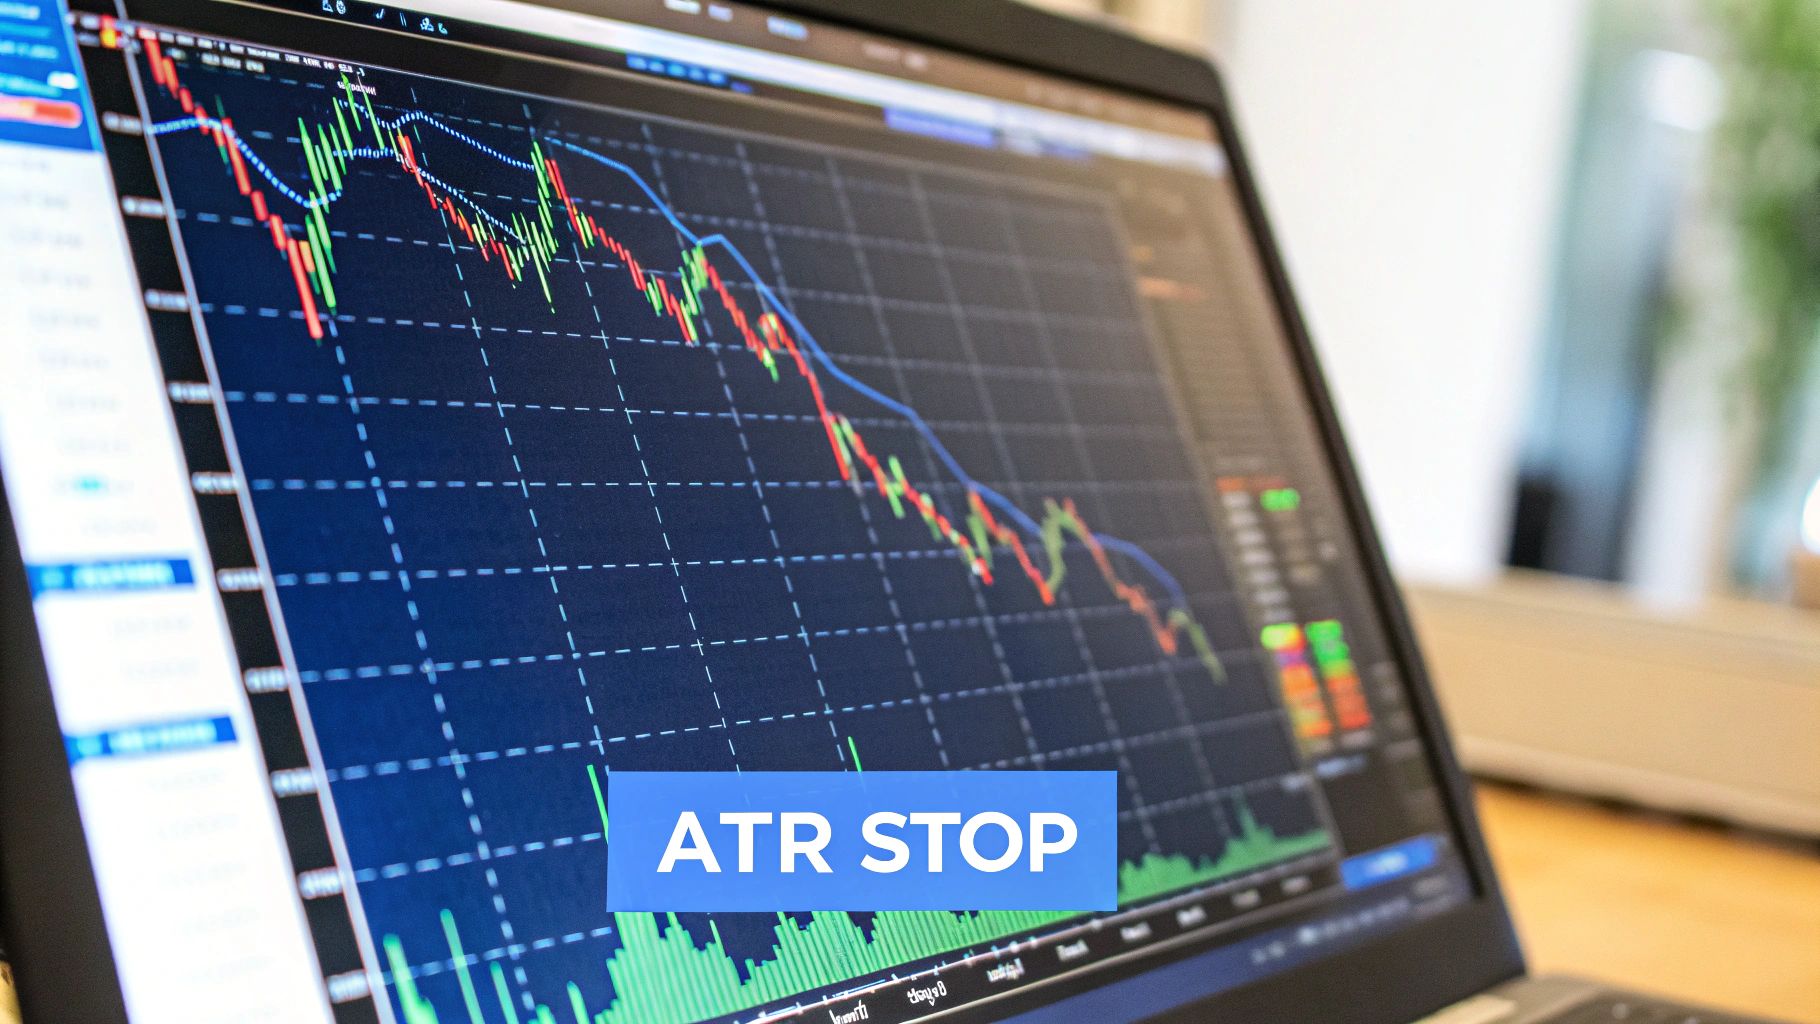
For traders seeking a more intelligent alternative to the rigid fixed percentage, the Average True Range (ATR) based stop loss is a powerful tool. This strategy uses the ATR indicator, developed by J. Welles Wilder Jr., to set stop losses based on an asset's recent historical volatility. The ATR calculates the average "true range" of price movements over a specified period, giving you a dynamic value that expands during volatile markets and contracts during quiet ones. This allows your stop loss to breathe with the market's natural rhythm.
Instead of a fixed percentage, you use a multiple of the ATR value to set your stop. For example, if a stock you bought at $50 has a 14-day ATR of $2, a standard 2x ATR stop loss would be placed at $46 ($50 entry - (2 * $2 ATR)). This method, favored by position sizing experts like Van Tharp, ensures your stop is wide enough to avoid premature exits from normal price fluctuations but tight enough to protect your capital.
Why It's a Go-To Strategy
The key advantage of the ATR-based stop is its adaptability. It automatically tailors your risk to the specific character of the asset you're trading. A volatile cryptocurrency will have a higher ATR, leading to a naturally wider stop, while a stable blue-chip stock will have a lower ATR and a tighter stop. This built-in logic helps prevent being "whipsawed" out of a position that is simply experiencing normal volatility, a common frustration with fixed percentage stops. It’s one of the most effective stop loss strategies for systematic and algorithmic traders.
Practical Implementation & Actionable Tips
Mastering the ATR stop involves choosing the right settings and multiplier for your trading style. Consider these tips for effective implementation:
- Choose Your Multiplier: Start with a standard 2x ATR multiple, but adjust based on your risk tolerance. A more conservative trader might use a 1.5x multiplier for tighter risk control, while a swing trader aiming to ride a longer trend might use a 3x or 4x multiplier to give the trade more room.
- Standard Period Setting: The 14-period ATR is the industry standard and a great starting point. Shorter periods (like 5 or 7) will make the ATR more sensitive to recent price action, while longer periods (like 21 or 50) will smooth it out.
- Combine with Market Structure: For added confirmation, place your ATR-based stop just below a significant support level. If your 2x ATR calculation places the stop at $95.50 and there is a key support level at $95, consider moving the stop to just below $95 for a more robust placement.
- Backtest on ChartsWatcher: Before deploying this strategy, use a platform like ChartsWatcher to backtest different ATR periods and multipliers on the asset. This data-driven approach will help you discover which parameters best suit the asset's historical behavior and your strategy's goals.
4. Strategy 4: The Support and Resistance Stop Loss – Trading with the Market Structure
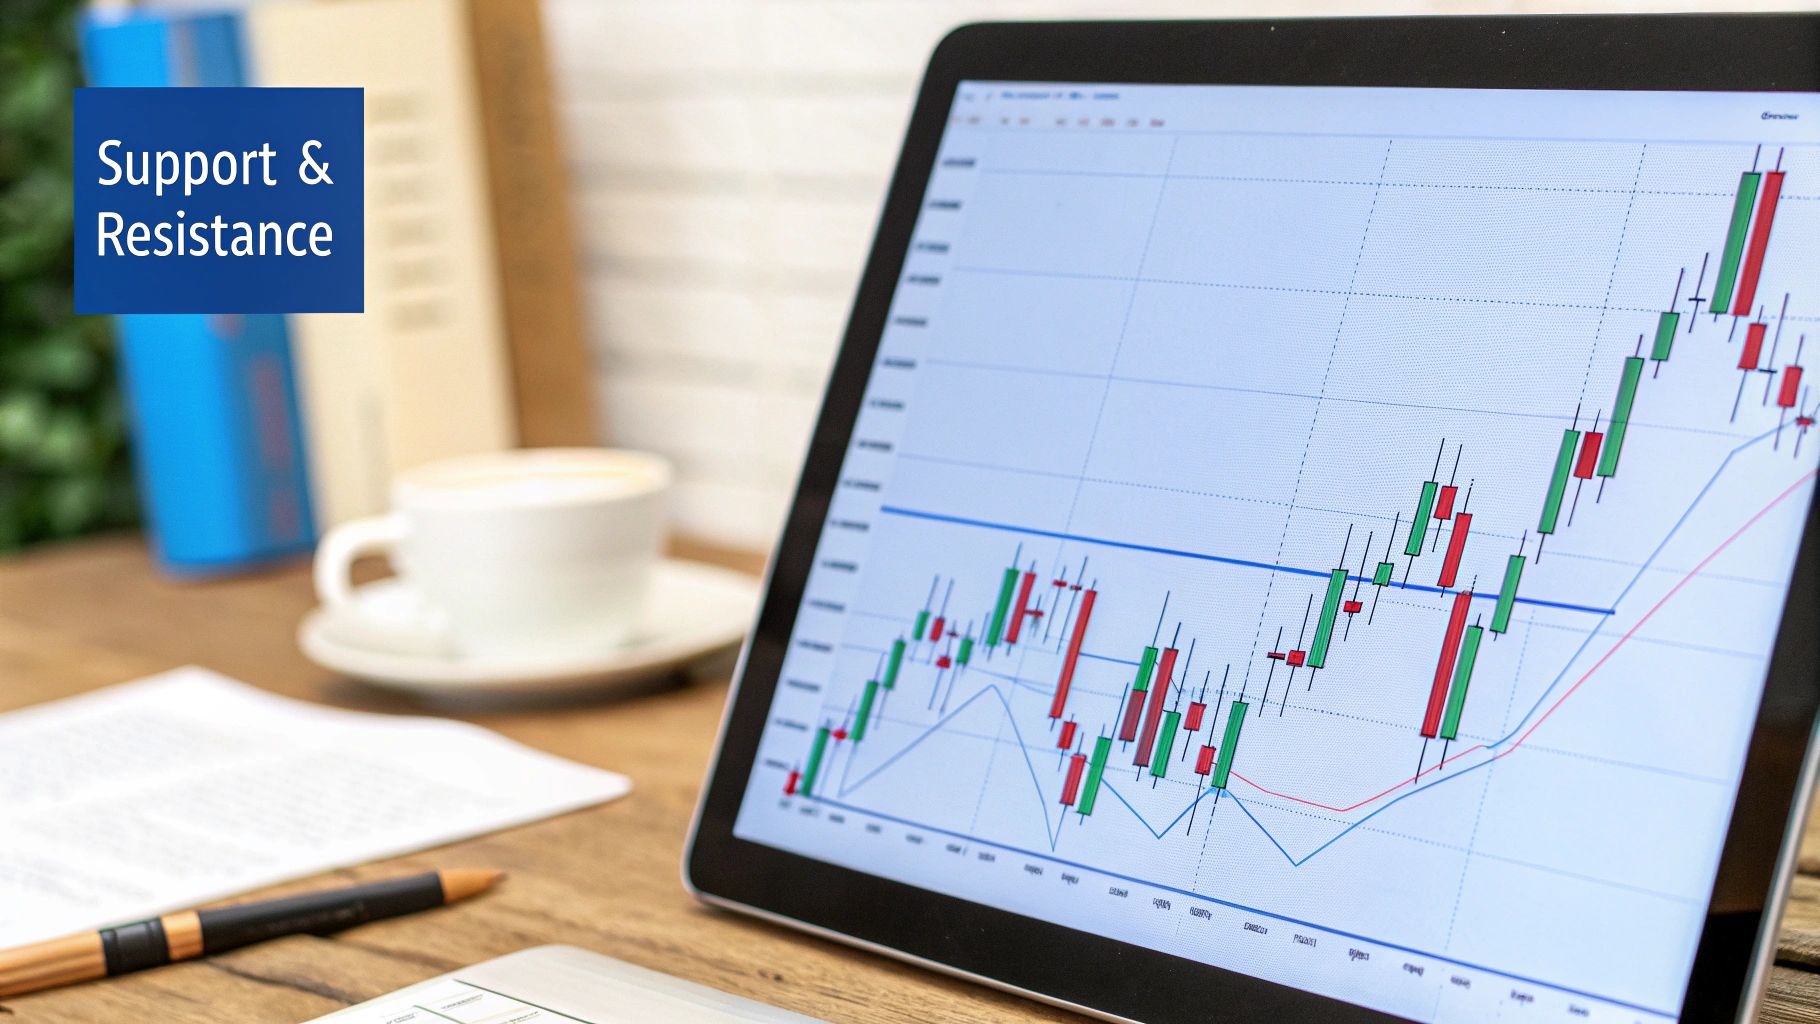
The support and resistance stop loss is a technically-driven strategy that aligns your risk management with the market's own structure. Instead of using an arbitrary percentage, this method involves placing your stop loss order just below a key support level for a long position, or just above a key resistance level for a short position. This approach is rooted in the principles of technical analysis, popularized by pioneers like Charles Dow and Jesse Livermore, and operates on the premise that these levels represent significant psychological and historical price points where buying or selling pressure is likely to emerge.
For example, if a stock has consistently found buyers and bounced off the $50 mark (a support level), and you enter a long position at $52, you would place your stop loss slightly below $50, perhaps at $49.50. The rationale is clear: a decisive break below this established support level would invalidate your trading thesis, signaling a fundamental shift in market sentiment and providing a logical exit point. This makes it one of the most context-aware stop loss strategies available.
Why It's a Go-To Strategy
The core strength of this strategy lies in its logic. It bases your exit on market behavior rather than a fixed, arbitrary number. When a strong support level breaks, it often signifies that the underlying supply and demand dynamics have changed, making it a powerful confirmation that your trade idea is no longer valid. However, its main challenge is the risk of "false breakouts" or "stop hunts," where the price briefly dips below support to trigger stop orders before reversing higher. This requires careful placement and a bit of a buffer.
Practical Implementation & Actionable Tips
Effectively using support and resistance requires more than just drawing lines on a chart. To master this technique, consider the following:
- Add a Buffer: Never place your stop exactly on the support or resistance line. Always add a small cushion (e.g., a few cents, ticks, or a fraction of the Average True Range) below support or above resistance. This helps you avoid getting stopped out by minor noise or false breaks.
- Confirm Level Strength: Not all support and resistance levels are created equal. Look for levels that have been tested multiple times, have significant volume traded around them, or align across multiple timeframes. These confluence zones represent much stronger barriers. You can discover more about trading these key levels on chartswatcher.com.
- Use Dynamic Levels: Don't limit yourself to static horizontal lines. Moving averages (like the 50-day or 200-day) and trendlines act as powerful dynamic support and resistance levels that adjust as the price evolves, providing relevant exit points in a trending market.
5. The Volatility-Based Stop Loss – Adapting to Market Mood
The volatility-based stop loss is an advanced strategy that tailors your risk to the market's current character. Instead of a static percentage or dollar amount, this method adjusts your stop loss distance based on an asset's recent price fluctuations. The core idea is simple: in calm, low-volatility markets, a tighter stop is appropriate, while in choppy, high-volatility markets, a wider stop is necessary to avoid being prematurely shaken out of a good position by normal market noise. This dynamic approach is one of the more sophisticated stop loss strategies available.
For instance, a popular method involves placing a stop loss a certain number of standard deviations away from a moving average. Another common application, popularized by John Bollinger, is to use the Bollinger Bands as a guide. A trader might place a stop loss order just outside the lower band for a long position, allowing the trade room to breathe within its typical volatility range. When volatility contracts and the bands tighten, the stop loss moves closer; when volatility expands and the bands widen, the stop loss gives the trade more space.
Why It's a Go-To Strategy
This strategy's primary strength is its adaptability. It respects the unique personality and current behavior of an asset, preventing the common problem of using a one-size-fits-all stop loss in a market that is constantly changing. A fixed 5% stop might be perfect one week but far too restrictive the next if a news event causes volatility to spike. By linking your stop to volatility, you are inherently linking your risk management to the market's real-time conditions.
The downside is its complexity. It requires a deeper understanding of volatility indicators like Bollinger Bands, the Average True Range (ATR), or the VIX. For new traders, calculating and managing these dynamic stops can be more challenging than setting a simple fixed percentage.
Practical Implementation & Actionable Tips
To effectively use volatility in your stop loss strategies, you need to go beyond the basics. Consider these tips:
- Master the ATR: The Average True Range (ATR) is a workhorse indicator for this. A common technique is to set your stop loss at 2x or 3x the current ATR value below your entry price. For example, if a stock's ATR is $1.50, a 2x ATR stop would be placed $3.00 below your entry.
- Backtest Your Multiplier: The key is finding the right ATR multiplier (e.g., 1.5x, 2x, 2.5x). Use a platform with robust backtesting tools to see which multiplier would have best protected your capital on a specific asset without choking off winning trades.
- Set a Max Loss Ceiling: A volatility-based stop can become dangerously wide during extreme market panics. Always combine it with a maximum loss rule. For example, use a 2x ATR stop, but never let it exceed 10% of your position's value, protecting you from catastrophic black swan events.
6. Strategy 6: The Time-Based Stop Loss – When Price Isn't the Point
Most stop loss strategies focus exclusively on price, but what if the most valuable resource you're risking isn't just capital, but also time? The time-based stop loss introduces a different dimension to risk management, exiting a position after a predetermined period has elapsed, regardless of its profit or loss. This strategy is built on the premise that a good trade should work relatively quickly; if it doesn't, the opportunity cost of having capital tied up in a stagnant position becomes too high.
For instance, a day trader might implement a rule to close all open positions at 3:55 PM EST, five minutes before the market closes, to avoid overnight risk. Similarly, a swing trader might exit a trade if it hasn’t reached a certain profit target within 10 trading days, concluding that the initial bullish thesis has failed to materialize. This approach prevents capital from being locked in "dead money" trades that go nowhere, freeing it up for more promising opportunities.
Why It's a Go-To Strategy
The core advantage of a time-based stop is its focus on capital efficiency. It acknowledges that holding a sideways-moving asset is a form of loss, an "opportunity loss." This makes it invaluable for short-term and mean-reversion systems where timing is critical. However, its major drawback is that it completely ignores price action and technical levels. A position might be on the verge of a significant breakout just as the time limit expires, forcing a premature exit right before the move you anticipated. It works best when combined with other stop loss strategies.
Practical Implementation & Actionable Tips
Effectively using a time-based exit requires aligning your holding period with your trading strategy's goals. Consider these tips:
- Combine with Price Stops: A time-based stop should not be your only safety net. Use it in conjunction with a price-based stop (like a volatility or technical stop) to create a comprehensive risk management plan that protects you from both adverse price moves and trade stagnation.
- Align Timeframes to Strategy: Your holding period must match your trading style. A scalper's time stop might be measured in minutes, while a swing trader’s could be several days or weeks. A long-term options trader might use a time stop to exit positions 30 days before expiration to avoid severe time decay (theta) risk.
- Backtest Your Holding Periods: Use a platform with robust backtesting capabilities to analyze the optimal holding duration for your strategy and chosen asset. You might discover that most of your profitable trades on a particular stock play out within five days, making that an ideal time stop.
7. Money Management Stop Loss – Prioritizing Capital Above All
The Money Management Stop Loss is less of a technical indicator and more of a complete risk management philosophy. Instead of basing the stop on chart patterns or volatility, this strategy sets the stop loss based on a predetermined dollar amount or percentage of your total trading capital you are willing to lose on a single trade. It shifts the focus from the individual stock's behavior to the overarching goal of capital preservation, a principle heavily advocated by experts like Van Tharp. This is one of the most critical stop loss strategies for long-term survival in the markets.
For example, a trader with a $100,000 account adhering to the 1% rule will risk no more than $1,000 on any given trade. If they buy a stock at $50, the distance to their stop loss will determine their position size ($1,000 risk / (entry price - stop price) = number of shares). This method ensures that risk exposure is consistent across all trades, regardless of the asset's price or volatility, making it a cornerstone of professional portfolio management.
This infographic outlines a simple decision tree for determining your personal risk percentage, a crucial first step in applying this strategy.
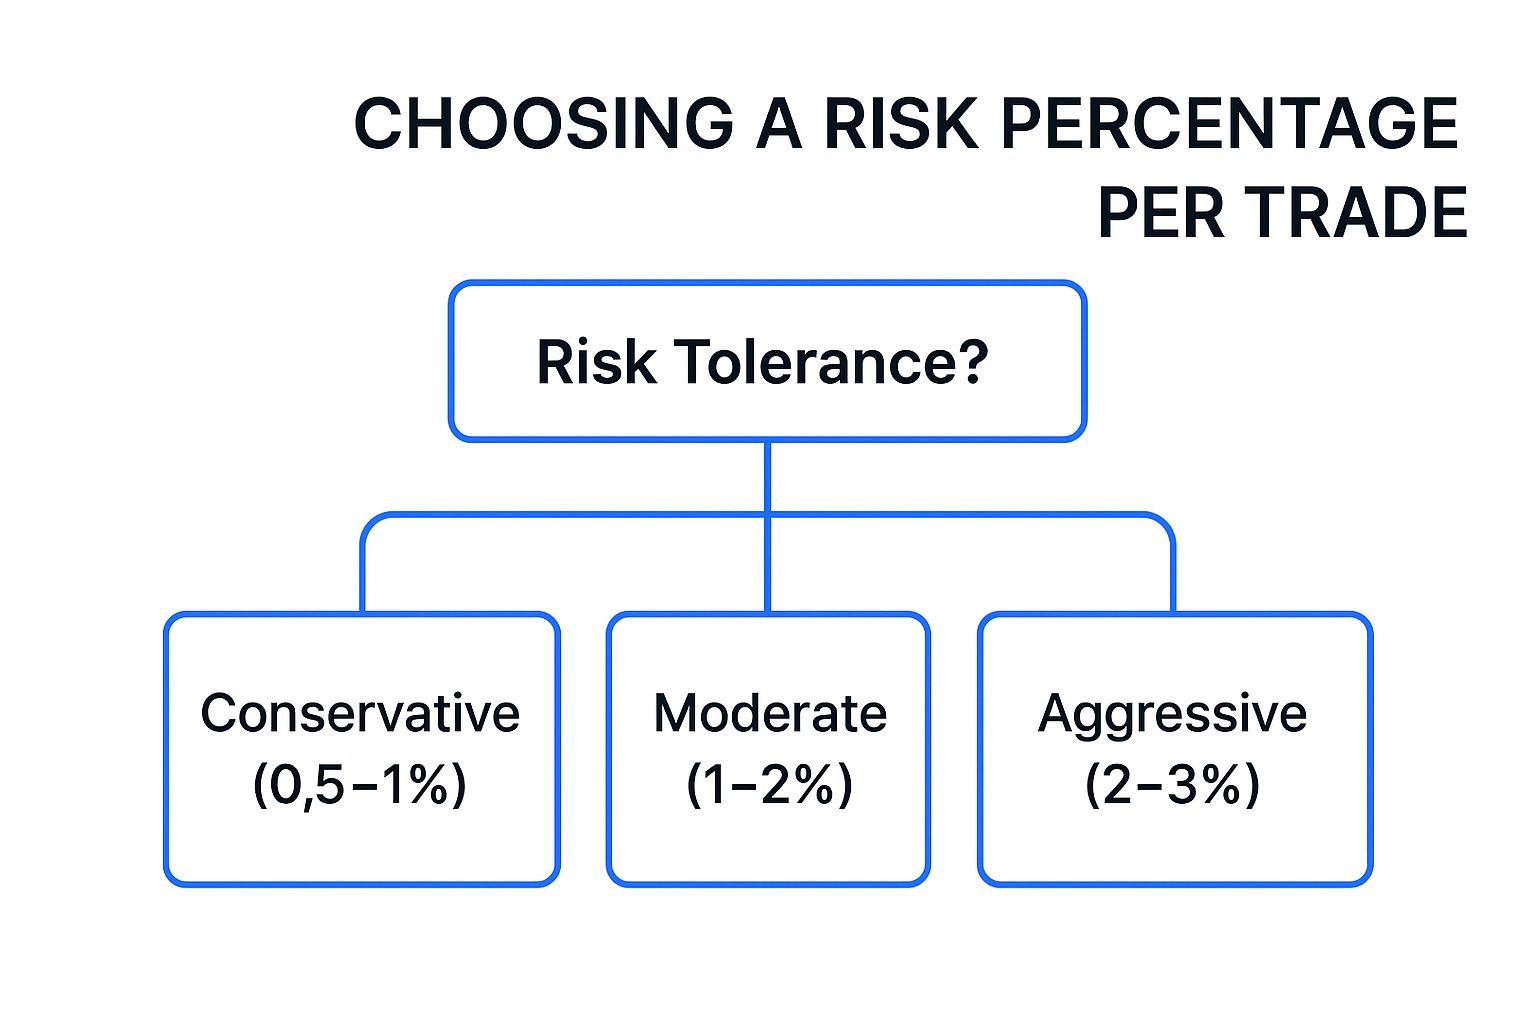 By evaluating your personal risk tolerance, you can select a risk percentage that aligns with your trading style and financial goals, ensuring a disciplined approach.
Why It's a Go-To Strategy
Its primary advantage is its power to enforce unwavering discipline and ensure longevity. By defining risk in terms of your total portfolio, you prevent any single trade from inflicting catastrophic damage. This method is exceptionally scalable and objective. However, its main challenge is that it requires a two-step calculation (first risk amount, then position size), which can feel less intuitive than simply picking a price level on a chart. It also disconnects the stop from the asset's specific technical context, meaning a stop might be placed at an arbitrary level that doesn't align with a support or resistance zone.
Practical Implementation & Actionable Tips
Mastering this strategy is about connecting your risk rule to your trade execution. In line with managing risk based on dollars, some investors find utility in advanced AI-powered money management apps that can assist in setting precise stop loss levels.
- Start with the 1% Rule: If you are new to trading, risking just 1% of your account per trade is a safe standard. Experienced traders with a proven strategy might increase this to 2%, but rarely more.
- Calculate Position Size Correctly: The core formula is: Position Size = Risk Amount / (Entry Price - Stop Price). First, determine where your technical stop should be (e.g., below a support level), then use this formula to calculate how many shares you can buy to honor your dollar-risk limit.
- Account for Correlation: If you open multiple positions in the same sector (e.g., several tech stocks), their outcomes may be correlated. Consider your total risk across these positions, not just on each individual one. You can learn more by exploring various risk management frameworks on chartswatcher.com.
Stop Loss Strategies Comparison Matrix
| Stop Loss Strategy | Implementation Complexity 🔄 | Resource Requirements ⚡ | Expected Outcomes 📊 | Ideal Use Cases 💡 | Key Advantages ⭐ |
|---|---|---|---|---|---|
| Fixed Percentage Stop Loss | Low - simple calculation and setup | Minimal - no special tools needed | Consistent exits at set % loss; removes emotions | Beginners, systematic trading, volatile assets | Easy to implement, consistent risk control |
| Trailing Stop Loss | Moderate - needs dynamic adjustment | Moderate - needs platform support | Locks profits by adjusting stop upward in trending markets | Trending markets, momentum stocks | Maximizes gains, requires less monitoring |
| ATR-Based Stop Loss | High - requires ATR indicator calculation | Moderate - technical tools needed | Adjusts stops based on volatility; adaptive risk management | Swing/day trading, variable volatility | Volatility-adaptive, reduces false signals |
| Support and Resistance Stop Loss | Moderate - requires chart reading skills | Low to Moderate - technical analysis tools | Stops placed at logical market structure points | Traders using technical analysis | Aligns with market structure, better risk-reward |
| Volatility-Based Stop Loss | High - requires advanced volatility metrics | High - programming or advanced software | Dynamically adjusts stop distances to current volatility | Professional traders, quantitative funds | Adapts automatically, reduces overtrading |
| Time-Based Stop Loss | Low - simple to track elapsed time | Minimal - time tracking only | Exits positions after fixed time regardless of price | Day trading, mean reversion, high turnover | Prevents capital lockup, reduces emotional bias |
| Money Management Stop Loss | Moderate - requires risk and position size calculation | Minimal - portfolio and price data | Consistent risk exposure per trade, capital preservation | All traders emphasizing risk control | Controls risk per trade, disciplined approach |
From Theory to Execution: Building Your Personal Stop Loss Framework
Navigating the complexities of the financial markets without a well-defined exit plan is like sailing in a storm without a rudder. Throughout this guide, we have journeyed through a comprehensive suite of stop loss strategies, moving from foundational concepts like the Fixed Percentage Stop to more dynamic, market-responsive methods such as ATR-Based and Support and Resistance Stops. We've seen how each technique offers a unique lens through which to view and manage risk, whether it’s the systematic profit-locking of a Trailing Stop or the discipline imposed by a Time-Based Stop.
The crucial takeaway is that a one-size-fits-all approach to risk management is a fallacy. The most successful traders don't just pick one strategy; they build a personalized, adaptive framework. Your trading style, risk tolerance, and the unique personality of the assets you trade should dictate your approach. A volatile tech stock may demand a wider, volatility-based stop, while a slow-moving blue-chip stock might be better served by a stop placed neatly below a key support level. To truly build a robust personal stop loss framework, it's essential to first understand overall market dynamics and master stock market investing strategies.
Actionable Steps to Forge Your Framework
So, how do you move from theoretical knowledge to practical execution? The process is methodical and data-driven.
- Select and Master: Start by choosing one or two strategies that resonate with your trading philosophy. If you are a technical, chart-based trader, begin with Support and Resistance or ATR-Based stops. If you are more of a systems trader, the Trailing Stop or Money Management Stop might be your ideal starting point.
- Backtest Rigorously: This is the non-negotiable step. Before risking a single dollar, use a powerful backtesting tool to validate your chosen strategy against historical data for the specific assets you trade. Ask critical questions: Does a 1.5x ATR stop outperform a 2.5x ATR stop? How does a 2% trailing stop compare to a fixed stop at a previous swing low? The data will reveal what works and what doesn't, removing guesswork and emotion from the equation.
- Combine and Refine: The pinnacle of risk management is the intelligent combination of these techniques. You might initiate a trade with a stop loss based on a key support level, while ensuring your position size adheres to the 1% money management rule. Once the trade moves in your favor, you could then transition to an ATR-based trailing stop to protect profits while giving the trade room to grow. This multi-layered approach transforms risk from a source of anxiety into a calculated and controlled variable.
Ultimately, mastering these stop loss strategies is what separates amateur traders from disciplined professionals. It is the bedrock of longevity in the markets, providing the capital preservation necessary to stay in the game long enough to capitalize on your winning strategies.
Ready to move from theory to practice and see which stop loss strategies work best for your system? Start backtesting your ideas with precision and ease using ChartsWatcher. Our platform is built to help you rigorously test, refine, and deploy your custom trading rules, turning data-driven insights into a competitive edge.
