2025's Top Stock Market Analysis Tools
Unlocking Market Insights: Your Guide to the Best Stock Analysis Tools
Navigating the complexities of the stock market requires powerful tools. This listicle provides a curated list of the top 10 stock market analysis tools for 2025, designed to help professional traders, analysts, and investors make informed decisions. Quickly compare leading platforms like ChartsWatcher, TradingView, and Bloomberg Terminal, among others, to find the best fit for your needs. Discover which tools offer real-time data, advanced charting, fundamental analysis, and more, empowering you to overcome market challenges and refine your investment strategy. This guide gets you to the insights you need – fast.
1. ChartsWatcher
ChartsWatcher is a powerful stock market analysis tool geared towards professional traders, financial institutions, and serious independent investors seeking a competitive edge. This sophisticated software offers highly customizable dashboards and dynamic tiles, including alerts, top lists, charts, news feeds, and watch lists, all synchronized with real-time market data. This means you can monitor multiple aspects of the market simultaneously, keeping your finger on the pulse of potential opportunities and risks. For those involved in day trading or actively managing portfolios, having this real-time data is crucial for making quick, informed decisions. Whether you're a stock market analyst at a major firm or an individual investor building your own portfolio, ChartsWatcher provides the tools to enhance your stock market analysis.
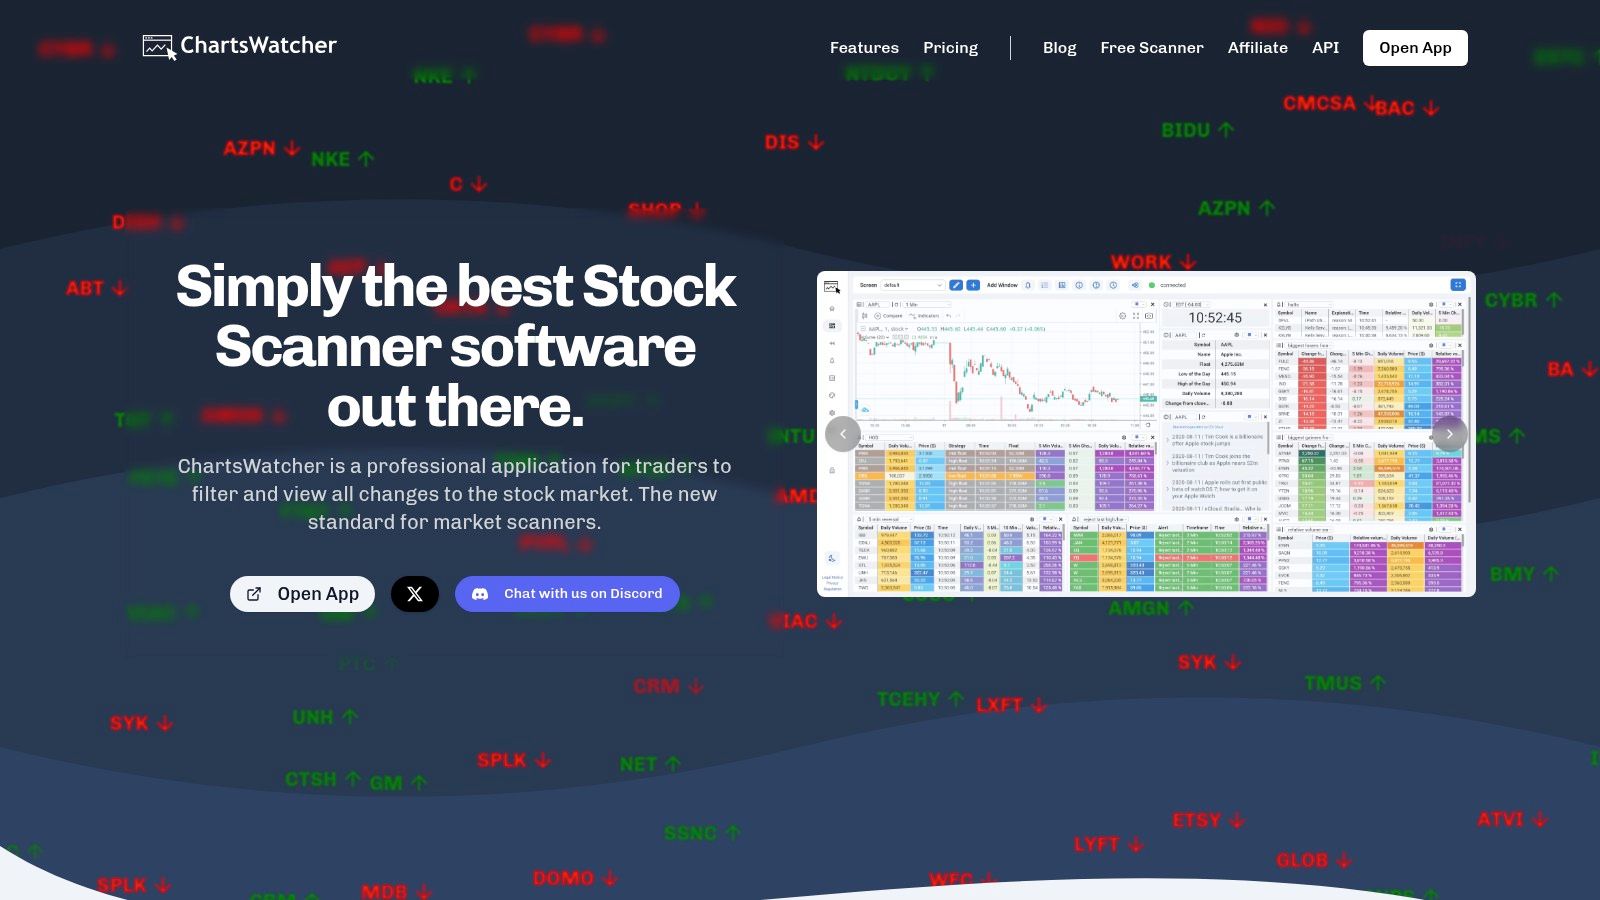
Its intuitive drag-and-drop interface allows for complete personalization of your workspace. You can configure windows precisely how you want them, choose custom color schemes for better visualization, and create advanced alert filters to pinpoint specific market movements. The platform excels in its alert functionality, allowing users to set highly granular criteria for notifications, ensuring they never miss a critical market shift. If you're a stock trading educator, demonstrating these advanced features to your students can significantly enhance their understanding of market analysis. While similar tools like TradingView or Finviz offer charting and screening capabilities, ChartsWatcher's emphasis on customization and dynamic, real-time data sets it apart. Learn more about ChartsWatcher and explore how technical analysis complements this platform's functionalities.
One of ChartsWatcher's standout features is its robust backtesting capability. This allows users to test their trading strategies against historical data, optimizing their approach and mitigating potential risks before deploying real capital. This feature is particularly valuable for those developing algorithmic trading strategies or refining existing ones. Developed in Germany, the platform boasts high reliability and a professional-grade design. ChartsWatcher offers flexible pricing plans, ranging from a free basic option, which provides a good starting point for familiarizing yourself with the interface, to a comprehensive Pro Plan that unlocks the full potential of its advanced features. While there is a steeper learning curve for traders new to advanced scanning tools, the potential rewards in terms of market insight and trading efficiency make the effort worthwhile. The advanced features, which require higher subscription tiers, provide access to more sophisticated filtering, alerting, and backtesting capabilities. Therefore, consider your specific needs and budget when selecting a plan. ChartsWatcher earns its place on this list due to its unique blend of cutting-edge technology, real-time analytics, and unparalleled customizability, all essential components for successful stock market analysis.
2. TradingView
TradingView is a powerhouse among stock market analysis tools, offering a comprehensive platform that caters to both beginners and seasoned professionals. Its popularity stems from the potent combination of advanced charting capabilities, a vast array of technical indicators, and a vibrant social networking aspect. Whether you're a day trader looking for real-time data and quick analysis or a long-term investor performing in-depth fundamental research, TradingView provides the tools to support your stock market analysis. It truly stands out as an all-in-one solution for analyzing various markets, including stocks, forex, cryptocurrencies, and commodities. This makes it particularly useful for traders operating across multiple asset classes.
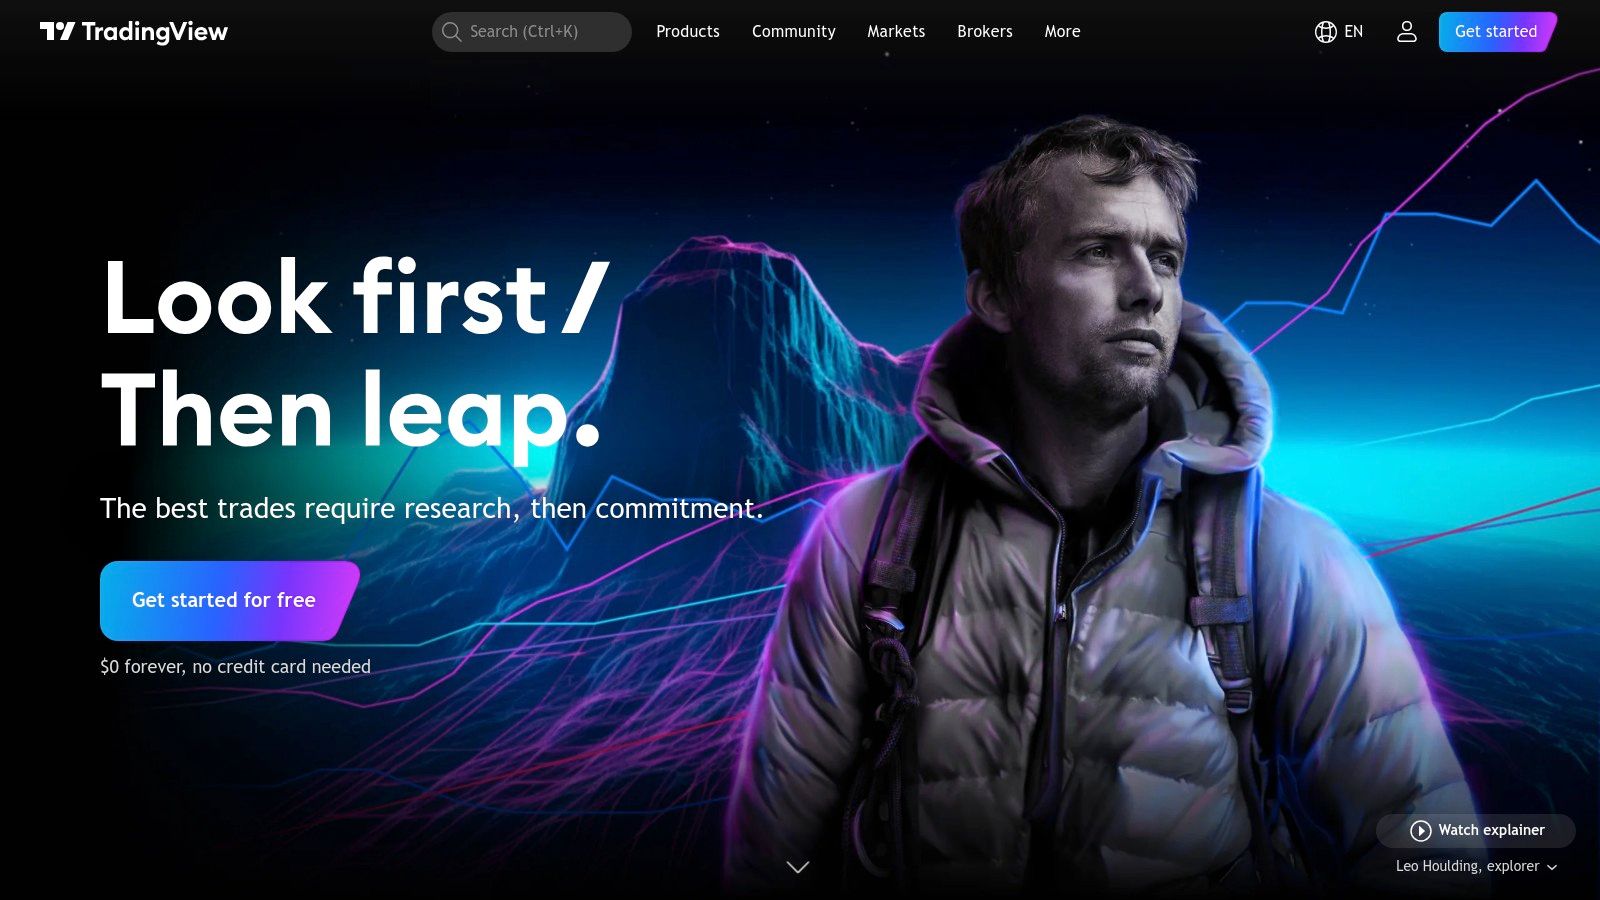
One of TradingView's core strengths lies in its charting functionality. With over 100 pre-built technical indicators and drawing tools, traders can perform detailed technical analysis directly on the charts. Beyond the pre-built indicators, TradingView allows users to create their own custom indicators using Pine Script, a proprietary programming language. This opens up a world of possibilities for experienced traders who want to develop and test their own unique trading strategies. For those new to charting, the intuitive interface makes it easy to get started, while the Learn more about TradingView resources and active community provide ample learning opportunities. Furthermore, TradingView's stock screener allows users to filter stocks based on a wide range of criteria, including technical indicators, fundamental data, and performance metrics. This feature is invaluable for quickly identifying potential investment opportunities that align with specific trading strategies. The social networking aspect of TradingView differentiates it from many other stock market analysis tools. Traders can share their trading ideas, follow experienced investors, and participate in discussions, fostering a collaborative learning environment. This feature is particularly beneficial for new traders looking to learn from experienced professionals.
TradingView offers a tiered subscription model. The free tier provides access to basic charting tools, a limited number of indicators, and real-time data for many global markets. However, access to advanced features like custom indicators, more indicators, and saved chart layouts requires a paid subscription. While the free version is a great starting point, professional traders will likely find the advanced features offered in the paid versions to be well worth the investment. TradingView is accessible through a web browser, desktop application, and mobile app, providing flexibility for traders on the go. However, the platform can be resource-intensive, particularly when using multiple charts with many indicators, so a computer with decent processing power is recommended for a smooth experience. The limited historical data available in the free version might be a drawback for long-term investors or those backtesting complex strategies. Additionally, learning Pine Script for creating custom indicators can be challenging for those without programming experience.
In conclusion, TradingView earns its place on this list due to its comprehensive features, user-friendly interface, and vibrant community. It’s an invaluable resource for stock market analysis, catering to a diverse audience, from beginner investors to seasoned professional traders, stock market analysts, financial institutions, independent investors, stock trading educators, and those utilizing stock screeners and scanners, especially for day trading.
3. Bloomberg Terminal
The Bloomberg Terminal is often considered the gold standard of stock market analysis tools, earning its place on this list due to its unparalleled breadth and depth of data. While other platforms offer pieces of the puzzle, the Bloomberg Terminal aims to provide the entire picture, making it a powerhouse for professional traders, stock market analysts, financial institutions, and serious independent investors. If you're looking for the most comprehensive suite of tools for analyzing the stock market, this is it. However, it comes at a premium price, making it less suitable for casual investors or those on a tight budget.
This platform goes far beyond basic stock screening and charting. It delivers real-time market data for virtually all global markets and asset classes, from equities and fixed income to commodities and foreign exchange. Think of it as a central nervous system for the financial world, connecting you to a live stream of information that can inform your trading decisions. For example, imagine needing to quickly analyze the impact of a breaking news event on a specific sector. With the Bloomberg Terminal, you can access the news, related company data, historical performance charts, and analyst estimates all within a unified platform, allowing for rapid and informed decision-making.
Beyond raw data, the Bloomberg Terminal offers advanced analytics and proprietary financial models that can significantly enhance your stock market analysis. These tools can help you identify trends, evaluate risk, perform complex valuations, and backtest trading strategies. For stock scanners and day traders looking for an edge, this level of analytical depth can be invaluable. Stock trading educators can also leverage the platform's vast resources to provide real-world examples and case studies.
Key Features and Benefits:
- Real-Time Market Data: Access up-to-the-second information on virtually any security, globally. This real-time data feed is crucial for day trading and other strategies where split-second decisions matter.
- Advanced Analytics & Proprietary Models: Utilize sophisticated tools to delve deeper into market trends, company performance, and portfolio risk. This includes access to Bloomberg's proprietary models and research.
- Bloomberg News and Research: Stay informed with breaking news, in-depth analysis, and research reports from a globally recognized news organization and thousands of other sources.
- BLAST (Bloomberg Launchpad Application System Technology): Customize your workspace to track the specific data points and news feeds that are most relevant to your stock market analysis.
- Messaging System: Connect and communicate with a network of over 325,000 finance professionals, fostering collaboration and information sharing. This built-in network can provide valuable insights and market perspectives.
Pros:
- Most Comprehensive Financial Data: Unrivaled breadth and depth of information.
- Industry Standard: Used by professionals worldwide, demonstrating its credibility and power.
- Robust Analytic Capabilities: Tools and models to support sophisticated analysis.
- Dedicated Customer Support and Training: Assistance to help you navigate the platform's complexities.
Cons:
- Extremely Expensive: Approximately $24,000/year per terminal, making it inaccessible for most individual investors.
- Steep Learning Curve: Mastering the terminal takes time and effort due to its extensive functionality.
- Requires Dedicated Hardware: Not a cloud-based solution, requiring specialized terminals.
- Overkill for Individual Retail Investors: The vast majority of features are geared towards institutional investors and professionals.
In conclusion, the Bloomberg Terminal is an incredibly powerful stock market analysis tool offering an unmatched level of data and analytics. While the cost is prohibitive for most individual investors, its features and capabilities make it an essential tool for serious professional traders, analysts, and financial institutions. Its inclusion in this list is a testament to its position as a leader in the financial data and analytics space.
4. MetaStock: A Powerful Stock Market Analysis Tool for Serious Traders
MetaStock is a comprehensive technical analysis software meticulously designed for professional traders, investors, and financial institutions seeking advanced charting, backtesting, and automation capabilities. With a legacy spanning over 35 years, MetaStock has earned a reputation for its robust analytics and highly customizable features, making it a top choice for serious technical traders. This platform empowers users to delve deep into market data, develop complex trading systems, and rigorously backtest strategies before deployment, making it a valuable asset for navigating the intricacies of the stock market. Whether you're a seasoned trader or a dedicated analyst, MetaStock offers powerful tools to enhance your stock market analysis.
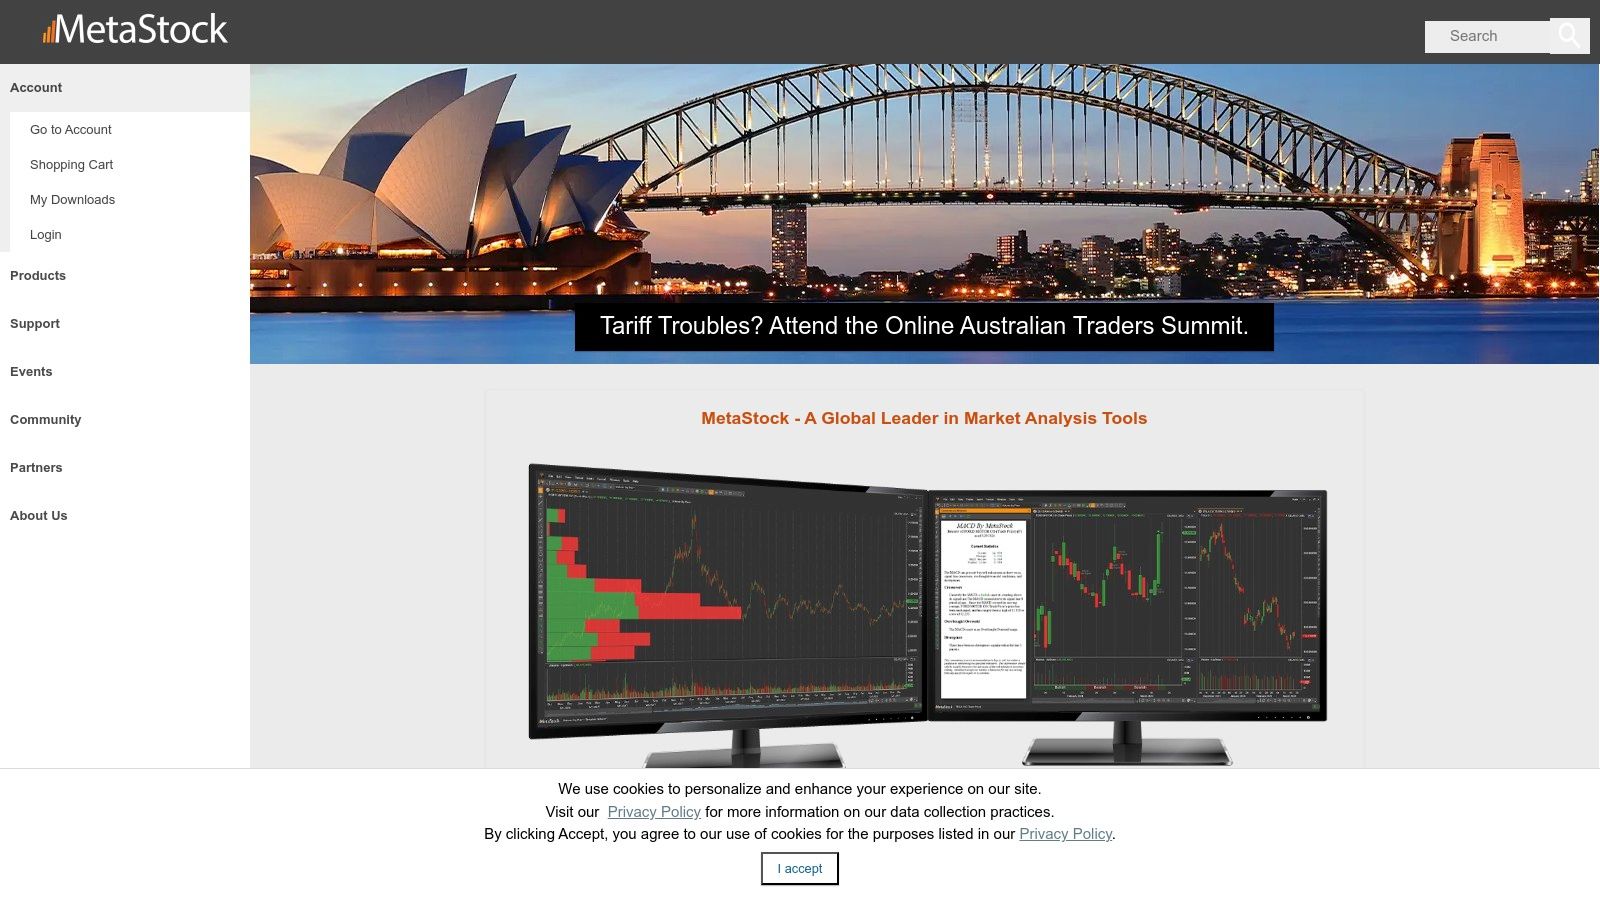
MetaStock caters to a variety of trading styles and experience levels with specialized editions, including MetaStock Daily Charts, MetaStock Real Time, and MetaStock Xenith. The platform's strength lies in its advanced pattern recognition system, which helps traders quickly identify potential trading setups and execute informed decisions. The extensive backtesting and optimization features allow users to simulate trading strategies against historical data, refine their approach, and minimize potential risks. For those looking to refine their systems further, the “The Experts” tool allows for testing against pre-built expert advisor systems. The MetaStock Formula Language (MFL) allows for creating custom indicators and trading systems tailored to specific market conditions and trading preferences, providing a powerful edge for advanced users. This combined with the customizable scanning functionality, helps day traders find opportunities rapidly.
Key Features and Benefits:
- Advanced Pattern Recognition: Automatically identifies chart patterns, candlestick patterns, and other technical formations, saving analysts considerable time and potentially highlighting overlooked opportunities.
- Robust Backtesting Engine: Test and optimize trading systems against historical data, analyzing performance metrics and refining strategies for optimal results. This is crucial for verifying the viability of any trading system.
- Extensive Indicator Library: Access hundreds of pre-built technical indicators, from classic moving averages to complex proprietary indicators, providing a wide range of analytical tools.
- Custom Formula Creation: Design and implement your own indicators and trading systems using the MetaStock Formula Language (MFL), providing ultimate flexibility for experienced traders.
- Customizable Scanning: Create highly specific scans to pinpoint stocks matching pre-defined criteria, optimizing trade identification based on individual parameters. This is particularly valuable for day traders and swing traders needing quick identification of opportunities.
- Specialized Editions: Different versions cater to specific needs, from end-of-day analysis to real-time data and options analysis, ensuring the right tools for various trading styles.
Pros and Cons:
Pros:
- Comprehensive technical analysis capabilities unmatched by many competitors.
- Powerful backtesting and optimization engine for robust strategy verification.
- Large library of pre-built indicators and trading systems.
- Specialized editions to cater to different trading styles (Daytrading, Swing Trading, etc.).
- Customizable scanning and formula creation for highly personalized analysis.
Cons:
- Higher price point compared to some competitors. While pricing isn't publicly listed, it is known to be a premium product. Contact MetaStock directly for pricing information.
- Steeper learning curve for beginners due to the platform's advanced features.
- Desktop-based platform with a less modern interface compared to some web-based alternatives.
- Limited free trial period.
Comparison with Similar Tools:
Compared to platforms like TradingView or TC2000, MetaStock emphasizes advanced backtesting, formula creation, and system development, making it more suitable for serious traders building and verifying complex strategies. While TradingView offers a more modern interface and social features, MetaStock focuses on deep analytical tools. TC2000 provides a strong balance of ease of use and powerful scanning, while MetaStock caters to more complex analysis and system development.
Implementation and Setup Tips:
- Take advantage of the available training resources and tutorials to learn the platform's intricacies.
- Start with a specific trading style or analysis goal to guide your exploration of MetaStock's features.
- Experiment with pre-built indicators and systems before developing your own using MFL.
Website: https://www.metastock.com/
MetaStock deserves its place on this list of stock market analysis tools due to its sophisticated feature set designed for serious traders seeking in-depth technical analysis, robust backtesting, and the ability to create custom indicators and trading systems. While the platform's advanced capabilities may present a learning curve for beginners, the comprehensive functionalities make it a valuable tool for professional traders, stock market analysts, and financial institutions seeking a powerful edge in the market.
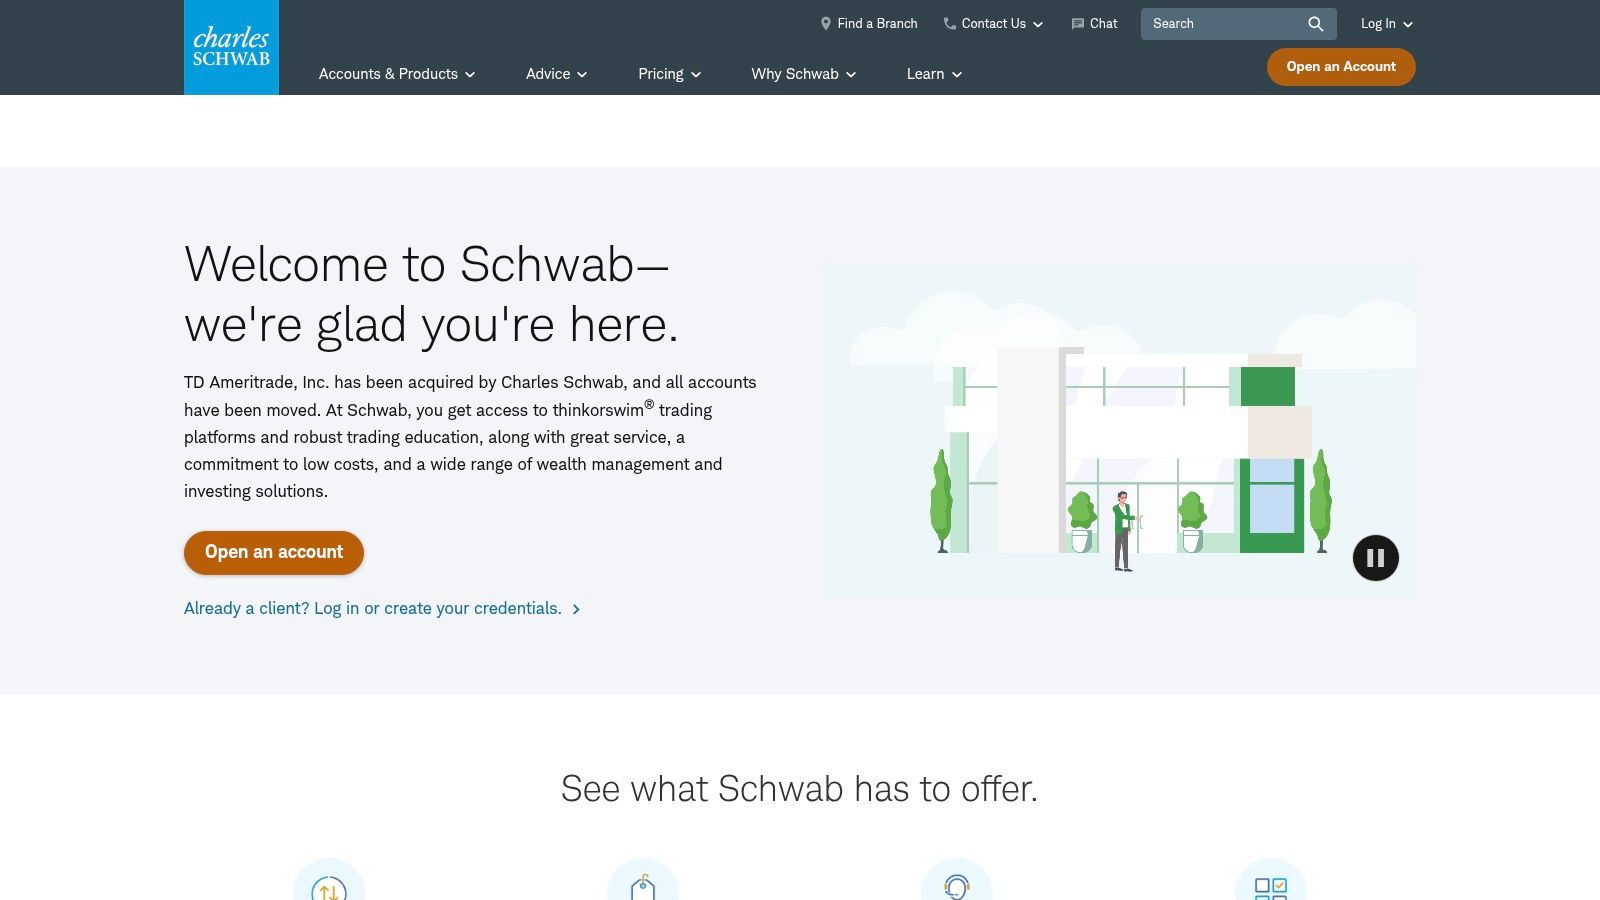
5. Thinkorswim by TD Ameritrade
Thinkorswim by TD Ameritrade is a robust and comprehensive platform widely considered one of the best stock market analysis tools available. It offers a professional-grade suite of features designed for active traders, analysts, and serious investors seeking in-depth market insights. Its powerful capabilities span across multiple asset classes, including stocks, options, futures, and forex, making it a versatile choice for diverse investment strategies. Whether you're a seasoned professional or a dedicated independent investor, Thinkorswim provides the tools to analyze market trends, develop trading strategies, and backtest their performance. Its comprehensive toolkit makes it a stand-out choice for those actively engaged in the stock market.
Thinkorswim stands out with its advanced charting capabilities, offering hundreds of technical indicators and drawing tools to dissect price action and identify potential trading opportunities. The platform's thinkScript programming language allows users to create custom studies and indicators, enabling highly personalized market analysis. For options traders, Thinkorswim offers a particularly robust suite of tools, including probability calculators and complex options strategies analysis. This empowers traders to assess potential risk and reward scenarios with greater precision. Furthermore, the paper trading environment provides a risk-free space to test and refine strategies before deploying them in live markets.
A key advantage of Thinkorswim is its accessibility. It's free to use for TD Ameritrade account holders, with no trade minimums, effectively removing a significant barrier to entry often found with professional-grade platforms. This positions Thinkorswim as an attractive option for both beginners looking to explore advanced tools and experienced traders seeking a comprehensive solution. Compared to other platforms like TradingView or NinjaTrader, Thinkorswim often provides a more integrated experience, especially for those already utilizing TD Ameritrade for brokerage services. However, it's worth noting that Thinkorswim’s extensive feature set can present a steep learning curve for new users.
Key Features & Benefits:
- Advanced Charting: Hundreds of technical indicators and drawing tools for in-depth market analysis.
- thinkScript: Proprietary programming language for creating custom indicators and strategies.
- Robust Options Analysis: Probability calculators and complex options strategies tools.
- Paper Trading: Risk-free environment for strategy backtesting and refinement.
- Advanced Screeners: Filter stocks, options, and futures based on specific criteria.
- Real-time Market Data: Stay up-to-date with the latest market movements.
- Multi-Asset Trading: Trade stocks, options, futures, and forex from a single platform.
Pros:
- Free with a TD Ameritrade account (no minimums).
- Professional-grade tools comparable to expensive standalone platforms.
- Comprehensive educational resources for users of all levels.
- Available on desktop, web, and mobile platforms.
Cons:
- Steep learning curve for beginners.
- Can be resource-intensive on older computers.
- Occasional platform stability issues can occur during periods of high market volatility.
- Some advanced features are only available on the desktop version.
Implementation/Setup Tips:
- Start with the educational resources available within the platform and on the TD Ameritrade website.
- Explore the paper trading environment to familiarize yourself with the platform's features and tools.
- Begin with basic charting and analysis before diving into more complex features like thinkScript.
- Consider utilizing the platform's built-in screeners to identify potential trading opportunities.
Thinkorswim deserves its place on this list of top stock market analysis tools because it offers a potent combination of power and accessibility. Its comprehensive features cater to the needs of both seasoned professionals and aspiring traders. While the learning curve may be challenging initially, the platform’s potential for deep market analysis and strategy development makes it an invaluable tool for anyone serious about succeeding in the stock market. Whether you're a day trader, swing trader, or long-term investor, Thinkorswim provides the tools and resources you need to analyze the market, identify opportunities, and ultimately, achieve your financial goals. For stock scanners and screeners, the advanced filtering capabilities make this a powerful tool for uncovering potential investment candidates. For educators, Thinkorswim provides a professional-grade platform to demonstrate real-world applications of trading principles. For financial institutions, its robust features and data analysis capabilities make it a viable option for research and analysis departments.
6. Stock Rover: Deep Dive Fundamental Analysis for Long-Term Investors
Stock Rover is a robust stock market analysis tool geared towards investors who prioritize fundamental analysis. It provides a comprehensive suite of features for researching, comparing, and managing investment portfolios, making it an excellent choice for those focused on long-term growth. Whether you're a professional trader, financial institution, or an independent investor looking for an edge, Stock Rover offers powerful tools to support your investment decisions. Its focus on in-depth fundamental data and flexible research capabilities sets it apart in the crowded field of stock market analysis tools.
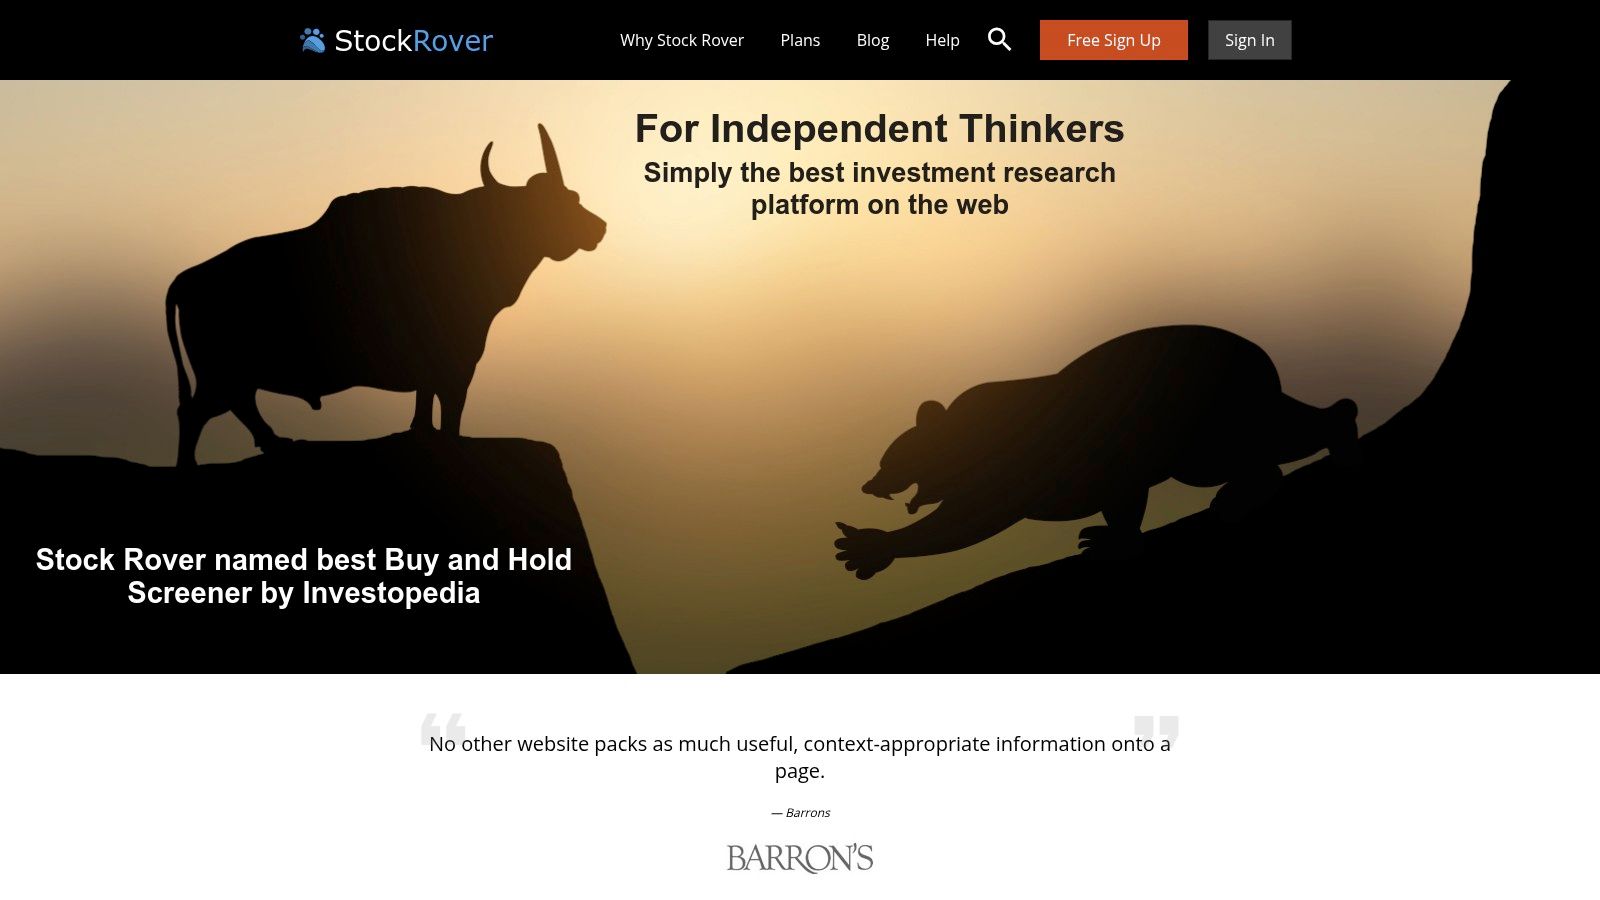
Stock Rover’s strength lies in its deep fundamental analysis capabilities. With access to over 650 metrics and historical data going back more than 10 years, you can thoroughly investigate a company's financial health, performance, and valuation. This includes detailed income statements, balance sheets, cash flow statements, and key ratios. You can build customized research views to focus on the metrics most important to your investment strategy, whether it’s value investing, dividend growth investing, or other long-term approaches. Furthermore, the platform's screening capabilities are exceptional, allowing you to filter thousands of stocks based on your specific criteria, saving you valuable research time. For example, a value investor can quickly screen for companies with low P/E ratios, high dividend yields, and strong balance sheets.
For portfolio management, Stock Rover provides analytics and performance tracking tools to monitor your investments and make informed decisions about rebalancing. The correlation analysis feature helps diversify your portfolio by identifying assets that move independently of each other, reducing overall risk. Research reports generated by the platform offer deep fundamental insights, further supporting informed decision-making. This is particularly beneficial for professional traders and financial institutions that require detailed analysis for their clients.
While Stock Rover shines in fundamental analysis, it's important to be aware of its limitations. It offers less comprehensive technical analysis features compared to platforms specifically designed for day trading or short-term trading strategies. For example, charting tools and real-time data feeds are not as extensive as those found in dedicated trading platforms. Additionally, many of its most valuable features require a premium subscription. Currently, Stock Rover offers three tiers: Essentials, Premium, and Premium Plus, each with varying access to data and features. Pricing details can be found on their website. Finally, Stock Rover is web-based and currently lacks a dedicated mobile app, which may be a drawback for those who prefer mobile access.
Implementation Tips:
- Start with the free trial: This allows you to explore the platform and determine if the premium features align with your needs.
- Customize your research views: Take advantage of the customization options to create views that align with your investment strategy.
- Explore the pre-built screens: Stock Rover offers a variety of pre-built screens for different investment styles, which can be a great starting point.
Comparison to Similar Tools:
Compared to platforms like TradingView or Thinkorswim, which are geared towards technical analysis and active trading, Stock Rover stands out for its depth of fundamental data. While platforms like Simply Wall St offer visual representations of fundamental data, Stock Rover provides a more granular and customizable research experience.
Stock Rover deserves its place on this list of stock market analysis tools due to its robust fundamental analysis capabilities, intuitive interface, and powerful screening tools. While it's not designed for day traders, it offers significant value to long-term investors who prioritize in-depth research and comprehensive portfolio management. To learn more and explore the platform, visit the Stock Rover website: https://www.stockrover.com/
7. Finviz: Visualizing Market Opportunities
Finviz (Financial Visualizations) earns its spot on this list of top stock market analysis tools thanks to its powerful blend of intuitive visualizations, comprehensive screening, and accessible pricing. It’s a valuable resource for both novice investors getting their feet wet and experienced traders looking for quick market insights. Whether you're hunting for undervalued stocks, tracking sector performance, or keeping an eye on insider activity, Finviz offers a robust platform for navigating the complexities of the stock market. Its strength lies in presenting complex data in a digestible format, empowering investors to make more informed decisions.
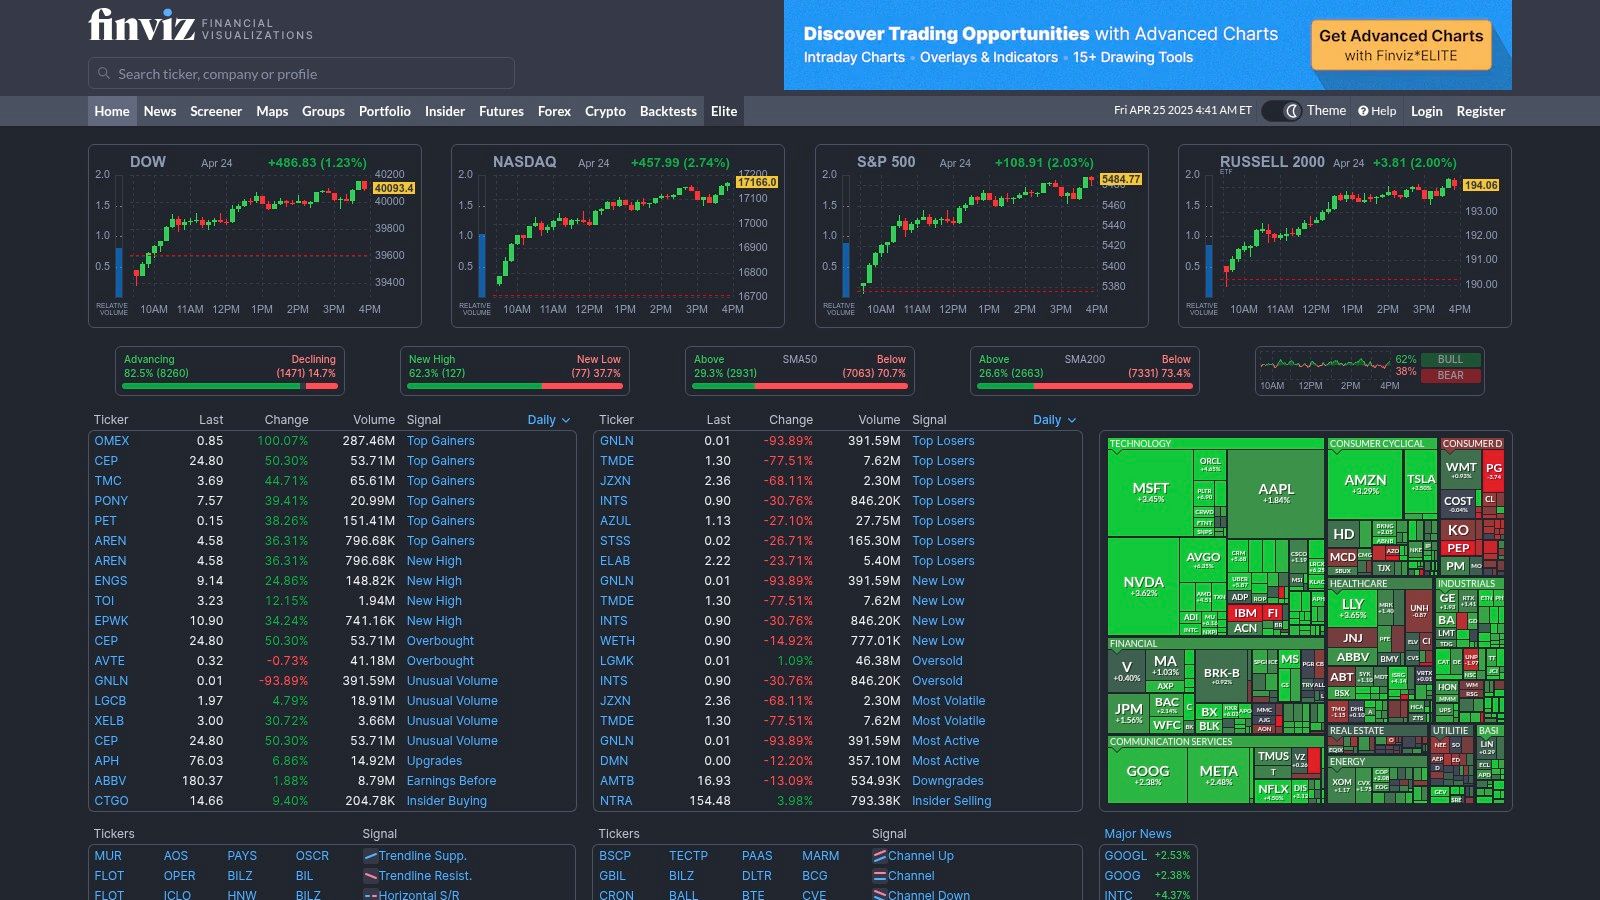
For professional traders, Finviz’s advanced stock screener, with over 60+ filters encompassing both fundamental and technical indicators, provides a highly effective way to identify potential trading opportunities. Imagine you're looking for large-cap technology stocks with a positive price-to-earnings growth ratio and strong relative strength. With Finviz, you can set these criteria within the screener and instantly generate a list of matching stocks, saving hours of manual research. Day traders can also benefit from real-time quotes and customizable charts (with the Elite subscription) to monitor intraday price movements and identify opportune entry and exit points. Stock market analysts within financial institutions can leverage Finviz's market maps to gain a bird's-eye view of sector performance, identifying emerging trends and potential investment hotspots. Furthermore, the insider trading data offers a valuable lens into the sentiment of company insiders, which can be a crucial piece of the puzzle for fundamental analysis.
Independent investors can leverage the free version of Finviz to conduct robust research and develop their investment strategies. The visual market maps are particularly useful for understanding broad market trends and comparing the performance of different sectors and industries. Stock trading educators can incorporate Finviz into their curriculum, showcasing its user-friendly interface and comprehensive features as a valuable tool for stock market analysis. For those looking for a robust stock scanner and screener, Finviz provides a compelling option, offering a wider array of filtering options than many free platforms.
While Finviz offers a generous free version, the Elite subscription unlocks real-time data, backtesting capabilities, and advanced charting features. This premium version is particularly valuable for active traders who rely on up-to-the-second information. The cost of the Elite subscription is $39.50 per month or $299.50 annually. Finviz is accessible via any web browser and does not require any specific technical setup or downloads, making it convenient for users across various devices.
Compared to other stock market analysis tools, Finviz distinguishes itself with its intuitive visual interface and powerful free version. While platforms like TradingView offer more advanced charting capabilities, Finviz focuses on providing a broader overview of the market. For fundamental analysis, specialized tools like Bloomberg Terminal offer deeper data sets, but at a significantly higher price point. Finviz strikes a balance between functionality and affordability, making it an ideal tool for a wide range of investors.
To get started with Finviz, simply visit https://finviz.com/. The interface is self-explanatory, and the screener is highly customizable, allowing you to tailor your searches based on your specific investment criteria. Exploring the various visualization tools, like the market maps and sector performance charts, can offer valuable insights into market dynamics. For those wanting to delve deeper, the Finviz blog and user forum provide helpful tips and tutorials.
8. Morningstar: In-Depth Fundamental Analysis for Long-Term Investors
Morningstar stands out among stock market analysis tools as a premier platform for fundamental analysis and long-term investment research. Unlike tools geared towards short-term trading, Morningstar emphasizes in-depth research, independent ratings, and a wealth of data on stocks, mutual funds, ETFs, and other securities. This makes it a particularly valuable resource for investors focused on building and managing portfolios for long-term growth. Whether you're a professional trader building a diversified portfolio, a financial institution assessing investment opportunities, or an independent investor researching potential investments, Morningstar provides the tools to make informed decisions.
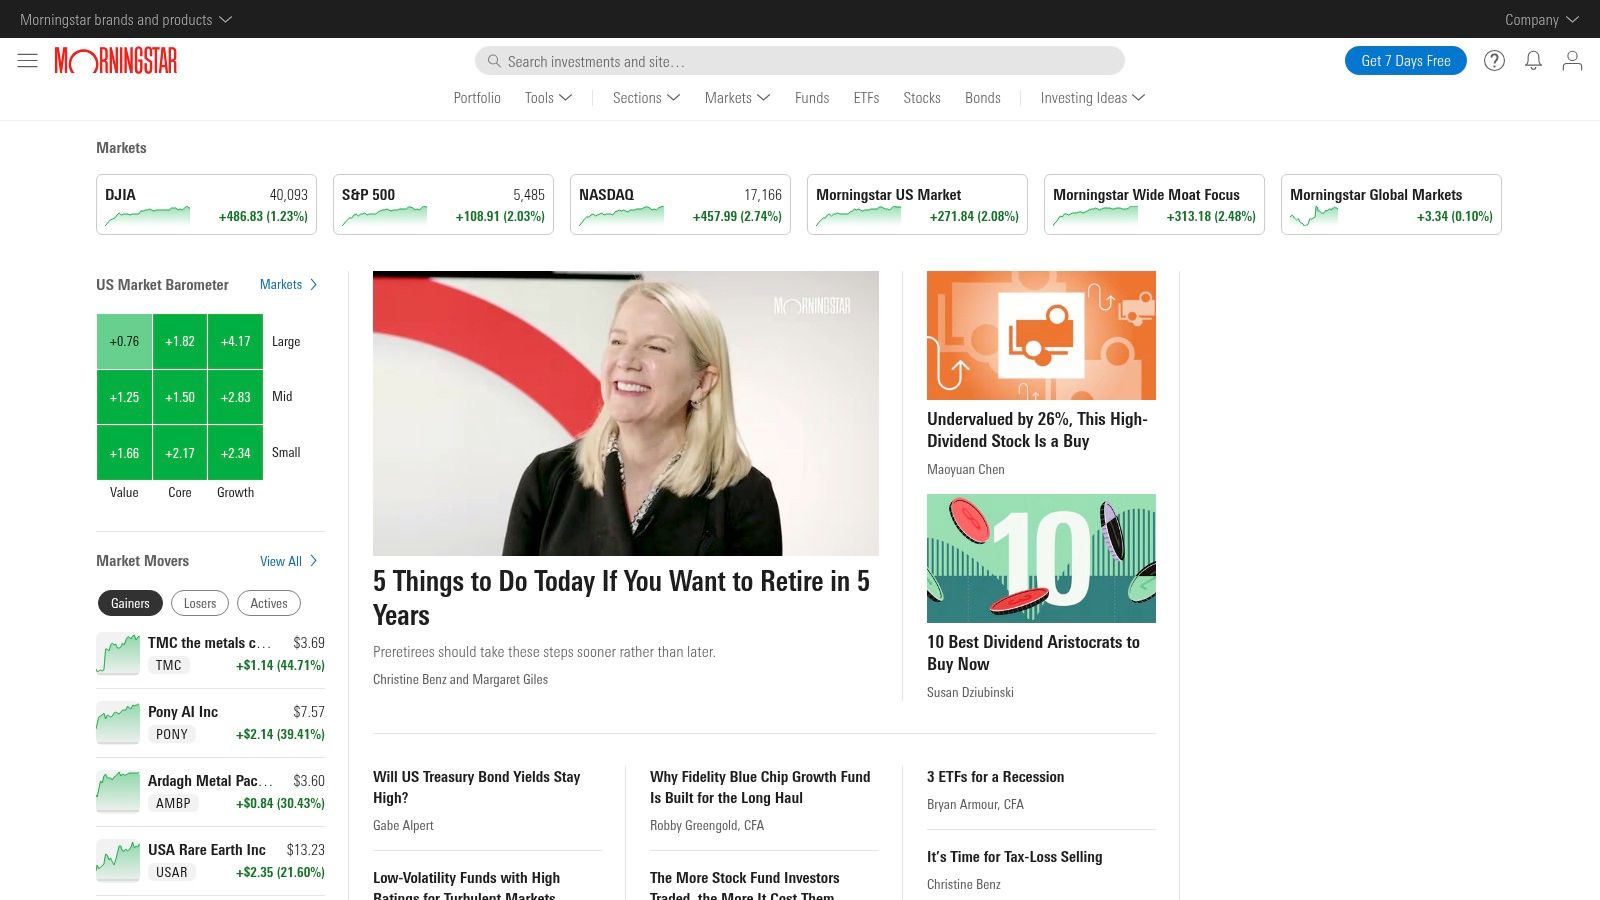
One of Morningstar's key strengths lies in its proprietary research and ratings. Their star rating system for funds and ETFs, based on past performance adjusted for risk, is widely recognized and often used as a starting point for fund selection. Beyond star ratings, Morningstar provides comprehensive analyst reports that offer qualitative assessments of a company's management, competitive advantages, and future prospects. These reports are particularly helpful for understanding the nuances of a business and its potential for long-term success. Furthermore, Morningstar's economic moat rating assesses a company's sustainable competitive advantages, providing crucial insights for long-term investors. They also provide fair value estimates, allowing investors to gauge whether a stock is overvalued or undervalued based on their analysis.
For portfolio management, Morningstar's Portfolio X-Ray tool enables users to analyze their asset allocation, sector weightings, and geographic exposure. This feature helps investors understand their overall portfolio risk and identify potential areas for diversification. The platform also offers robust fund and ETF comparison tools, including detailed expense analysis, making it easy to compare and contrast different investment options. Stock scanners and screeners can leverage Morningstar's data to filter and identify investments that meet specific fundamental criteria.
Implementation and Setup Tips: While the basic version of Morningstar offers some free resources, accessing the most valuable features, including detailed analyst reports, portfolio X-Ray, and advanced charting, requires a Premium subscription. Visit their website (https://www.morningstar.com/) to explore the different subscription options and choose the one that best suits your needs. Once subscribed, take the time to familiarize yourself with the platform’s various tools and features through tutorials and documentation available on the website.
Comparison with Similar Tools: While platforms like Bloomberg Terminal and FactSet offer a broader range of data and tools, including real-time market data and sophisticated technical analysis capabilities, Morningstar differentiates itself with its focus on long-term fundamental analysis and independent research. This specialization makes it a compelling choice for investors who prioritize fundamental analysis and are less concerned with short-term market fluctuations.
Pros:
- Industry-leading fund and ETF research
- Independent analysis with a strong reputation
- Excellent for long-term fundamental investors
- Intuitive portfolio analysis tools
Cons:
- Premium subscription required for most valuable features
- Limited technical analysis capabilities
- Not designed for active traders, day trading, or those seeking real-time stock scanners
- Historical data can be limited compared to specialized platforms
Morningstar earns its place in this list of stock market analysis tools because of its commitment to in-depth fundamental analysis and its focus on empowering long-term investors. While not suited for high-frequency traders, it's an invaluable resource for anyone looking to build a robust portfolio based on solid research and a long-term perspective.
9. eSignal: A Powerhouse for Serious Stock Market Analysis
eSignal is a robust stock market analysis tool designed for active traders and technical analysts who demand professional-grade data and advanced charting capabilities. This platform stands out among stock market analysis tools for its speed, reliability, and depth of market information, making it a favorite among day traders, professional investors, and financial institutions. If you're serious about technical analysis and require real-time data across global markets, eSignal deserves a place in your toolkit.
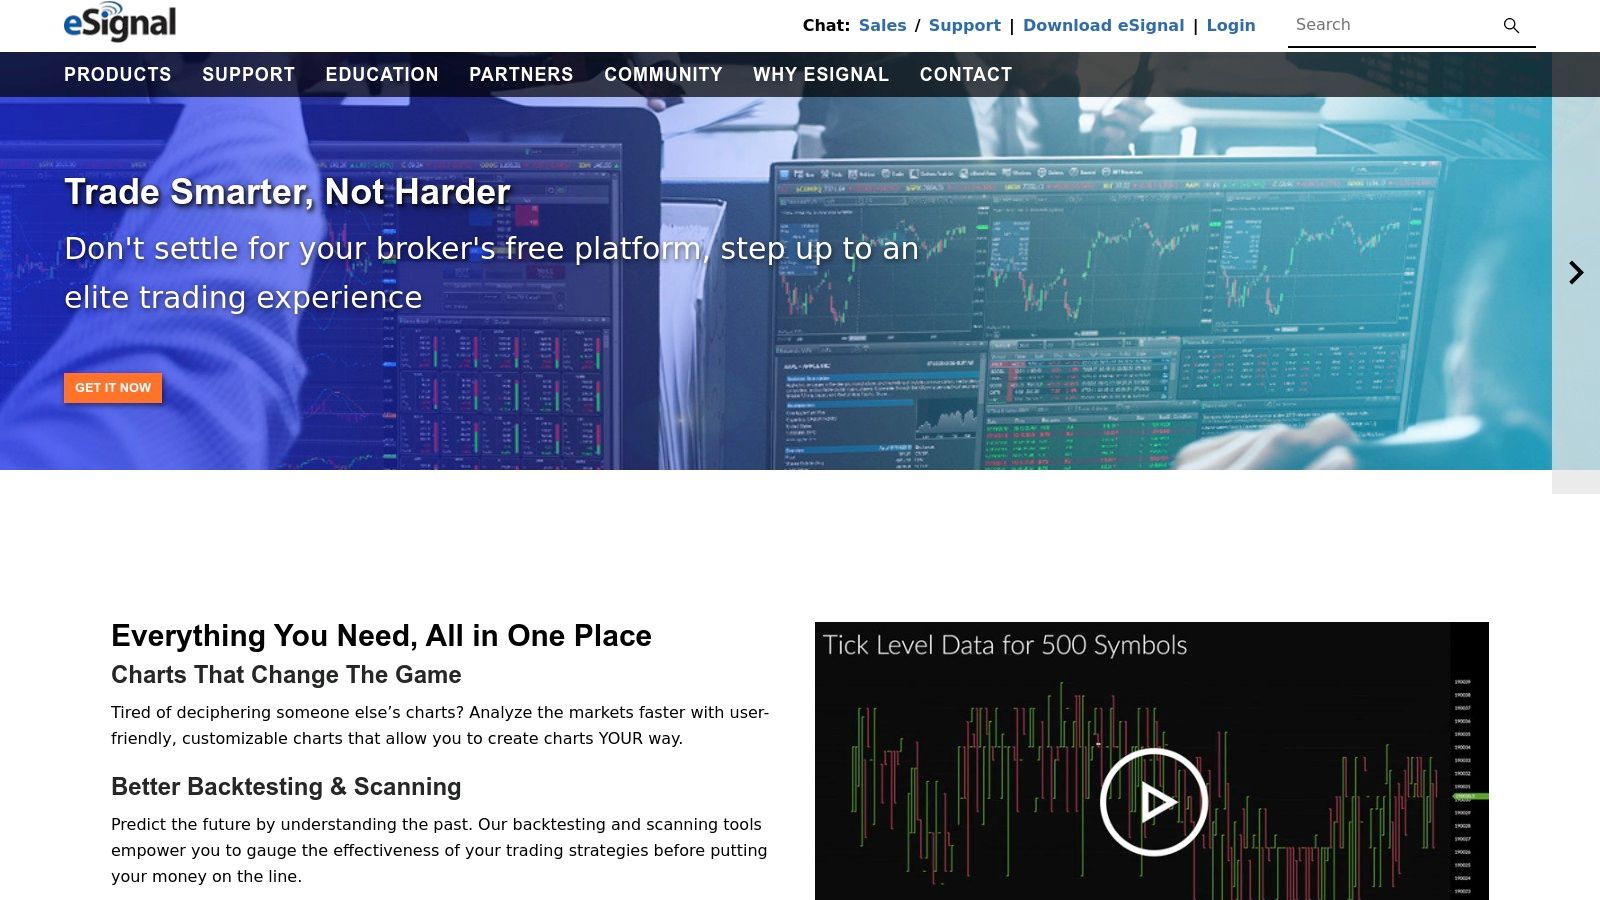
eSignal offers comprehensive real-time streaming data across a vast range of global markets, going beyond just stocks to encompass futures, options, forex, and more. This breadth of data allows users to analyze correlations and opportunities across different asset classes. Its advanced charting capabilities provide hundreds of built-in studies and indicators, empowering users to perform in-depth technical analysis. The platform's Formula Script (EFS) language allows experienced users to create custom indicators and trading strategies, tailoring the platform to their specific needs. eSignal's decision bars and trading systems offer visual cues and automated alerts based on predefined criteria, enabling swift reactions to market changes. For those seeking specific investment opportunities, the advanced market scanning and filtering tools allow users to quickly identify stocks meeting specific technical or fundamental criteria. Stock scanners and stock screeners will find this functionality particularly valuable.
Practical Applications & Use Cases:
- Day Trading: The platform's speed and real-time data feeds are crucial for day traders making rapid decisions based on intraday price movements.
- Swing Trading: eSignal's charting and technical analysis tools help swing traders identify trends and patterns for short- to medium-term trades.
- Long-Term Investing: While known for its appeal to active traders, eSignal can also be used by long-term investors for fundamental analysis and identifying long-term market trends.
- Institutional Trading: The platform's reliability and depth of data make it suitable for financial institutions and professional trading desks.
- Stock Market Education: Educators can use eSignal's features to illustrate technical analysis concepts and trading strategies to students.
Comparison with Similar Tools:
While platforms like TradingView and TC2000 offer robust charting and analysis, eSignal distinguishes itself through its focus on professional-grade data speed and reliability, its advanced customization options via EFS, and its wider range of available markets. However, it's important to note that this comes at a higher price point.
Implementation & Setup Tips:
- Invest Time in Learning: eSignal has a steeper learning curve than some other platforms. Take advantage of the available tutorials and resources to maximize its potential.
- Customize Your Workspace: eSignal's highly customizable interface allows you to create a workspace tailored to your specific trading style and needs.
- System Requirements: Due to the data-intensive nature of the platform, ensure your computer meets the recommended system requirements for optimal performance. eSignal is primarily desktop-focused, so mobile options are less robust.
Pricing & Technical Requirements:
eSignal offers several tiered subscription plans, ranging from basic packages to premium subscriptions with access to all features and data. Contact eSignal directly for detailed pricing information. As mentioned, it's important to have a computer that meets the platform's technical requirements for smooth operation.
Pros:
- Comprehensive real-time data across multiple markets
- Professional-grade technical analysis capabilities
- Fast and reliable data feed
- Highly customizable trading environment
Cons:
- Relatively expensive subscription model
- Steeper learning curve for new users
- Desktop-focused with less robust mobile options
- Requires significant computing resources for optimal performance
Website: https://www.esignal.com/
eSignal is a powerful stock market analysis tool best suited for serious traders and analysts who prioritize real-time data, advanced charting, and customization. While it comes at a premium cost and requires a dedicated learning investment, the platform delivers exceptional functionality for those willing to master it.
10. Yahoo Finance: A Free Gateway to Stock Market Analysis
Yahoo Finance remains a stalwart among stock market analysis tools, offering a free and accessible platform for both novice and seasoned investors to gain insights into the market. While it may not offer the advanced features of premium platforms, its comprehensive market overview, real-time data, and user-friendly interface make it a valuable resource for those starting their investment journey and casual traders looking for a quick snapshot of the market. This tool deserves a spot on this list because it provides a fantastic entry point into the world of market analysis without any financial commitment. It's a practical resource for quickly checking quotes, following market news, and managing a basic portfolio.
For professional traders and stock market analysts, Yahoo Finance can act as a quick reference tool. While it doesn't provide the deep analytical tools required for complex trading strategies, it's useful for checking real-time quotes, scanning headlines, and getting a general sense of market sentiment. Financial institutions and educators can also leverage Yahoo Finance as a supplementary resource for demonstrating basic market concepts and trends. Independent investors, especially those starting out, will find the portfolio tracking feature helpful for monitoring their investments’ performance. Although limited in its backtesting and screening capabilities, Yahoo Finance can still be utilized by stock scanners and screeners for preliminary research and identification of potential trading opportunities. Day traders might find the real-time quotes and basic charting beneficial for quick decision-making, but should supplement this with more advanced platforms for in-depth analysis.
Features and Benefits:
- Real-time quotes and basic charting: Stay updated with the latest price movements and visualize historical trends. While the charting capabilities are basic, they suffice for visualizing price action and recognizing simple patterns.
- Financial news and market updates: Access a continuous stream of news impacting the market, helping you stay informed about events that can influence your investment decisions.
- Portfolio tracking and performance monitoring: Monitor your investments in a centralized dashboard, track their performance, and get a clear picture of your overall portfolio health. This feature allows you to easily monitor your holdings' progress without needing a separate portfolio management tool.
- Basic technical indicators and historical data: Utilize basic technical indicators like moving averages and relative strength index (RSI) for basic technical analysis. Access historical data to identify past trends and inform your trading strategies.
- Economic calendar and earnings reports: Keep track of important economic events and company earnings announcements, which are crucial factors that can significantly impact stock prices.
Pros:
- Completely free access to basic market data: A cost-effective solution for gaining market insights, particularly valuable for beginners.
- User-friendly interface suitable for beginners: Easy to navigate and understand, even for those new to stock market analysis.
- Comprehensive coverage of global markets: Track stocks, cryptocurrencies, and other securities from around the world.
- Integrated with a mobile app for on-the-go monitoring: Stay connected to the market wherever you are.
Cons:
- Limited advanced analysis capabilities: Not suitable for complex trading strategies or in-depth technical analysis.
- Basic charting compared to specialized platforms: Charting features are limited, lacking advanced drawing tools and customizable indicators found in premium platforms like TradingView.
- No customizable screening or backtesting: Limits the ability to identify specific investment opportunities based on predefined criteria and test trading strategies against historical data.
- Occasional data accuracy issues: While generally reliable, occasional discrepancies in data can occur, highlighting the need for cross-referencing with other sources.
Website: https://finance.yahoo.com/
Implementation/Setup Tips:
Getting started with Yahoo Finance is straightforward. Simply visit the website or download the mobile app. Create a free account to personalize your experience and utilize features like portfolio tracking. Familiarize yourself with the various sections, including the charting tools, news feed, and economic calendar. For more advanced stock market analysis tools, consider exploring platforms like TradingView, Bloomberg Terminal, or FactSet, which provide more sophisticated features for professional traders and analysts. Remember to cross-verify data from Yahoo Finance with other reputable sources to ensure accuracy.
Top 10 Stock Analysis Tools: Head-to-Head Comparison
| Product | Features ✨ | UX ★ | Value 💰 | Audience 👥 |
|---|---|---|---|---|
| 🏆 ChartsWatcher | Customizable dashboards, real-time alerts, backtesting | Intuitive drag-and-drop, modern themes | Flexible plans: free basic to feature-rich Pro | Professional traders, financial experts |
| TradingView | Robust charting, social sharing, extensive indicators | User-friendly, intuitive for all levels | Free tier with affordable upgrades | Traders, chart enthusiasts |
| Bloomberg Terminal | Comprehensive global data, proprietary analytics, BLAST | Professional-grade; steep learning curve | Premium pricing (~$24K/year) | Institutional investors, finance professionals |
| MetaStock | Advanced backtesting, custom formulas, pattern recognition | Robust analysis; traditional desktop feel | Higher price with specialized editions | Technical traders, seasoned investors |
| Thinkorswim | Options analysis, custom studies, paper trading | Multi-platform, professional tools | Free with TD Ameritrade account; high-quality features | Active traders, TD Ameritrade clients |
| Stock Rover | In-depth screening, fundamental research, portfolio tools | Intuitive, research-focused | Premium subscription for advanced insights | Fundamental investors, portfolio managers |
| Finviz | Visual heatmaps, comprehensive screener, charts | Minimal learning curve, visually appealing | Free version powerful; Elite offers real-time data | Casual investors, screeners |
| Morningstar | Proprietary ratings, detailed research, portfolio tools | Reliable, intuitive for fundamentals | Premium subscription for full access | Long-term investors, fund analysts |
| eSignal | Real-time streaming, advanced charting, custom scripts | High-speed performance; resource intensive | Relatively expensive, robust technical capabilities | Day traders, professional technical analysts |
| Yahoo Finance | Free market data, basic charts, news updates | Accessible, user-friendly for beginners | Completely free access with essential features | Casual investors, beginners |
Empowering Your Investment Decisions
Navigating the complexities of the stock market demands robust and reliable stock market analysis tools. From charting software like TradingView and eSignal to fundamental analysis platforms like Stock Rover and Morningstar, and comprehensive suites like the Bloomberg Terminal and Thinkorswim, the tools explored in this article offer a diverse range of capabilities for every investor. Whether you're a day trader relying on real-time data from platforms like MetaStock, a long-term investor leveraging Yahoo Finance for basic research, or an institution utilizing Finviz for market screening, selecting the right tools can significantly impact your success. Key takeaways include understanding the strengths of each platform, aligning your chosen tools with your specific investment style, and recognizing the importance of continuous learning and adaptation in the ever-evolving financial landscape.
Choosing the optimal stock market analysis tools depends on various factors, including your experience level, trading frequency, data needs, and budget. Beginners may find user-friendly interfaces like those offered by Yahoo Finance or TradingView more accessible, while experienced professionals might prefer the advanced functionalities of Bloomberg Terminal or MetaStock. Consider the depth of data provided, the availability of real-time information, charting capabilities, screening features, and any associated costs when making your selection. Implementing these tools effectively requires a commitment to ongoing learning and practice. Familiarize yourself with the platform's features, backtest strategies, and continuously refine your approach based on market dynamics.
As you venture into the world of stock market analysis, remember that knowledge and the right tools are your most valuable assets. Empower yourself with the information and resources necessary to make informed decisions and achieve your financial objectives.
Ready to elevate your stock market analysis? ChartsWatcher offers powerful charting and analytical tools designed to help you identify trends, pinpoint opportunities, and maximize your trading potential. Explore the features of ChartsWatcher today and experience the difference a dedicated stock market analysis tool can make. ChartsWatcher
