Who this is for
- You want faster intraday monitoring with configurable alert channels.
- You need a practical workflow that supports live market decision speed.
- You prefer strategy-aligned layouts over generic scan interfaces.
ChartsWatcher gives active traders a modern scanner environment with real-time alert routing and strategy-aligned dashboards.
Side-by-side comparison of key features between ChartsWatcher and StockCharts Scan Engine.
StockCharts is charting-first; ChartsWatcher is scanner-first with modern UX.
StockCharts has no free plan; ChartsWatcher starts at $0.
ChartsWatcher offers tile-based dashboards; StockCharts has a more traditional interface.
ChartsWatcher is built for intraday speed; StockCharts serves broader charting use cases.
Execution Workflow
Define conditions that match your trade model and remove low-value noise.
Monitor dedicated alert streams for each setup category you trade.
Adjust filters and columns based on session-by-session signal quality.
Quick walkthrough so visitors can see the dashboard and workflow in action.
Explore key product panels with cleaner framing and better readability.
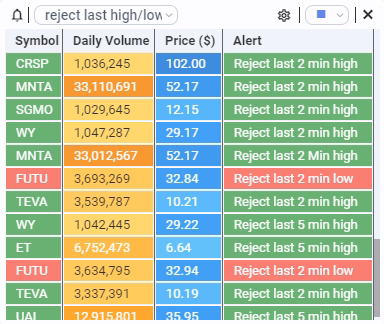
Alert
In the alert tile, you can view alerts for one or more strategies and define custom columns and color schemes.
Yes. Custom alert and toplist configurations are core to the platform.
Yes. You can split setups across channels and dashboards for clear separation.
Yes. Watchlist and news tiles can sit alongside scanner output in your workspace.
No. You can start with straightforward configurations and increase complexity as needed.
No. Any referenced names are trademarks of their respective owners.
Start Free Plan and evaluate strategy-aligned alerts in live markets.
ChartsWatcher is not affiliated with or endorsed by third-party products named on this page. All product names are trademarks of their respective owners and are used only for comparative reference.