Who this is for
- You rely on fast scanning and want clearer alert routing during volatile sessions.
- You need multiple strategy dashboards for different market conditions.
- You want to reduce setup complexity without sacrificing scanner depth.
ChartsWatcher helps active traders run real-time scan and alert workflows with less dashboard friction and faster decision cycles.
Side-by-side comparison of key features between ChartsWatcher and TC2000.
TC2000 is charting-first with EasyScan; ChartsWatcher is scanner-first with alert routing.
ChartsWatcher offers tile-based dashboards; TC2000 uses a tabbed workspace model.
TC2000 uses proprietary PCF language; ChartsWatcher uses visual filter configuration.
TC2000 includes a brokerage; ChartsWatcher focuses purely on scanning and analysis.
Execution Workflow
Translate your highest-value setup conditions into custom filters and alert channels.
Split momentum, continuation, and risk-monitoring views into dedicated screen layouts.
Adjust filters and columns based on what produces the clearest trade opportunities.
Quick walkthrough so visitors can see the dashboard and workflow in action.
Explore key product panels with cleaner framing and better readability.
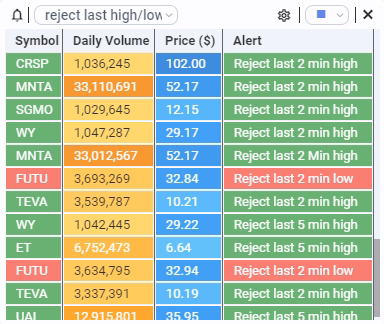
Alert
In the alert tile, you can view alerts for one or more strategies and define custom columns and color schemes.
Yes. You can run multiple screen configurations and switch based on market behavior.
Yes. You can configure real-time alerts and prioritize symbols using custom columns and color logic.
Yes. You can start with basic rules and evolve into advanced scanner workflows over time.
Yes. The free plan lets you validate your workflow before upgrading for higher limits.
No. Third-party names are used for comparative context only and remain property of their owners.
Start Free Plan and test your intraday setup process in real time.
ChartsWatcher is not affiliated with or endorsed by third-party products named on this page. All product names are trademarks of their respective owners and are used only for comparative reference.