Who this is for
- You currently pay for multiple tools and want to cut recurring costs.
- You need practical scanner depth but not inflated software overhead.
- You want a plan path that matches usage growth over time.
ChartsWatcher helps you consolidate scanner, alert, chart, and watchlist workflows into one platform with a free entry point and scalable plans.
Side-by-side comparison of key features between ChartsWatcher and Expensive Scanner Tools.
Most professional scanners cost $50–$200+/mo; ChartsWatcher starts free.
ChartsWatcher consolidates scanner, charts, news, and watchlists in one tool.
Gradual upgrade path means you only pay for what your workflow actually needs.
Reduce tool sprawl by replacing multiple subscriptions with one platform.
Execution Workflow
Identify which workflows matter most and which subscriptions overlap.
Set up the scanner, alert, and dashboard views you use every day.
Increase plan limits when your strategy complexity or volume grows.
Quick walkthrough so visitors can see the dashboard and workflow in action.
Explore key product panels with cleaner framing and better readability.
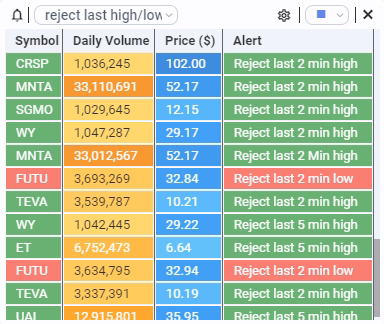
Alert
In the alert tile, you can view alerts for one or more strategies and define custom columns and color schemes.
Yes. It is designed for initial validation and routine use at smaller configuration limits.
Yes. Many users consolidate key scanning and monitoring workflows into one dashboard system.
You can upgrade to higher tiers that expand screens, configurations, and data depth.
No. You can validate fit first and choose the plan that matches your needs.
No. The platform supports analysis and execution readiness, but outcomes depend on strategy and risk control.
Start with the free plan and build your scanner stack around what you actually trade.
ChartsWatcher is not affiliated with or endorsed by third-party products named on this page. All product names are trademarks of their respective owners and are used only for comparative reference.