Who this is for
- You depend on real-time signals during active sessions.
- You want high control over columns, filters, and visual prioritization.
- You are comparing scanner tools based on value and usability.
ChartsWatcher helps active traders route custom alerts into execution-ready dashboards without locking into rigid and expensive scanner bundles.
Side-by-side comparison of key features between ChartsWatcher and Scanz.
Scanz costs ~$164/mo with no free tier; ChartsWatcher starts at $0.
Both offer real-time scanning, but ChartsWatcher has more flexible dashboard layouts.
ChartsWatcher provides a gradual pricing path; Scanz is single-tier all-or-nothing.
ChartsWatcher includes chart and news context tiles alongside scanner output.
Execution Workflow
Set equivalent rule groups for your most valuable market setups.
Use color configs and selected columns to rank ideas quickly.
Track alerts, validate structure, and manage lists without tab overload.
Quick walkthrough so visitors can see the dashboard and workflow in action.
Explore key product panels with cleaner framing and better readability.
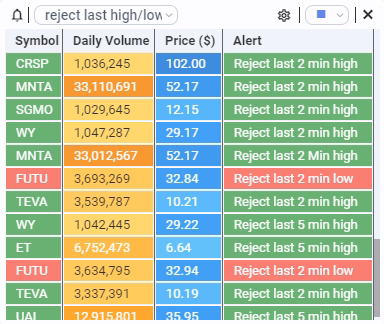
Alert
In the alert tile, you can view alerts for one or more strategies and define custom columns and color schemes.
Yes. You can choose displayed columns and apply color logic to surface high-priority symbols faster.
Yes. The free plan lets you validate fit before moving to higher limits.
Yes. You can maintain multiple screen configurations by strategy and session type.
Yes. News and data tiles can be integrated alongside scanner output.
No exact competitor pricing claims are made here. You should verify all third-party pricing directly.
Start free, stress-test your alert workflow in live sessions, and upgrade only when you need more capacity.
ChartsWatcher is not affiliated with or endorsed by third-party products named on this page. All product names are trademarks of their respective owners and are used only for comparative reference.