When to Buy and Sell Stocks a Practical Guide
Every investor, from the seasoned pro to the absolute beginner, eventually asks the same million-dollar question: when is the perfect time to buy and sell stocks?
But here’s the thing: there is no magic bell that rings at the top of the market or a siren that wails at the bottom. The secret isn't about finding a crystal ball. It's about building a smart, repeatable process based on your personal financial goals, your stomach for risk, and the story the market is telling through cold, hard data.
The Art and Science of Market Timing
Trying to perfectly time the market is a fool's errand. Even the world's most legendary investors don't nail every entry and exit. The real goal is much more achievable: to develop a disciplined approach that consistently stacks the odds in your favor.
Think of it like being a ship's captain. You can't control the weather, but you can learn to read the nautical charts, check the forecast, and navigate the seas skillfully. This guide will help you do just that for the stock market, blending two powerful types of analysis to make you a more prepared and confident trader.
Building Your Strategic Framework
A solid trading strategy is never one-dimensional. It’s about combining different viewpoints to get a complete picture before you act. Your personal framework for deciding when to pull the trigger on a buy or sell should always start with these core elements:
- Your Financial Goals: Are you saving for a retirement that's 30 years away, or are you trying to generate income for next year? A long-term investor's "good time to buy" looks very different from a short-term trader's.
- Your Risk Tolerance: How do you react when the market gets choppy? A trader with a high tolerance for risk might see a sharp dip as a massive buying opportunity. A more conservative investor, on the other hand, will likely wait for clear signs of stability before jumping back in.
- Fundamental Analysis: This is your detective work. You'll investigate a company's financial health—its earnings, debt, and competitive standing—to figure out if its stock is a genuine bargain or just overpriced hype.
- Technical Analysis: This is all about reading the charts. By studying historical price action and patterns, you can get a sense of investor psychology and identify potential entry and exit points that fundamentals alone won't show you.
The key takeaway is this: you don't need to predict the future. You just need a process. When you combine a company's real-world value with an analysis of how the market is behaving, you stop guessing and start trading strategically.
This guide will walk you through building that process. We’ll start by understanding broad market cycles, then dive into the nitty-gritty of company fundamentals, and finally show you how to use technical charts to fine-tune your timing. By the end, you'll be able to filter out the market noise and spot clearer opportunities.
Before we dive deeper, it's helpful to see these concepts laid out. The table below summarizes the key drivers you should be watching when making buy and sell decisions.
Key Factors for Your Buy and Sell Decisions
| Factor Category | Primary Signal | What It Tells You |
|---|---|---|
| Personal Strategy | Financial Goals & Risk Tolerance | Defines your investment horizon and how much volatility you can handle. |
| Fundamental Analysis | Company Health (Earnings, Debt) | Reveals if a stock is fundamentally strong and fairly valued. |
| Technical Analysis | Chart Patterns & Indicators | Shows market sentiment and helps identify optimal entry/exit points. |
| Market-Wide Trends | Economic Data & Sector Strength | Provides context on whether the broader market is supporting or fighting your trade. |
This table serves as a mental checklist. A good decision rarely hinges on just one of these factors; it's the convergence of several signals that creates a high-confidence trading setup. Now, let's get into the specifics of how to use them.
Reading the Market's Ebb and Flow
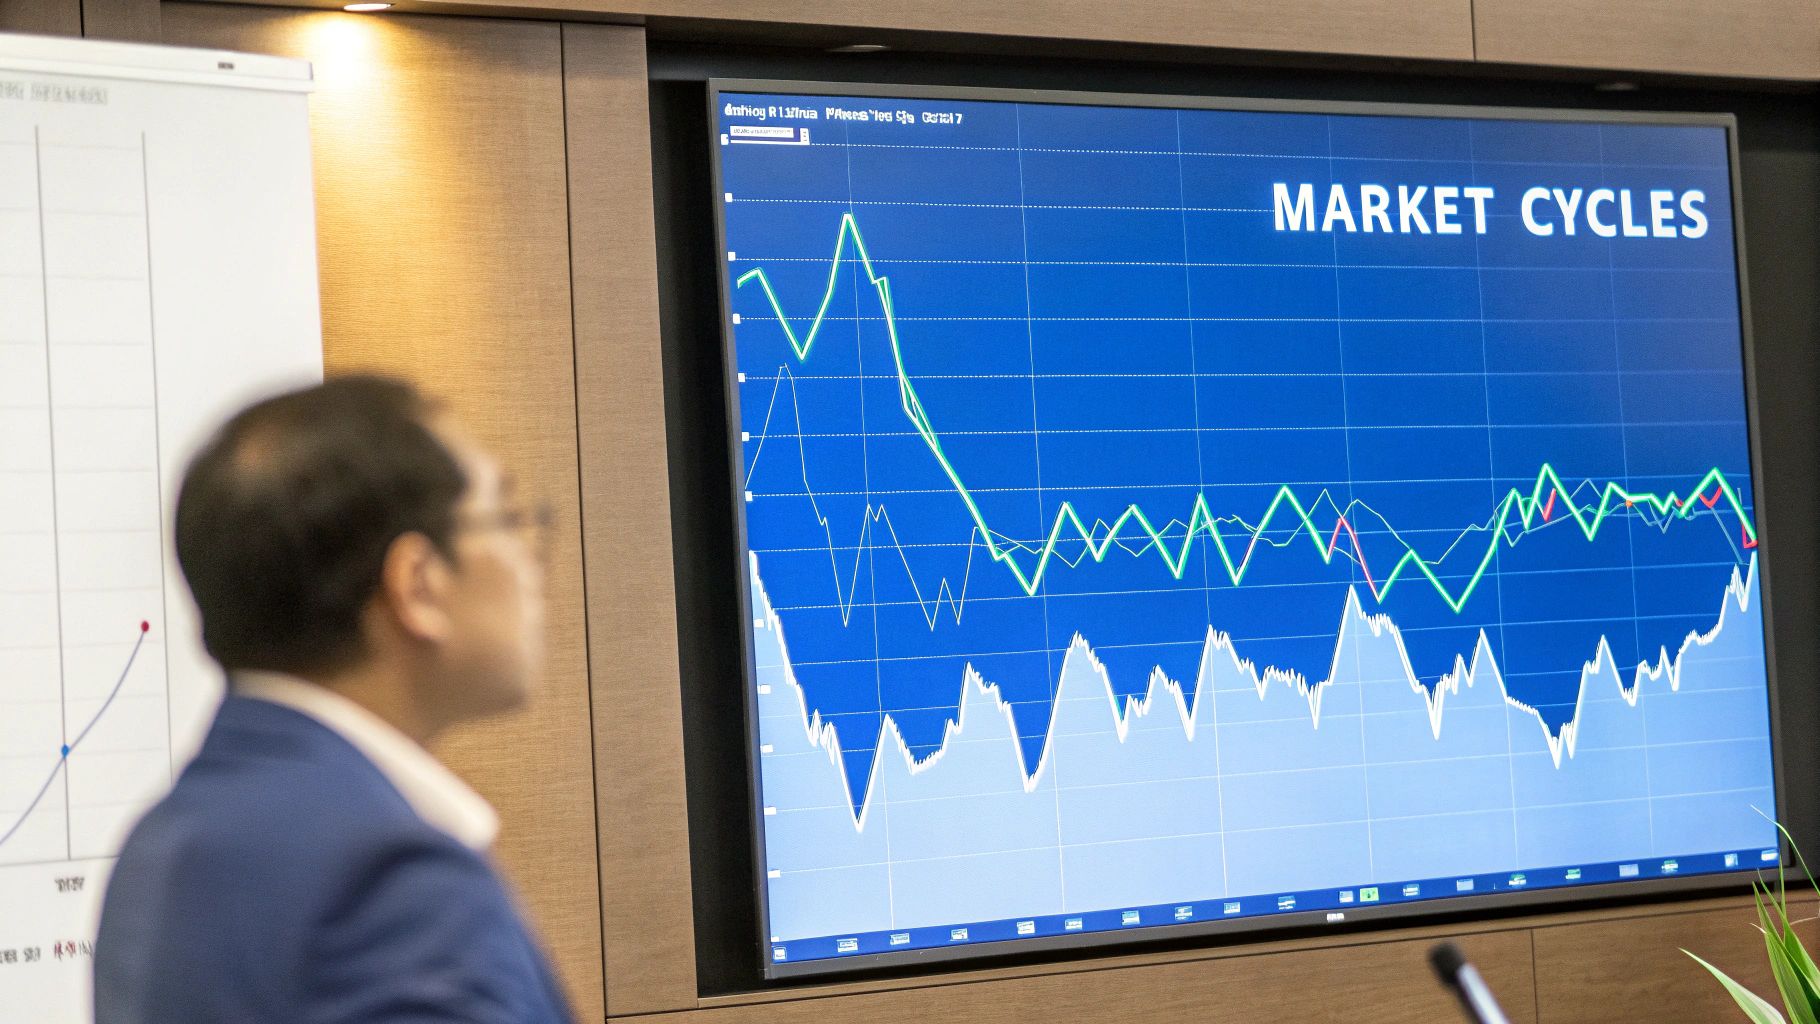
The stock market almost never moves in a straight line. It's much more like the ocean, with powerful tides that create repeating cycles of rising and falling prices. If you want to get your buy and sell timing right, learning to read this natural rhythm is non-negotiable. It provides the bigger picture for every single trade you consider.
These huge, market-wide movements are what we call bull and bear markets. They’re the two main psychological and economic climates you'll be trading in. Figuring out which one we're in is like a farmer knowing the season—it tells you what to plant and when to harvest.
Riding the Bull Market Wave
A bull market is just a fancy term for a period of sustained price growth. It’s fueled by widespread optimism, rock-solid investor confidence, and the shared belief that good times are ahead. Think of it as a rising tide that lifts most boats, even the leaky ones.
During these phases, the economic backdrop is usually pretty sunny:
- Economic Growth: The Gross Domestic Product (GDP) is on the up, and businesses are turning healthy profits.
- Low Unemployment: More people have jobs, which means more money is being spent, fueling the economy.
- High Investor Confidence: That classic "fear of missing out" (FOMO) kicks in. Money pours into stocks, pushing prices even higher.
Historically, bull markets tend to stick around longer than bear markets. While you can't bet the farm on past performance, the S&P 500 has seen bull runs last for years on end. The trick is to ride the wave while it's there but never forget that every party eventually ends.
Navigating the Bear Market Downturn
On the flip side, a bear market is marked by a long, painful price decline. The technical definition is a drop of 20% or more from recent highs, but emotionally, it feels much worse. This is the tide going out, revealing who was swimming naked. Pessimism and fear take over, driving market decisions.
When a bear market hits, the economic news usually turns grim. You'll hear about slowing growth, rising unemployment, and corporate profits taking a nosedive. Investor sentiment flips from greed to pure fear, sparking a sell-off as everyone rushes for "safer" assets.
There's a great saying on Wall Street: "Bulls climb a wall of worry, while bears slide down a slope of hope." It perfectly captures the slow, grinding gains of a bull market versus the fast, terrifying drops of a bear.
Getting a handle on this emotional swing is crucial. One of the best tools for this is the Fear & Greed Index, which looks at a bunch of market factors to spit out a single sentiment score. To really get into the weeds on this, check out this a comprehensive guide to the Fear and Greed Index for trading.
Knowing whether the market is in a state of "extreme fear" or "extreme greed" helps you stay objective. Instead of panic-selling with the herd, you might see a downturn as a chance to scoop up fantastic companies at a huge discount, getting ready for the bull's inevitable return.
Finding Great Companies with Fundamental Analysis
If technical analysis is the art of reading a stock's short-term mood, fundamental analysis is the science of understanding its long-term health. It’s the detective work that helps you answer the most important question: "Is this company actually a good business worth owning?"
This approach is less about timing fleeting market swings and more about figuring out a company's real, intrinsic value. Think of it like buying a house. You wouldn't just look at the recent price history of the neighborhood (technical analysis), would you? You’d also hire an inspector to check the foundation, the plumbing, and the roof (fundamental analysis). You want to know you're buying a solid asset, not just something that’s popular right now.
For stocks, this means digging into financial statements, management quality, and competitive advantages to decide when to buy and sell stocks based on actual business performance.
Decoding a Company's Financial Story
At the heart of fundamental analysis are a few key metrics that tell you a company's story in numbers. You don't need to be an accountant to get the gist of them. These numbers are clues that help you spot potentially undervalued companies (great buying opportunities) or overvalued ones (time to consider selling).
Here are the essential clues to look for:
- Price-to-Earnings (P/E) Ratio: This is one of the most popular valuation metrics out there. It simply compares the company's stock price to its earnings per share. A low P/E ratio can sometimes suggest a stock is a bargain, like finding a high-quality brand on the clearance rack.
- Earnings Per Share (EPS): This metric reveals exactly how much profit the company makes for each outstanding share of its stock. Consistently growing EPS is a strong sign of a healthy, expanding business.
- Dividend Yield: For income-focused investors, this is crucial. It shows how much a company pays out in dividends each year relative to its stock price. A steady, reliable dividend often signals a mature, stable company.
These metrics give you a snapshot, but the real magic comes from watching them over time. A company with a steadily increasing EPS and a reasonable P/E ratio is often a much safer long-term bet than one with flashy, unsustainable numbers. This approach helps you invest in the business itself, not just rent its stock.
Identifying Undervalued and Overvalued Stocks
The ultimate goal of fundamental analysis is to find a mismatch between a company's market price and its true worth. When you find a great company trading for less than it's worth, you've found a potential buy. On the flip side, if a company's stock price has rocketed far beyond what its business performance can justify, it might be time to sell.
This infographic gives a high-level view of the market environments where these opportunities often pop up.
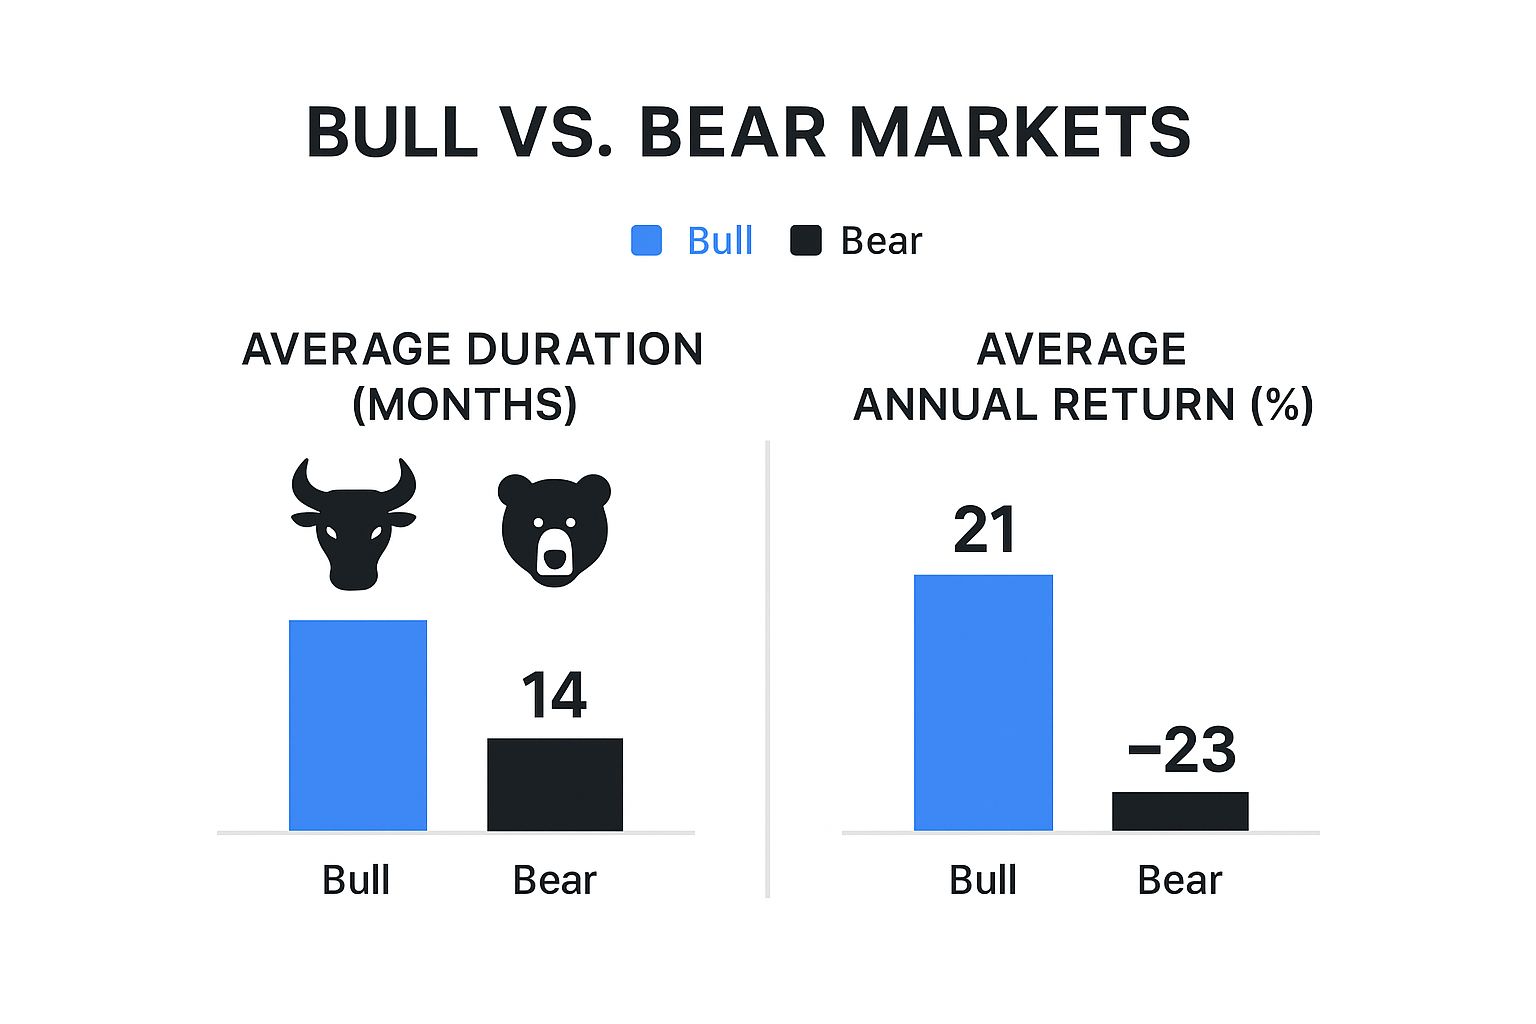
The data here is pretty clear: while bear markets are painful, they are typically shorter than bull markets. This often creates prime opportunities to buy strong companies at a serious discount.
The core idea is simple: You're looking for quality on sale. A market downturn might slash the stock prices of excellent and poor companies alike. Your fundamental analysis is the tool that lets you tell the difference, giving you the confidence to buy when others are panicking.
The table below breaks down what these fundamental signals might mean for your buy and sell decisions. It’s a great starting point for translating raw numbers into actionable ideas.
Fundamental Indicators for Buy and Sell Signals
A comparative look at key fundamental metrics and what they typically indicate for buying or selling a stock.
| Fundamental Indicator | Potential Buy Signal (Undervalued) | Potential Sell Signal (Overvalued) |
|---|---|---|
| P/E Ratio | Low compared to industry peers and its own historical average, suggesting a potential bargain. | Significantly higher than its competitors and historical levels, indicating the stock may be overpriced. |
| Debt-to-Equity | Low or decreasing ratio, which shows the company relies more on its own funds than debt to finance growth. | High or rapidly increasing ratio, which can be a red flag for financial instability, especially in a downturn. |
| Revenue Growth | Consistent, steady year-over-year revenue growth that outpaces its industry rivals. | Stagnant or declining revenue, which could signal a loss of market share or weakening demand. |
By combining these insights, you move from being a speculator to a true investor. You make decisions based on business strength, creating a solid foundation for deciding when to buy and sell stocks for the long term. This method complements technical analysis perfectly, ensuring you’re not just timing your trade well, but that you’re trading a quality asset in the first place.
Timing Your Trades with Technical Analysis
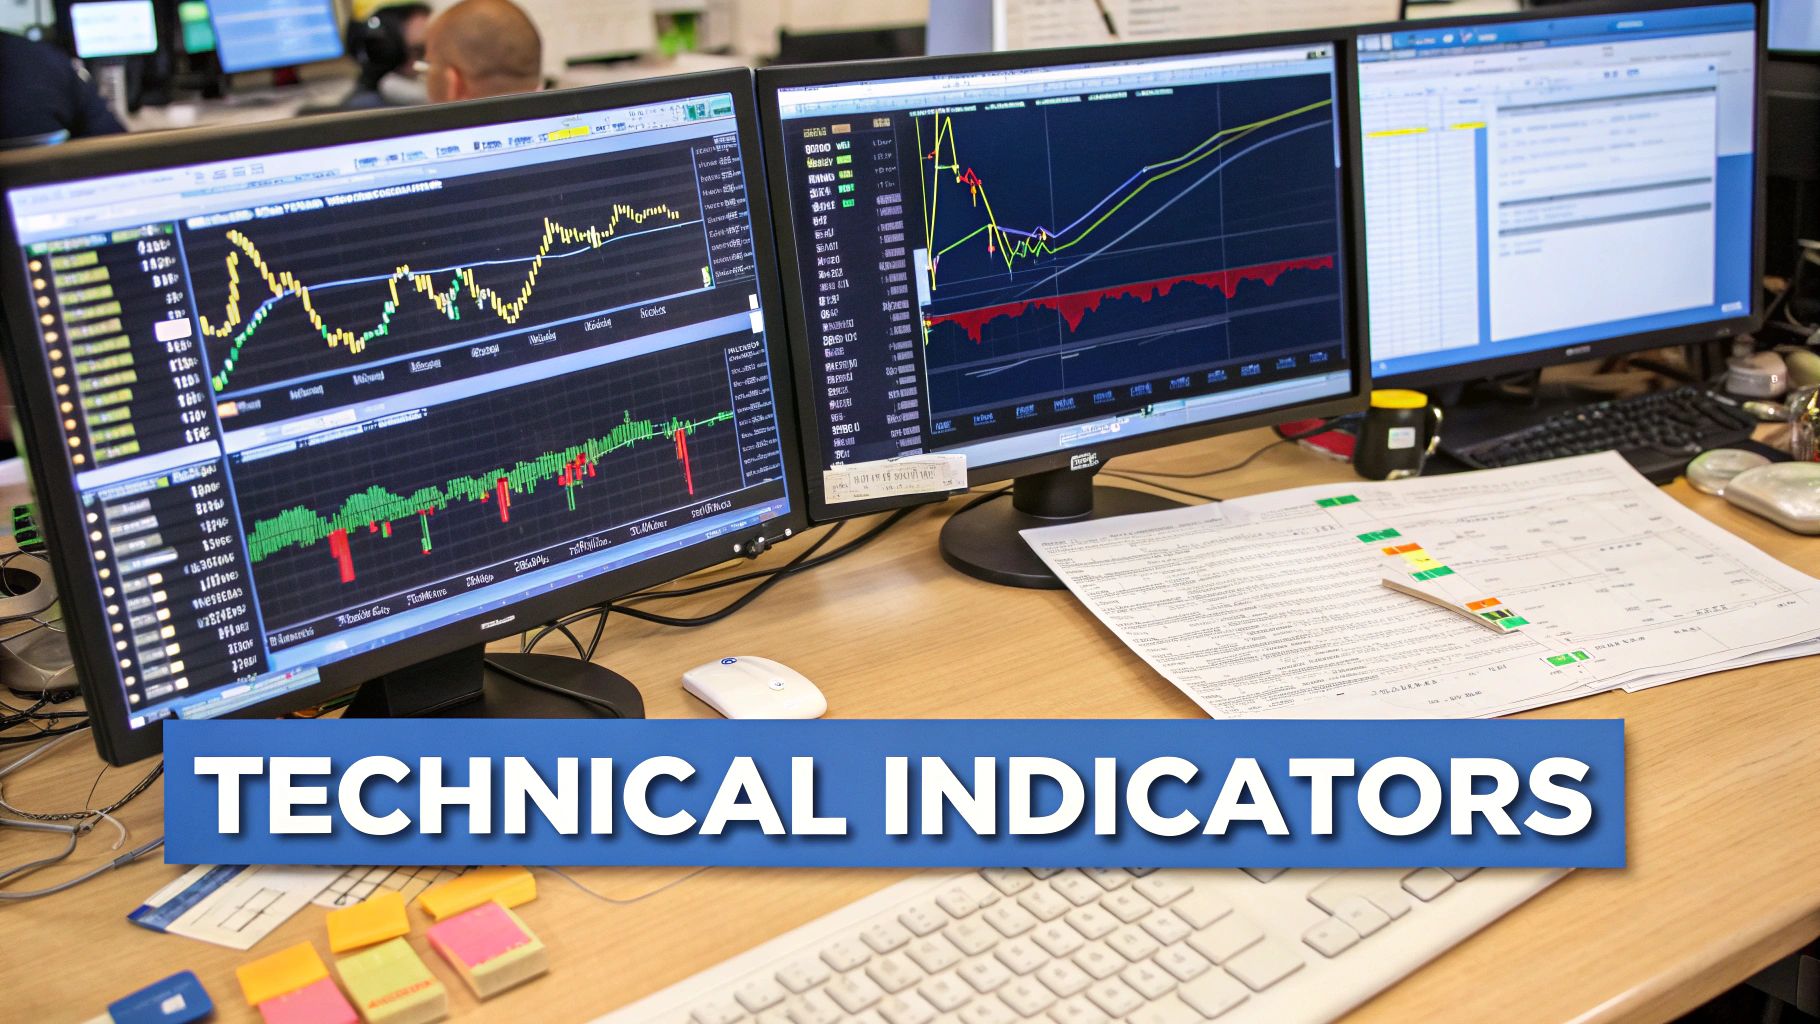
If fundamental analysis helps you decide what to buy, technical analysis is all about figuring out when to pull the trigger. Think of it as a weather forecast for the stock market. Instead of poring over economic reports, technical analysts study price charts and trading volumes to spot historical patterns that might predict short-term price moves.
The core belief here is simple: everything from company earnings to broad market sentiment is already reflected in a stock's current price. This means the most reliable clues for what comes next are found in the price action itself. It’s the key to answering that critical question: when should I buy, and when should I sell?
Reading the Story of a Stock Chart
At its heart, technical analysis is about finding recurring patterns and signals on a chart. Two of the most foundational concepts you’ll encounter are support and resistance.
-
Support: Picture this as a price floor. It's a level where a downtrend is likely to pause because of a concentration of buyers. When a stock's price drops to a support level, it's like a bouncing ball hitting the ground—it’s far more likely to bounce back up than smash right through. A clean bounce off a strong support level is often seen as a green light to buy.
-
Resistance: This is the exact opposite—a price ceiling. It’s where an uptrend often stalls out due to a cluster of sellers looking to take profits. As the price nears a resistance level, selling pressure can overwhelm buying pressure, causing the price to reverse. This can be your cue to consider selling.
These levels aren't just random lines on a screen; they represent the collective psychology of the market. A price that once acted as a tough ceiling (resistance) can become a new floor (support) once it's decisively broken. Getting a feel for these zones is your first big step toward timing your entries and exits like a pro.
A trader's goal is to buy near support and sell near resistance. This simple principle, when combined with other indicators, forms the backbone of countless trading strategies. It helps you avoid buying at the peak of excitement or selling at the bottom of a panic.
Powerful Tools for Timing Your Trades
Beyond support and resistance, traders use various indicators to get a clearer picture. These tools are built right into platforms like ChartsWatcher, allowing you to overlay them on any chart with just a click.
Moving Averages (MA)
A moving average smooths out price data to create a single, flowing line, making it much easier to see the underlying trend direction. A 50-day MA is often used to gauge the medium-term trend, while a 200-day MA reveals the long-term trend. When a shorter-term MA crosses above a longer-term one (what traders call a "golden cross"), it's often viewed as a powerful bullish signal.
Relative Strength Index (RSI)
The RSI is a momentum indicator that measures the speed and magnitude of recent price changes. It runs on a simple scale from 0 to 100.
- An RSI reading above 70 suggests a stock is overbought, meaning it may be due for a pullback.
- A reading below 30 suggests it is oversold and could be primed for a rebound.
Of course, no single indicator is a magic bullet. These tools are most powerful when used together to build a complete picture. For a deeper dive into combining these tools effectively, you can explore various technical analysis strategies you should know.
A solid trading plan always includes managing your downside. Employing effective capital preservation strategies is crucial for protecting your portfolio during volatile swings. By layering these technical insights over your fundamental research, you create a powerful, two-pronged approach to deciding precisely when to make your move.
Knowing all the theory behind fundamental and technical analysis is one thing. Actually putting that knowledge to work, day in and day out, is a whole different ballgame.
Let’s be clear: success in the market isn’t about some secret formula. It's about creating a personalized rulebook—your trading plan—and having the discipline to stick to it. This is how you remove emotion from your decisions and trade with a clear head. Think of a trading plan as your business plan. It lays out your goals, your rules for getting in and out of trades, and exactly how you'll manage risk. Without one, you’re just flying blind, reacting to every market whim and scary headline.
Define Your Goals and Risk Tolerance
Before you even think about buying a single stock, you have to know what you’re trying to achieve. Are you a long-term investor, slowly building a retirement nest egg over decades? Or are you a swing trader aiming to capture profits over a few weeks or months? Your timeline completely changes which strategies and signals matter.
Just as critical is an honest look at your own risk tolerance. How would you really feel if your portfolio dropped by 20%? A solid plan ensures you only take on risks you can stomach, both financially and emotionally. This is what keeps you from panic-selling at the absolute worst moment.
Your trading plan is the ultimate defense against emotional decision-making. It forces you to rely on a pre-defined strategy instead of fear or greed, which are the two biggest wealth destroyers for investors.
By nailing down these parameters first, you build a foundation for every decision that follows. It gives you the clarity to filter out the noise and focus only on the opportunities that actually fit your personal playbook.
Establish Clear Entry and Exit Criteria
This is where the rubber meets the road. Your entry and exit strategies are the heart of your trading plan, spelling out the precise conditions that will make you pull the trigger.
Your Entry Strategy (When to Buy):
- Fundamental Check: Does the company meet your standards for financial health? Think consistent revenue growth or manageable debt.
- Valuation Check: Is the stock's P/E ratio reasonable compared to its peers and its own history?
- Technical Signal: Has the stock bounced off a key support level? Or has a bullish indicator, like a "golden cross," just appeared on the chart?
Your Exit Strategy (When to Sell):
- Stop-Loss Orders: This is your non-negotiable safety net. A stop-loss automatically sells your stock if it drops to a price you set beforehand, putting a hard cap on your potential losses. A common rule is setting a stop-loss 8% below your entry price.
- Take-Profit Targets: Decide what a "win" looks like before you enter the trade. Will you sell when the stock hits a major resistance level, or once it’s up 25%? This stops greed from turning a great trade into a bad one.
You’ve probably heard the old market adage, 'Sell in May and Go Away,' which is based on the idea that stocks tend to fizzle out from May through October. The data is interesting—since 1990, the S&P 500 has returned an average of about 3% from May to October, versus 6.3% from November to April. But while seasonal patterns like this exist, they are far from foolproof. Most investors are better served by a consistent, long-term strategy. You can learn more about this historical market pattern on Investopedia.
A detailed plan might state: "I will buy stocks in an uptrend that have a P/E ratio below 20 and have just bounced off their 50-day moving average. I will set a stop-loss at 8% and a take-profit target at 25%." For a hands-on approach to creating your own rulebook, you can use our detailed trading plan template to guide your process. This kind of structure transforms investing from a gamble into a calculated, repeatable process.
Your Path to Confident Trading Decisions

Let's be real—mastering when to buy and sell stocks isn’t about finding a magic crystal ball that predicts every market wiggle. Chasing that perfect entry and exit every single time is a recipe for stress, not success. The real secret, the one that separates seasoned pros from nervous speculators, is building a disciplined, repeatable process grounded in solid principles. This is how you find your footing and start trading with genuine confidence.
The journey starts with the big picture: understanding the market's natural rhythm. You have to get a feel for the broader cycles, the constant ebb and flow between bull and bear phases. This high-level view is the backdrop for every single decision you make.
Integrating Your Core Trading Tools
Once you have the context, you zoom in with fundamental analysis. Think of this as your due diligence, where you identify genuinely great companies worthy of your capital. It’s about looking past the ticker symbol and investing in a solid, thriving business.
Finally, you bring in technical analysis to sharpen your timing. The charts tell a story, and learning to read them helps you pinpoint smarter entry and exit points by understanding market psychology. It’s no coincidence that tools like those in ChartsWatcher are designed specifically to make this process clearer and more actionable.
The goal isn't to dodge every risk—that's impossible. It's to manage risk intelligently. When you build a personal strategy that blends these methods, you align your trades with your goals and turn all that market noise into a landscape of clear-cut opportunities.
With this integrated approach, you'll find you can navigate the market’s inevitable ups and downs with a much steadier hand. You’ll be making well-researched, strategic moves based on a solid framework, not gut reactions or fleeting emotions. And with every trade that follows your plan, your confidence will grow.
Your Top Stock Trading Questions, Answered
Even with the best strategies on your computer screen, the real world of trading throws curveballs. Let's tackle some of the most common questions that pop up when you're trying to figure out the right time to pull the trigger on a buy or sell.
How Long Should I Hold a Stock Before Selling?
There’s no magic number here. The real answer depends completely on why you bought the stock in the first place.
If you're a long-term investor who bought into a company because its fundamental story was solid, you might hold on for years. Your decision to sell isn't about the stock's daily price swings; it's about a major shift in the company's business or value proposition. You're in it for the long haul, as long as the company stays strong.
On the other hand, a shorter-term trader using technical signals might be in and out of a position in just a few days or weeks. Their exit is dictated by the charts—hitting a specific price target, or an indicator like the RSI flashing a reversal signal.
The golden rule is this: your reason for selling should be the logical opposite of your reason for buying. If you bought based on a technical pattern, you sell based on one. If you bought because of strong fundamentals, you sell when those fundamentals start to crumble.
What Is the Biggest Mistake New Investors Make?
Without a doubt, the most frequent and damaging mistake is letting emotions run the show. This typically plays out in two painful ways: buying out of FOMO (fear of missing out) as a stock rockets upward, and panic-selling the moment the market gets a little shaky.
This emotional rollercoaster practically guarantees you’ll buy high and sell low—the exact inverse of what you’re trying to achieve.
Your best defense against this is a disciplined trading plan. By setting your entry and exit points before you even think about placing an order, you're committing to a logical strategy. This keeps you grounded in your rules instead of getting swept away by market hype or fear.
Should I Use Financial News for Trading Decisions?
Financial news is a classic double-edged sword. It’s absolutely vital for staying aware of company-specific events (like earnings reports and mergers) or bigger economic shifts. But it should never be your primary trigger for buying or selling.
News headlines are notorious for creating short-term noise and kicking off emotional herd behavior. By the time a glowing news story hits the press, that optimism is often already baked into the stock price. Likewise, a scary headline can cause an overreaction that, for a savvy trader, might actually signal a buying opportunity.
Think of news as a piece of the puzzle, not the whole picture. Here’s a better way to use it:
- For Context: Use the news to understand why a stock is suddenly on the move.
- For Confirmation: Check if the news story reinforces or contradicts what your own analysis is telling you.
- Never in Isolation: Always run news-driven ideas through your own technical and fundamental checks before acting.
A dramatic headline alone is rarely a good enough reason to risk your capital. It's just one clue among many you need to solve before making a move.
Ready to stop guessing and start analyzing? ChartsWatcher provides the powerful charting tools, real-time data, and customizable dashboards you need to build and execute a winning trading strategy. Take control of your trading decisions by visiting https://chartswatcher.com to get started today.
