What Is Range Trading A Guide to Sideways Markets
Many traders get fixated on catching those huge, explosive trends. We all dream about them. The reality? Markets spend most of their time going absolutely nowhere.
They consolidate. They chop around. They move sideways as buyers and sellers reach a temporary truce. This is exactly where range trading becomes one of the most powerful tools in your arsenal.
Understanding Range Trading and Why It Matters
Think of a tennis match. The ball bounces predictably between the two players. One baseline acts as a floor—this is your support level, where buyers consistently step in to push the price back up. The net is the ceiling, or resistance level, where sellers take control and knock the price back down.
A market stuck in a range behaves just like that tennis ball, bouncing between two clearly defined boundaries.
The Power of Sideways Markets
Instead of getting frustrated waiting for a trend, range traders find their edge inside this consolidation. The strategy is beautifully simple: buy weakness near the support floor and sell strength at the resistance ceiling. You're capitalizing on market indecision.
This isn't just a niche strategy; it’s grounded in how markets actually behave. Technical studies suggest markets are in a non-trending state about 70% of the time. During these periods, range-based approaches can seriously outperform trend-following systems. Some research even indicates that by systematically buying support and selling resistance, traders can see 20-30% higher risk-adjusted returns compared to those just waiting for a breakout. You can learn more about how range trading performs in different market conditions.
Range trading is the art of finding opportunity in stability. While others see a boring, sideways market, the range trader sees a predictable rhythm of buying and selling pressure that can be systematically traded.
This makes mastering range trading essential. It gives you a clear game plan for the long stretches when the market isn't making big, directional moves. It turns what most people see as choppy, un-tradable price action into a landscape filled with high-probability setups. By learning to spot and trade these ranges, you unlock a method for grinding out consistent returns, even when the broader market seems to be asleep.
For a quick overview, let's break down the core components of a range trading strategy.
Range Trading at a Glance
This table gives you a quick summary of the key pillars of any solid range trading plan. Think of it as your cheat sheet for identifying and acting on these setups.
| Component | Description | Key Action |
|---|---|---|
| Market Structure | A sideways market with clear, horizontal support and resistance levels. | Identify two or more touches at both the high (resistance) and low (support). |
| Entry Points | Buying near the support level or shorting near the resistance level. | Wait for price to test a boundary and show signs of reversal before entering. |
| Stop-Loss | Placed just outside the range boundary to limit risk if a breakout occurs. | Place a stop just below support for a long trade, or just above resistance for a short. |
| Profit Target | The opposite side of the range. | For a long entry at support, the target is the resistance level, and vice versa. |
With these core ideas in mind, you can start to see how a seemingly "boring" market can actually be a field of opportunity.
How to Identify the Anatomy of a Trading Range
Before you can even think about trading a range, you have to get good at spotting one in the wild. A true trading range isn’t just a mess of choppy price action; it has a clear structure built on two core concepts: support and resistance. Nailing this is the heart of what range trading is all about.
Think of it like an invisible floor and ceiling that the price just can't seem to break through. The floor is support—a price level where buyers consistently step in and push the price back up. The ceiling is resistance, where sellers take control and shove the price back down. For a range to be considered valid, you need to see the price test both of these levels at least twice.
Every one of these "touches" is a piece of historical evidence that confirms the boundaries of the market's current stalemate. The more times the price respects these levels without breaking through, the more reliable that range becomes for trading. Having a solid grasp of technical analysis for beginners is your starting point for seeing these patterns unfold.
Finding the Core Pillars: Support and Resistance
Pinpointing support and resistance is more of an art than an exact science. You’re looking for zones, not perfect, single-pixel lines. Start by pulling up a chart and just looking. Can you visually connect the lowest swing points with a horizontal line? That's your potential support. Now do the same for the highest swing points to find resistance.
You’re hunting for areas where the price has repeatedly stalled and reversed. Has the price tried and failed to close above a certain level multiple times? That’s your resistance zone. Does it keep finding a bid at a specific low? You've likely found your support.
A well-defined trading range is a story of market equilibrium. The repeated tests of support and resistance show a clear, visual consensus between buyers and sellers, creating a predictable environment for strategic trades.
If you want to get really good at drawing these crucial levels, we have a detailed guide on mastering supports and resistance that breaks it down step-by-step. This skill is non-negotiable for anyone serious about range trading.
Using Indicators to Confirm the Range
While eyeballing the chart is a great start, using a few technical indicators can give you the extra confirmation you need. They help validate that the market is truly in that low-volatility, sideways state that's perfect for range-bound strategies.
Here are three go-to indicators for confirming a range:
- Bollinger Bands: When the bands squeeze together and start moving horizontally, it's a huge tell. This signals consolidation and low volatility—exactly what you want to see. When the price bounces between the upper and lower bands, it adds another layer of confirmation to your support and resistance zones.
- Average True Range (ATR): A low or falling ATR value is another clear sign that volatility is drying up. It tells you the market is settling down, not gearing up for a major breakout. It’s also incredibly useful for gauging how much profit potential there is between the top and bottom of the range.
- Volume Analysis: Volume tells you the story behind the price action. In a classic range, you'll often see volume trail off as the price approaches the boundaries. This suggests momentum is fading and the level is likely to hold, setting up a potential reversal trade.
On the flip side, a sudden spike in volume as price hits support or resistance is a massive red flag. That surge means big players are trying to force a break, and you should be on high alert for a potential breakout. By combining visual analysis with these indicators, you can build a rock-solid process for finding high-probability range setups.
Executing Your Range Trade Step by Step
Okay, you’ve spotted a stock trading in a nice, clean range. That’s the first battle won. But identifying the setup is one thing; actually putting your money to work is where the real skill comes in.
Moving from a chart pattern to a live trade demands a clear, repeatable plan. This isn't about guesswork or gut feelings. A well-executed range trade is methodical, turning that predictable bounce between support and resistance into a tangible opportunity.
Let's walk through the three make-or-break phases of every range trade: finding your entry, setting your stop-loss, and planning your profit-taking exit. Nailing this sequence is what separates the pros from the crowd.
Phase 1: Finding Your Entry Point
Your entry is the single most critical decision you'll make. It’s the anchor for your entire trade, dictating your risk-reward ratio and even your mental state. In range trading, you’ve really got two main ways to get in.
-
The Aggressive Entry: This is for traders who want to get ahead of the curve. It involves placing an order right at the support or resistance boundary before the price has actually confirmed it’s turning around. For example, if support is at $100, an aggressive trader might set a buy limit order at $100.10, hoping to get filled as the price dips into the zone. The upside? A fantastic entry price and a killer risk-reward ratio. The risk? The price could slice right through that level without even pausing for breath.
-
The Conservative Entry: This approach is all about patience. Instead of front-running the level, a conservative trader waits for proof. They'll watch the price touch support, bounce off it, and show some sign of life. This confirmation could be a bullish candlestick pattern (like a hammer or a bullish engulfing candle) or an oscillator like the RSI ticking up from oversold territory. You'll get a slightly worse price, but your trade has a much higher chance of working out because you've seen other buyers stepping in to defend the level.
So which one is right? It really comes down to your risk tolerance and the market's personality at that moment. A sleepy, well-behaved stock in a tight range might be perfect for an aggressive entry. But if the market is choppy and uncertain, waiting for confirmation is the smarter play.
Phase 2: Setting Your Stop-Loss
A stop-loss isn't optional—it's your get-out-of-jail-free card. This is especially true in range trading, where your number one risk is a breakout that leaves you on the wrong side of a new trend. Your stop-loss is your pre-planned escape hatch, protecting your capital from a big hit.
The most logical place for a stop-loss is just outside the range. Simple as that.
- For a long trade at support, your stop-loss goes just below the support level.
- For a short trade at resistance, your stop-loss goes just above the resistance level.
But how far is "just outside"? A classic rookie mistake is setting it too tight. Normal market noise and price fluctuations can easily wick you out of a perfectly good trade. A much better approach is to use the Average True Range (ATR) indicator. For instance, you could place your stop 1x ATR below the low of the support zone. This method tailors your risk to the stock's recent volatility, giving the trade room to breathe without exposing you to a massive loss.
Phase 3: Planning Your Exit for Profit
You have a plan for when you're wrong, so you absolutely need one for when you're right. The most straightforward profit target in range trading is simply the other side of the channel.
The core logic of range trading is built on mean reversion—the idea that price will revert to its average. By targeting the opposite boundary, you are betting on this statistical tendency to play out once more. You can explore more about how this works in our complete guide to mean reversion strategy.
If you buy at support, your primary target is the resistance level. If you short at resistance, you're aiming for support. This creates beautifully clear and often very favorable risk-reward scenarios. Think about it: if you risk 25 cents per share on your stop-loss and the range is $1.00 wide, you're looking at a potential 4:1 risk-reward ratio. That’s a trade setup you should be excited about.
Some traders also like to scale out of their positions. This might mean selling half your shares at the halfway point to your main target and then moving your stop-loss to your entry price (breakeven). This tactic locks in some profit, takes all the risk off the table for the rest of the position, and lets you ride the second half stress-free. It's a powerful way to manage a trade within a well-defined range.
Using ChartsWatcher for Advanced Range Trading
Spotting a trading range is a great start, but the real trick is finding these setups consistently and jumping on them before the opportunity vanishes. Let's be honest, manually flipping through hundreds of charts is a surefire way to miss the best trades and burn out. This is where a powerful stock scanner like ChartsWatcher becomes your secret weapon, automating the discovery process so you can get a critical edge.
Instead of hunting for setups, you build a system that brings them right to your screen. This completely flips the script, moving you from a reactive trader to a proactive one. You'll spend your valuable time analyzing high-probability setups, not just searching for them in a sea of charts. It’s all about creating a repeatable workflow that saves time and sharpens your decision-making.
Building Custom Scans to Find Range-Bound Stocks
The real magic of ChartsWatcher is its ability to build incredibly specific, multi-layered scans. You can essentially teach the scanner to think like a range trader, filtering the entire market to find stocks that meet your exact definition of a sideways consolidation. This is worlds away from just looking for stocks that haven't moved much lately.
Here’s a simple but effective filter combination to get you started:
- Price Action Filters: Tell the scanner to find stocks where the current price is hanging out close to a key moving average. For example, you could filter for stocks trading within +/- 2% of their 50-day moving average. This immediately flags assets that are hugging a central price point.
- Volatility Filters: Use an indicator like Bollinger Bands. A classic sign of a market coiling up is when the bands "squeeze" together. You can add a filter in ChartsWatcher for Bollinger Band Width being below a certain value, which automatically flags those low-volatility pockets perfect for range trading.
- Volume Confirmation: Always make sure you can get in and out of your trades easily. Add a filter to ensure the average daily volume is above a healthy threshold (like 500,000 shares) to guarantee you’re only seeing liquid stocks.
When you combine these conditions, your scanner will only serve up stocks that are liquid, trading sideways, and showing low volatility—the perfect trifecta for a potential range-bound setup. Beyond specialized charting tools, some advanced traders also use automated scalping algorithms to fire off high-frequency trades within these tight ranges, adding another layer to short-term market engagement.
Setting Up Dynamic Alerts for Precision Entries
Once your scanner has built a watchlist of potential candidates, the next piece of the puzzle is timing your entry. A stock might be in a beautiful range, but it’s only a trade when the price is near one of the boundaries. Trying to watch every single stock on your list manually is a recipe for disaster.
This is where dynamic alerts in ChartsWatcher become a game-changer. Forget setting simple price alerts; you can create alerts based on specific technical conditions.
- Price-Level Alerts: Set an alert to ping you the moment a stock’s price gets within a few cents of a key support or resistance level you’ve drawn.
- Indicator-Based Alerts: Get even more specific. Create an alert that triggers when the price touches the lower Bollinger Band or when the RSI drops into oversold territory (below 30).
These alerts act like your personal trading scout, tapping you on the shoulder the moment a stock on your watchlist hits your entry criteria. This frees you up to focus on managing your portfolio, confident you won't miss a high-probability trade.
This flowchart neatly lays out the three-step process for executing a range trade.
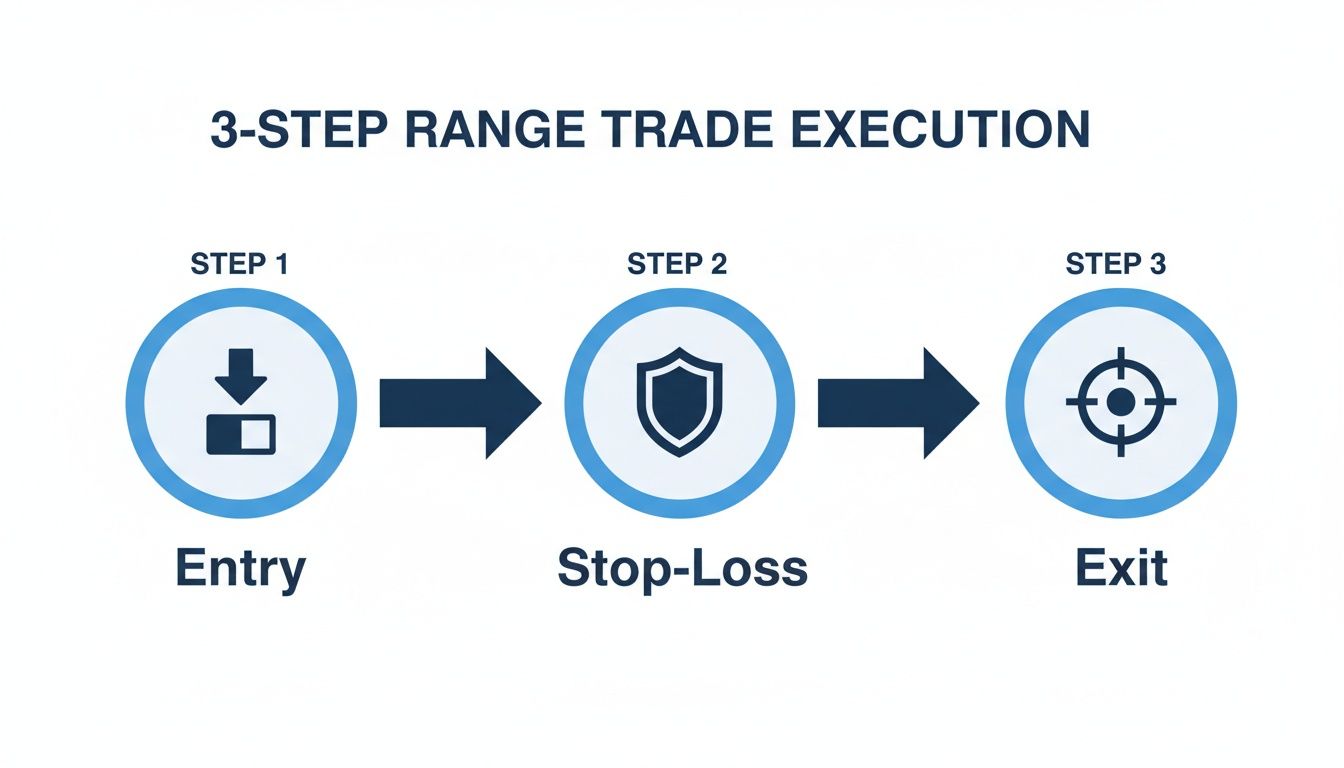
It breaks the trade down into its core parts: a clear entry trigger, a defined stop-loss to control your risk, and a logical target for taking profits.
Validating Your Strategy with Backtesting
So, you've got a set of rules for range trading. But how do you know if they actually work over the long haul? The answer is backtesting. ChartsWatcher's backtesting engine lets you pit your specific set of entry, exit, and stop-loss rules against years of historical market data.
You can simulate your entire strategy to see exactly how it would have performed, giving you invaluable, data-driven feedback on whether your approach has a real edge.
Backtesting isn't about predicting the future; it's about validating your process. It lets you trade with confidence, knowing your strategy is backed by a statistical edge based on past performance.
This isn't just a theoretical exercise; it produces real, tangible insights. For example, a quick backtest on ChartsWatcher shows that during gold's persistent $1,200-$1,400 range in 2018-2019, a simple range strategy using a 1:2 risk-reward ratio could have returned over 25%. It's a powerful reminder of how effective range trading can be in choppy markets—which some studies suggest make up 60-70% of the time in major forex pairs.
By using the platform's scanning, alerting, and backtesting tools together, you create a truly robust system. You find opportunities automatically, get notified at the perfect moment to act, and execute a strategy that you've already proven with historical data. This turns ChartsWatcher from just another charting tool into a complete workstation for serious range trading.
Managing Risk and Avoiding Common Pitfalls
Let's get one thing straight: you can have the best range trading entries in the world, but without solid risk management, you'll eventually blow up your account. It's not a matter of if, but when.
The entire strategy is built on the assumption that support and resistance levels will hold. The single biggest threat—the one that can wipe out a month of patient gains in a single trade—is the breakout.
When a key level finally gives way, a quiet, sideways market can turn into an explosive trend in the blink of an eye. If you're caught on the wrong side of that, you're in for a world of pain. Learning to manage this risk isn't just a "nice-to-have" skill; it's the core discipline that separates the pros from the crowd.
Spotting the Warning Signs of a Breakout
A breakout rarely comes out of nowhere. The market often drops breadcrumbs, signaling that the balance between buyers and sellers is about to tip. If you learn to read these clues, you gain a massive edge.
First, watch the volume. In a normal, healthy range, volume tends to die down as the price nears the boundaries. But if you see a big spike in volume as the price approaches support or resistance? That's a huge red flag. It means big players are stepping in, trying to force a move.
Next, pay attention to the price action at the edges. For example, if the price keeps pushing up against resistance but the pullbacks are getting shallower and shallower (making "higher lows"), it's a sign of compression. Buyers are getting more aggressive, and sellers are losing steam. That kind of pressure cooker action often precedes a violent pop.
Finally, never, ever ignore the economic calendar.
- Major News Events: Earnings reports, Fed announcements, or big economic data releases can throw a grenade into a perfectly stable range.
- Market-Wide Shifts: Sometimes, a sudden shift in overall market sentiment (like a flash crash or a major geopolitical event) can cause breakouts across dozens of assets at once.
The Non-Negotiable Stop-Loss
If there's one fatal flaw in a range trader's mindset, it's assuming the range will hold forever. Every single trade you take must have a stop-loss order attached to it from the moment you hit the "buy" or "sell" button. No exceptions.
A stop-loss is your insurance policy against a catastrophic loss. It's the pre-planned, logical decision that saves you from the emotional mistake of "hoping" a bad trade will come back.
Place your stop just outside the range—a little bit below support for a long position, and a little bit above resistance for a short one. This defines your failure point. If the price hits that level, your entire reason for being in the trade is gone. Get out, preserve your capital, and live to trade another day.
Knowing When to Stay on the Sidelines
Just as important as knowing when to trade a range is knowing when not to. Trying to force this strategy in the wrong market conditions is a fast way to get chopped up and lose money. Range trading is a specific tool for a specific job.
Steer clear of range trading in these environments:
- High Volatility Markets: When indicators like the Average True Range (ATR) are spiking, it means price is erratic and unpredictable. Range boundaries become meaningless.
- Strongly Trending Markets: Trying to short a stock that's in a parabolic uptrend is like trying to stop a freight train with your bare hands. Don't be a hero. Wait for the market to calm down and consolidate.
- Illiquid Assets: Stocks that trade on thin volume can have huge bid-ask spreads and are prone to sudden price gaps that can jump right over your stop-loss. Stick to liquid names.
Ultimately, successful risk management here is all about discipline. It’s about respecting the very real threat of a breakout, using a stop-loss every single time, and having the patience to sit on your hands until the right, low-volatility conditions appear.
Frequently Asked Questions About Range Trading
Even with a solid game plan, you're bound to have questions when picking up a new trading strategy. Let's run through some of the most common ones to clear up any confusion and get you trading with confidence.
What Is the Best Timeframe for Range Trading?
There’s no magic answer here; the "best" timeframe is the one that fits your life and trading style. The beauty of support and resistance is that it's a fractal concept—it shows up on a 1-minute chart just as clearly as it does on a weekly. It all comes down to aligning the chart with your schedule and goals.
-
Day Traders: If you're at your desk all day, you might zero in on the 5-minute or 15-minute charts. You’re looking for ranges that form and play out within a single session, often lasting just a few hours. This requires focus and the ability to act fast.
-
Swing Traders: For those with less screen time, the 4-hour or daily charts are your playground. These ranges develop over days or weeks, letting you place a trade and check on it less frequently. This style is all about patience.
The core strategy—buy support, sell resistance—doesn't change. Just pick a timeframe that won't have you stressing about your positions while you're trying to live your life.
How Do I Know if a Range Is About to Break?
No signal is ever a 100% guarantee, but there are definitely some telltale signs that a quiet range is about to turn into a firework show. Spotting these clues can save you from a nasty stop-out or even help you flip your bias and catch the breakout.
The biggest red flag is a massive increase in volume as the price tests a boundary. This is your hint that the big players—institutions—are stepping in and throwing their weight around. Think of it as pouring gasoline on a fire; the odds of that level holding just dropped dramatically.
Another powerful clue comes from the price action itself. Look for "higher lows" getting carved out just underneath resistance. This shows that buyers are getting impatient and stepping in earlier and earlier, squeezing the sellers. On the flip side, "lower highs" forming just above support is a bearish sign that sellers are getting aggressive and buyers are losing steam.
Finally, never ignore the calendar. A major news event like an earnings report or an economic data release can blow any technical pattern out of the water in an instant.
Can I Use Range Trading for Stocks Forex and Cryptocurrencies?
Absolutely. Range trading is a universal price action strategy. It's built on the foundational market principles of supply and demand (or support and resistance), which exist in any asset you can chart. The rhythmic dance between buyers and sellers happens everywhere, from stocks and forex to commodities and crypto.
But you have to respect the personality of the asset you're trading.
The core principles of range trading are constant, but your risk parameters must be flexible. The volatility of the asset you are trading should directly inform the size and placement of your stop-loss.
Cryptocurrencies, for example, are famously volatile. A range in Bitcoin might be thousands of dollars wide, and the risk of a sudden, violent breakout is way higher than in a blue-chip stock like Coca-Cola. That means you'll need to use wider stop-losses and probably smaller position sizes to keep your risk in check.
What Is the Difference Between Range Trading and Trend Trading?
Think of them as two sides of the same coin—opposite strategies for totally different market environments. Knowing which one you're in is the first and most critical step.
Range Trading is for markets that are stuck in the mud. When price is chopping sideways without any clear direction, range traders are in their element. Their motto is "buy low, sell high" inside a defined channel, profiting from the predictable ping-pong between support and resistance. It's a mean-reversion strategy at its heart.
Trend Trading, on the other hand, is for markets that are going somewhere. When a price is consistently making higher highs and higher lows (an uptrend) or lower lows and lower highs (a downtrend), trend traders hop on for the ride. Their goal is to catch the momentum, buying dips in uptrends or selling rallies in downtrends. Their mantra is "the trend is your friend."
Knowing what range trading is also means knowing what it isn't. The most important skill is correctly identifying whether the market is consolidating or trending before you even think about placing a trade.
Ready to stop hunting for setups and start having them delivered to you? ChartsWatcher provides the powerful scanning, alerting, and backtesting tools you need to find and validate high-probability range trades automatically. Build your edge today. https://chartswatcher.com
