What Is a Short Squeeze? A Trader's Guide to Market Mania
A short squeeze is what happens when a stock’s price shoots up unexpectedly, forcing traders who bet against it (the short sellers) to scramble for the exits. This mad dash to buy back shares creates a powerful feedback loop, driving the price even higher and inflicting massive losses on anyone caught on the wrong side of the trade.
Understanding the Anatomy of a Short Squeeze
Picture a crowded theater with only one tiny exit. Now, imagine someone yells "fire." The ensuing panic, with everyone rushing that single door at once, is a pretty good analogy for a short squeeze. The "theater" is a heavily shorted stock, and the "exit" is the limited supply of shares available to buy back.
To really get this, you have to know how short selling works. In a nutshell, traders who short a stock are betting its price will drop. They borrow shares, sell them on the market, and hope to buy them back later at a lower price. The difference is their profit. (If you need a refresher, check out our guide on what short selling is).
But here's the catch: the strategy has a brutal downside. If the stock’s price goes up instead of down, a short seller's potential losses are, in theory, infinite. And that’s exactly where the fuse for a squeeze is lit.
The Vicious Cycle of a Squeeze
At its core, a short squeeze is a violent chain reaction. It usually starts with a stock that has extremely high short interest—often over 20% of all its available shares are sold short. All it takes from there is a single positive catalyst to set things in motion.
This spark could be anything: a surprisingly good earnings report, a new product announcement, or even just a sudden wave of hype from retail investors on social media. As the price begins to climb, short sellers watch their positions turn red. Soon, their brokers start making "margin calls," demanding more cash or forcing them to close their positions to cut their losses.
The process typically unfolds in a few stages:
- The Setup: A stock gets heavily shorted. A crowd of investors is convinced it's overvalued and headed for a fall.
- The Catalyst: Something unexpected and positive happens. The narrative changes, and the stock price starts ticking upward.
- The Panic: Early price bumps trigger losses for shorts. Margin calls start rolling in, creating a sense of urgency. The "fire" alarm has been pulled.
- The Squeeze: To exit their losing bets, short sellers must buy back the shares they borrowed. This sudden, intense wave of buying pressure sends the stock price parabolic, trapping the remaining shorts in an excruciating upward spiral.
The Short Squeeze Lifecycle at a Glance
To see how these phases flow together, it helps to break down the lifecycle of a typical squeeze. Each stage builds on the last, creating the explosive momentum that defines these market events.
| Phase | Market Condition | Short Seller Action | Price Impact |
|---|---|---|---|
| 1. The Setup | High short interest; bearish sentiment dominates. | Shorts build large positions, borrowing and selling shares. | Price may be stagnant or drifting lower under selling pressure. |
| 2. The Catalyst | An unexpected positive news event occurs. | Initial price jump causes early losses and nervousness. | Price begins to rise, breaking key resistance levels. |
| 3. The Ignition | Price momentum attracts new buyers (longs). | Margin calls begin; some shorts start covering voluntarily. | Buying pressure intensifies; price accelerates upward. |
| 4. The Squeeze | Widespread panic; forced liquidations. | A cascade of forced buy-backs as shorts rush for the exit. | Price goes parabolic, hitting extreme highs on massive volume. |
| 5. The Exhaustion | Buying pressure wanes as most shorts have covered. | The last shorts are squeezed out or have blown up their accounts. | Price peaks and often falls sharply as the buying frenzy ends. |
Understanding this lifecycle is key, as it shows that a squeeze isn't a single event but a process. Spotting a stock in the "Setup" phase is what gives traders an edge, allowing them to anticipate the fireworks before they begin.
The Hidden Mechanics That Fuel a Squeeze
A short squeeze doesn't just happen out of the blue. It’s the violent conclusion to a buildup of market pressure, kind of like a volcano that's been rumbling for months before it finally blows. To really get what’s happening, you have to look past the wild price charts and dig into the mechanics that create such a tinderbox environment.
Experienced traders keep an eye on a specific set of metrics to gauge this pressure. These aren't secret formulas; they're just data points that act as a barometer for market tension. When these indicators start flashing red, it's a sign that a stock is becoming a powder keg, just waiting for a spark.
Let’s break down the key ingredients that can fuel the fire.
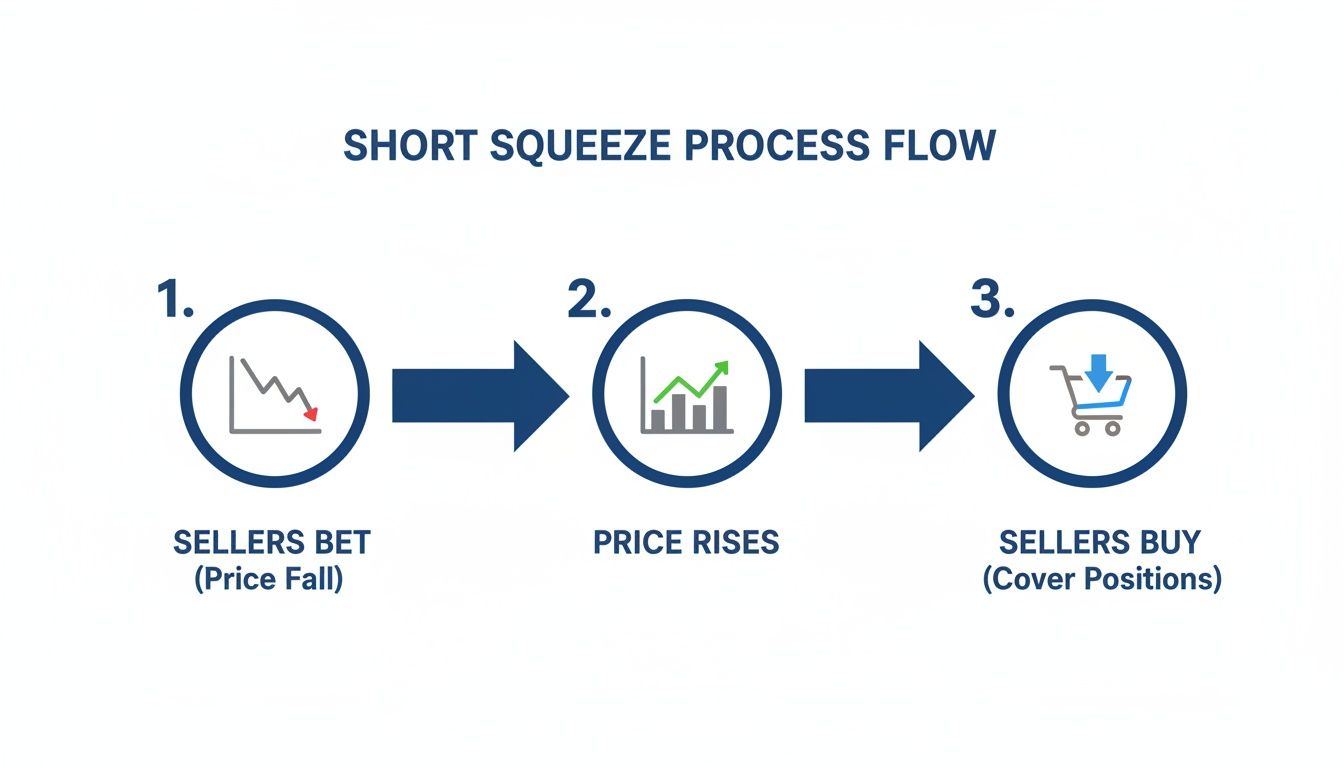
This flowchart nails the basic lifecycle: the initial bet against the stock, the surprise rally that proves the shorts wrong, and the final panic-buying as they scramble to get out. It's a powerful chain reaction where forced buying from one group of traders fuels the profits of another, pouring gasoline on the fire.
The Role of High Short Interest
The absolute most critical ingredient for a squeeze is high short interest. This number tells you how many shares have been sold short but haven't been bought back yet. It's usually shown as a percentage of the company's "float"—the total shares available for public trading.
A low short interest, maybe under 10%, is just normal, healthy market activity. But when that number starts creeping above 20%, it's a huge red flag. It means a ton of traders are all crowded into the same bearish bet, and they'll all be rushing for the same tiny exit if the trade goes against them. For a deeper dive, check out our guide on unlocking short interest to float as a trading tool.
The higher that percentage gets, the more vulnerable the stock is to a squeeze. All it takes is a little bit of good news to trigger a massive buying frenzy from all those panicked short sellers.
The Rising Cost to Borrow
Another metric to watch is the cost to borrow, or borrow rate. This is simply the fee that short sellers have to pay their broker to borrow the shares in the first place. Like anything else, the rate is all about supply and demand.
Think of it this way: if hardly anyone is willing to lend out their shares, but tons of people want to borrow them to short, that borrowing fee is going to shoot up.
- Low Borrow Rate: Plenty of shares are available to short, and there isn't much bearish demand.
- High Borrow Rate: Shares are getting scarce, and short sellers are piling in. A rate above 10% is high, and in a truly wild situation, it can skyrocket past 100% annually.
A spiking borrow rate is like a tax on being short. It makes holding the position more painful and expensive every single day, which can force shorts to give up and cover.
Key Takeaway: A rising cost to borrow is a direct financial penalty for short sellers. It adds a sense of urgency, pressuring them to close their positions and adding more fuel to the squeeze.
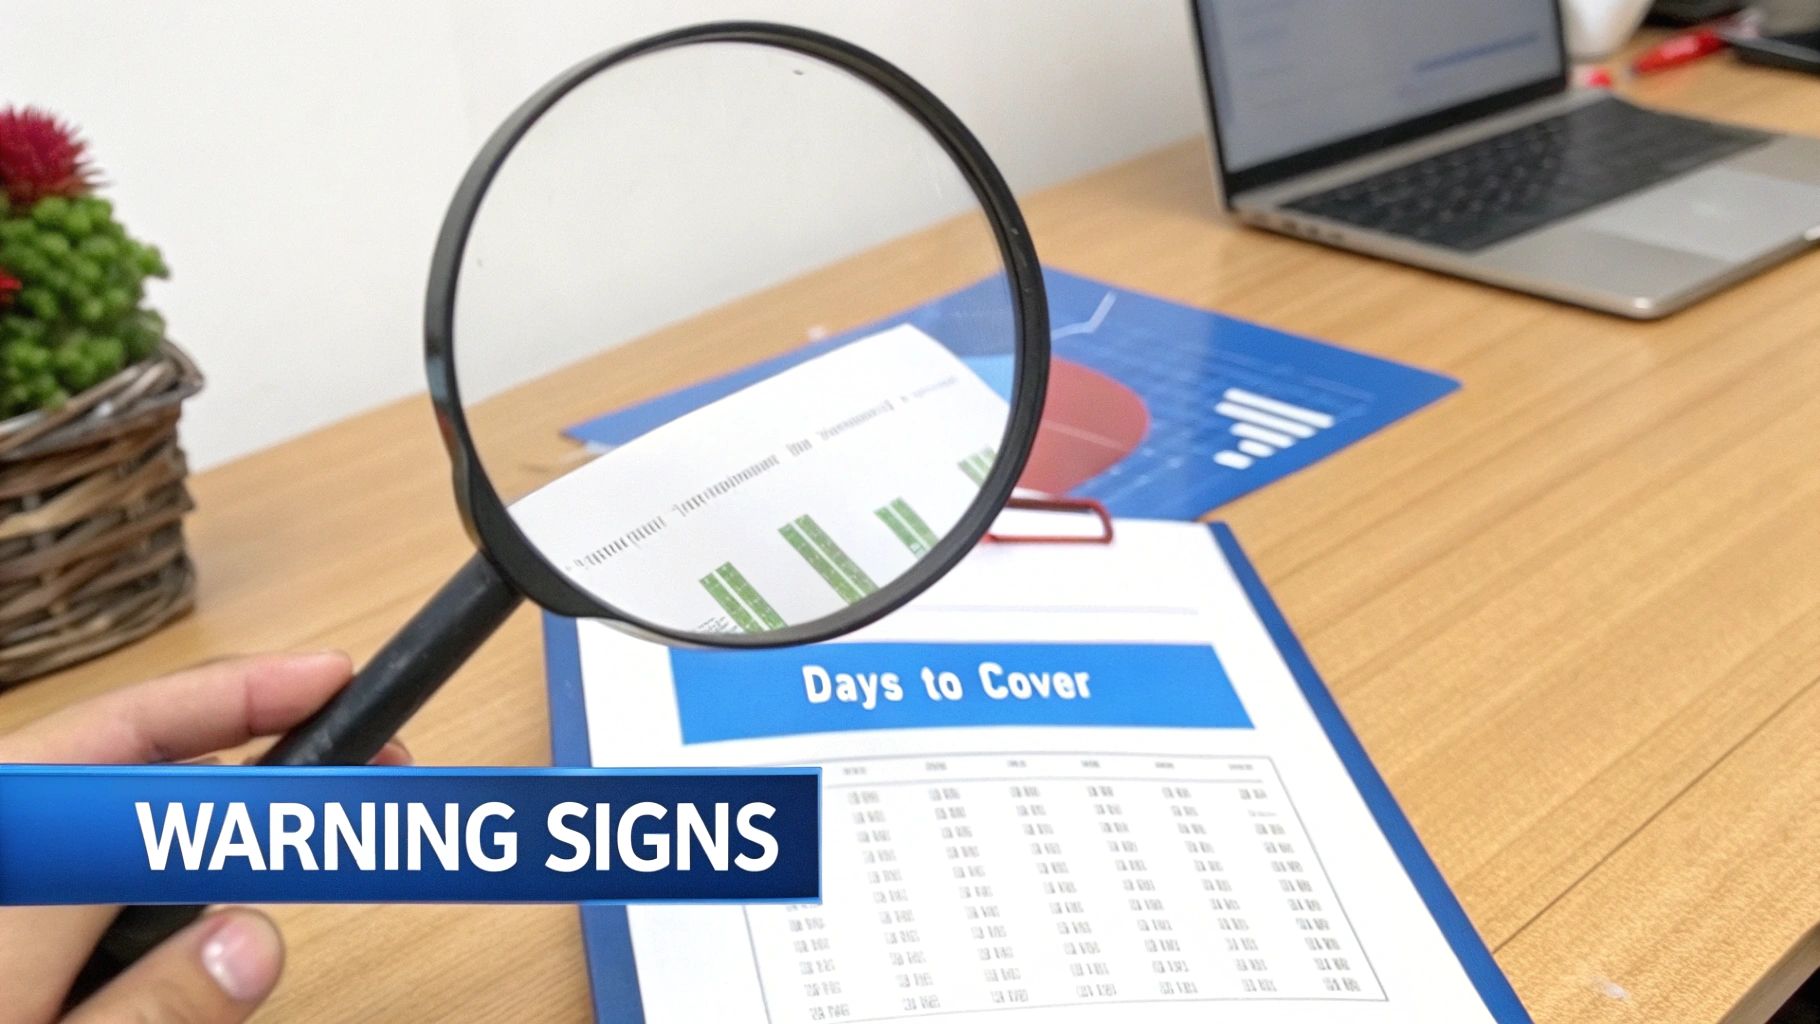
Measuring the Panic with Days to Cover
While short interest tells you how many people are in a crowded theater, days to cover tells you how small the exit door is. This metric, also called the short interest ratio, estimates how many days it would take for every short seller to buy back their shares, based on the stock’s average daily trading volume.
The calculation is simple: just divide the total number of shorted shares by the average daily trading volume.
Imagine a million shorted shares is like a million cars stuck in a traffic jam. If the highway can only handle 100,000 cars a day (the average volume), it would take 10 days to clear the jam. That's your "days to cover." A high number—typically anything over 10 days—is a warning sign. It means that if shorts start running for the exit, the buying pressure could last for a long, long time because there isn't enough normal trading volume to absorb all their buy orders.
The Ultimate Trigger: Margin Calls
The final, and most brutal, mechanic is the margin call. When a short seller's trade goes badly against them, the losses rack up in their brokerage account. If those losses get too big, the broker steps in with a margin call, demanding that the trader either deposit more cash immediately or close the position.
This isn't a polite request—it's a forced liquidation. If the trader can't pony up the cash, the broker will automatically start buying back shares for them, at whatever the market price is.
Now, imagine thousands of traders getting margin called all at once. This creates a waterfall of forced buying that sends the stock's price parabolic. This is the moment a squeeze hits its chaotic, explosive peak.
How to Spot the Warning Signs of a Squeeze
Catching a short squeeze before it takes off is the holy grail for a lot of traders. While there's no magic formula, a few specific data points can paint a pretty clear picture of a stock that's about to blow. Think of it like being a detective gathering clues; a single clue might not mean much, but when you have several pointing to the same conclusion, you know you're onto something big.
These warning signs aren't hidden secrets. They're just quantitative measures of tension building up in the market. When you see a handful of these indicators all flashing red at the same time, it’s a strong signal that the stage is set for a violent move higher. The trick is knowing what to look for and how to put the pieces together.
The Foundational Clue High Short Interest
The absolute number one sign is high short interest. This metric tells you exactly what percentage of a company’s available shares (its float) are currently being shorted. A short interest under 10% is business as usual. But once that number starts creeping over 20%, the stock officially enters the danger zone.
Think of it like too many people crowding onto one side of a small boat—it gets dangerously unbalanced. When you see short interest hit 30% or more, which happens with some of the more speculative names out there, the situation is incredibly fragile. Even a tiny piece of good news could be enough to flip the whole thing over.
Analyzing the Pressure Cooker Metrics
Beyond just the raw short interest percentage, a few other metrics can tell you just how much heat the short sellers are feeling. These data points give you a much richer context and show how explosive the situation could get.
-
Elevated Days to Cover: This number, sometimes called the short interest ratio, is a direct measure of how trapped the shorts really are. A ratio over 10 is a major red flag. It means it would take more than two full trading weeks for every single short seller to buy back their shares and get out, assuming average trading volume. This creates a massive traffic jam where any rush for the exits is guaranteed to cause a pile-up, forcing prices higher and higher.
-
Spiking Cost to Borrow: When the fee to borrow shares for shorting starts shooting up, it’s a dead giveaway that shares are getting scarce. A jump in the borrow rate is like a daily tax on short positions, making it financially painful to stick with the trade. If you see rates climbing into the double digits, pay attention. In extreme cases, they can skyrocket past 100% annually, basically forcing shorts to give up and cover their positions.
A stock with high short interest, a days-to-cover ratio over 10, and a rapidly increasing cost to borrow is a textbook short squeeze candidate. The presence of all three signs creates a highly combustible environment where any spark can lead to an explosion.
To give you a clearer picture, here are the metrics that should be on every trader's radar when hunting for squeeze plays.
Key Indicators for a Potential Short Squeeze
This table summarizes the primary metrics traders use to identify stocks at risk of a short squeeze, along with the levels that typically signal high alert.
| Metric | What It Measures | High-Risk Threshold |
|---|---|---|
| Short Interest | Percentage of a company’s float sold short. | > 20% |
| Days to Cover | How many days it would take short sellers to exit their positions based on average trading volume. | > 10 Days |
| Cost to Borrow Rate | The annualized interest rate charged to borrow shares for shorting. | > 10% and rising sharply. |
| Insider Buying | Purchases of company stock by its own executives or directors. | Any significant, un-scheduled buys. |
| High Institutional Ownership | Percentage of shares held by large funds and institutions, which reduces the available float. | > 70% |
Watching these numbers is crucial, but remember that a high reading on one metric isn't a guarantee. The most potent setups occur when several of these indicators are flashing warning signs simultaneously.
The Indispensable Role of a Catalyst
All the data in the world won't trigger a squeeze on its own; you need a catalyst. A catalyst is an event that flips the script and forces short sellers to second-guess their entire bearish argument. Without one, a heavily shorted stock can just drift sideways for months, bleeding short sellers slowly through borrow fees but never truly exploding.
A powerful catalyst can pop up from anywhere:
- Fundamental News: An earnings report that blows past expectations, a huge new contract announcement, or a biotech firm getting FDA approval can completely rewrite the company’s story overnight.
- Technical Breakouts: Sometimes, all it takes is for the stock price to punch through a major resistance level on the chart. This can trigger a cascade of stop-loss orders from shorts and pull in momentum traders, creating a self-feeding frenzy.
- Social Media Hype: As we all saw with GameStop, a wave of coordinated buying from retail traders, often organized on platforms like Reddit, can generate enough buying pressure to completely overwhelm the short sellers.
These catalysts are the match that lights the fuse. By keeping an eye on the key indicators and watching for a compelling trigger, you can move your understanding of what is a short squeeze from a textbook definition to a powerful, actionable trading strategy.
Learning from Two Legendary Short Squeezes
Theory is one thing, but watching a short squeeze play out in the real world is where you see the true chaos and power behind the numbers. The market is littered with dramatic stories of short sellers getting caught on the wrong side of history. Two of these tales, however, stand out as legendary examples of how different forces can ignite an epic squeeze.
These case studies—one a full-blown retail rebellion, the other a stealthy corporate power play—bring abstract concepts like short interest, catalysts, and pure panic to life. They prove that a squeeze can come from anywhere, catching even the most seasoned Wall Street pros completely off guard.
The Retail Rebellion: GameStop in 2021
You can't talk about short squeezes without talking about GameStop (GME). In early 2021, the video game retailer became ground zero for a historic clash between everyday investors and giant hedge funds, and the market hasn't been the same since.
For years, Wall Street wrote off GameStop as a dinosaur—a brick-and-mortar relic doomed to fail in a digital world. Hedge funds piled in, shorting the stock into oblivion. The bearish sentiment was so extreme that short interest peaked at an unbelievable 140% of the company's float. That means more shares were shorted than were even available to trade.
This created a powder keg, and a group of retail traders on Reddit’s WallStreetBets forum lit the match. They kicked off a massive, coordinated buying campaign that sent the stock from under $20 to a split-adjusted peak of over $120 on January 28—a jaw-dropping surge of more than 2,000% in just a few weeks. Short sellers, like the prominent hedge fund Melvin Capital, were steamrolled. Melvin Capital suffered catastrophic losses and needed a $2.75 billion bailout after its portfolio tanked 53% in January alone. You can dive deeper into this historic event and its fallout by reading the full analysis of the GME short squeeze.
The GameStop saga was a perfect storm, built on three key pillars:
- Extreme Short Interest: At 140%, the short interest was a massive red flag signaling a dangerously overcrowded trade just waiting to blow up.
- A Vocal Catalyst: The coordinated buying from WallStreetBets was the spark, fueled by a powerful narrative of Main Street taking on Wall Street.
- The Gamma Squeeze: The rally was supercharged by a gamma squeeze. A flood of call option purchases forced market makers to buy GME shares to hedge their positions, pouring even more gasoline on the fire.
GameStop became a powerful lesson in how a decentralized group of investors, armed with a compelling story and social media, could exploit extreme market positioning to trigger a historic squeeze.
The Corporate Power Play: Volkswagen in 2008
Long before GameStop, the financial world witnessed what many still consider the mother of all short squeezes, starring the German automaker Volkswagen. This event wasn't fueled by Reddit memes but by a quiet, calculated corporate maneuver that took everyone by surprise and briefly made Volkswagen the most valuable company on the planet.
The setup was straightforward: hedge funds were convinced Volkswagen's stock was overvalued, so they shorted it heavily. The problem? They had no idea that another car company, Porsche, was secretly building a massive stake in Volkswagen with the goal of a takeover. Porsche used complex financial instruments—cash-settled options—to quietly gain control over a huge chunk of VW's shares without having to disclose its growing position.
On a Sunday in October 2008, the trap was sprung. Porsche shocked the markets by announcing it now controlled 74.1% of Volkswagen's voting shares. With another 20% locked up by the German state of Lower Saxony, only about 6% of the company’s float was actually left for trading.
Short sellers, who had borrowed and sold roughly 12% of the stock, had a sudden, horrifying realization: there weren't nearly enough shares available for them to buy back and close their positions. What followed was pure, unadulterated panic.
The next two trading days were utter chaos. Volkswagen's stock price went vertical, rocketing from around €210 to over €1,000 at its peak. The squeeze was so violent that Volkswagen's market cap briefly shot past Exxon Mobil's, making it the most valuable company in the world. All told, hedge funds lost an estimated $30 billion, with many wiped out completely.
The differences between these two events highlight just how diverse squeezes can be:
| Feature | GameStop (2021) | Volkswagen (2008) |
|---|---|---|
| Driving Force | Retail investor rebellion (WallStreetBets) | Strategic corporate maneuver (Porsche) |
| Catalyst | Social media hype and coordinated buying | Surprise announcement of a controlling stake |
| Transparency | Publicly discussed on open forums | Built up in secret using options |
| Primary Target | Hedge funds with a public bearish thesis | Hedge funds caught in a corporate play |
These two legendary squeezes, though driven by completely different forces, hammer home the same core principle of what is a short squeeze: a catastrophic imbalance between the demand for shares to buy and the actual supply available. Whether the pressure comes from a Reddit army or a rival corporation, the end result is a violent price surge that leaves a trail of financial destruction in its wake.
Trading a Squeeze Without Getting Burned

Let's be clear: trying to trade a short squeeze is like trying to ride a tidal wave. The upside is massive, but the odds of getting crushed are just as high. This isn't a place for casual trading; it’s a high-stakes environment that demands a calculated strategy, ironclad discipline, and a healthy respect for volatility.
The allure of a stock going parabolic is powerful, and it pulls in traders who are terrified of missing out (FOMO). But navigating these moves successfully requires a professional mindset that puts risk management above everything else. Without a plan, you're not trading—you're just gambling.
Defining Your Strategy and Entry Points
Timing an entry is brutally difficult. Jump in too early, and your capital could be dead money for weeks while the stock does nothing. Jump in too late, after the rocket has already launched, and you’re likely buying the top right as the early birds are cashing out.
A common approach is to wait for a clear confirmation signal. This could be a technical breakout above a key resistance level on huge volume, which often acts as the starting gun for the squeeze. Waiting for that kind of move confirms that momentum is real and can save you from getting stuck in a stock going nowhere.
The Non-Negotiables of Risk Management
Before you even think about hitting the "buy" button, you need a bulletproof risk management plan. When a squeeze is in full swing, emotions are haywire, and your pre-defined plan is the only thing that will keep you grounded.
These three rules are absolutely essential:
- Strict Position Sizing: Never, ever go all-in on a squeeze play. The chances of a catastrophic failure are simply too high. Only allocate a small percentage of your portfolio that you are fully prepared to lose without it wrecking your financial stability.
- Use Hard Stop-Loss Orders: A stop-loss is your eject button. It automatically sells your position if the price falls to a specific level, putting a cap on your losses. In a squeeze, prices can drop 50% or more in minutes. A "mental stop" is completely useless here.
- Have a Clear Exit Plan: Know exactly where you plan to take profits before you enter the trade. Decide in advance at what price levels you will sell part or all of your position. Greed is your worst enemy; failing to take profits can turn a spectacular win into a devastating loss when the squeeze inevitably collapses.
Trader's Axiom: In a short squeeze, your entry point determines your potential profit, but your exit strategy determines whether you actually realize it. Never enter a trade without knowing exactly where you will get out, both for a win and for a loss.
The Ultimate Mistake: Shorting a Squeeze
If going long on a squeeze is risky, then trying to short a stock that's already squeezing is financial suicide. As a stock goes parabolic, it’s tempting to bet against it, thinking, "what goes up must come down." This is a classic, account-blowing trap.
Remember, when you buy a stock, the most you can lose is what you invested. When you short a stock, your potential loss is infinite. There is no ceiling on how high a squeezed stock can go, and trying to call the top can wipe out your entire account and leave you in debt. Legendary squeezes have vaporized hedge funds; they can certainly do the same to an individual trader.
All the theory in the world is great, but putting it to work with the right tools is what separates the pros from the rest. This is where a platform like ChartsWatcher comes in, turning the hunt for a potential short squeeze from a manual, needle-in-a-haystack job into a sharp, systematic process. Instead of guessing, you’re using hard data to find stocks feeling the pressure.
A dedicated stock scanner lets you sift through thousands of stocks in real-time, looking for the exact conditions we've been talking about. You can build a custom screen that only shows you stocks with, say, short interest over 20%, a days-to-cover ratio above 10, and a cost to borrow that's spiking. Just like that, you've cut through the noise and are left with a watchlist of prime candidates.
Here’s a glimpse of the ChartsWatcher interface, where you can dial in these exact filters.
The screenshot shows how you can arrange multiple windows—like alerts, toplists, and news—to keep an eye on all the key metrics for potential squeezes in a single, clean view.
Automating Your Search with Alerts
Scanning is just the first step. The real magic happens when you automate your monitoring with alerts. You can set up ChartsWatcher to ping you the second a stock on your watchlist breaks through a key resistance level or gets hit with an unusual spike in volume. Think of it as an early warning system that a catalyst is hitting the fuse.
By layering fundamental metrics like high short interest with real-time technical alerts, you build a powerful system for spotting high-probability squeeze setups before they hit the mainstream radar.
This completely flips your strategy from being reactive to proactive. You’re no longer chasing rockets after they’ve already launched. Instead, you're systematically watching the market for the key ingredients of a squeeze, putting yourself in the perfect position to act when the moment is right.
Short Squeeze FAQs
Even after you get the hang of the mechanics, the sheer chaos of a short squeeze can leave you with a few lingering questions. Let's clear up some of the most common ones.
Is It Legal to Cause a Short Squeeze?
Yes, the act of buying a stock is perfectly legal, even if it contributes to a squeeze. There's nothing illegal about spotting a heavily shorted company and deciding to buy shares.
The legal lines start to get blurry when it comes to outright market manipulation. Spreading false information to pump a stock's price, for instance, is a big no-no. Regulators are looking for deliberate deception, not just a bunch of people buying a stock they believe in.
How Often Do Short Squeezes Actually Happen?
True, explosive, headline-grabbing short squeezes are pretty rare. They need a perfect storm of conditions to ignite: sky-high short interest, a tiny float, and a powerful, unexpected catalyst that completely changes the story.
Smaller-scale squeezes and short covering rallies happen more often, but the legendary ones are few and far between.
Research shows that major short squeezes are potent but infrequent, happening on only 0.94% of trading days for heavily shorted U.S. stocks between 2011 and 2014. On those days, however, the most squeeze-prone stocks beat the rest of the shorted market by an average of 0.12%. You can read the full research on short squeeze frequency to dig into the data.
What Is the Difference Between a Short Squeeze and a Gamma Squeeze?
This is a great question because they often happen at the same time, but they're driven by different engines.
A short squeeze is all about short sellers buying back stock to close their losing bets. A gamma squeeze comes from the options market.
It kicks off when there's a massive surge in call option buying. This forces market makers (the ones who sold the calls) to buy the underlying stock to hedge their position. All that forced buying adds an incredible amount of fuel to the fire, making an existing short squeeze even more violent.
Can Any Stock Be Squeezed?
Theoretically, yes—any stock with short sellers is a candidate. In reality, the odds vary wildly. The stocks most vulnerable to a squeeze usually have a few things in common:
- High Short Interest: Think 20% of the float or higher.
- Small Float: Fewer shares available means it's easier for buying pressure to overwhelm the sellers.
- High Days to Cover: A ratio over 10 suggests shorts could get trapped trying to exit their positions.
- Strong Catalyst: Some piece of news that flips the script and gets buyers excited.
Trying to squeeze a large-cap stock with a float in the billions is a monumental task. It would take an astronomical amount of capital to make a real dent in the price.
Identifying these unique market setups requires powerful tools that can filter through the noise. ChartsWatcher provides real-time scanning and alerting capabilities, allowing you to monitor for high short interest, unusual volume, and the exact technical breakouts that often signal the start of a squeeze. Take your analysis to the next level by visiting https://chartswatcher.com.
