What Is a Doji Candlestick and How to Trade It
A Doji candlestick is one of the most powerful signals you’ll see on a chart. It screams indecision. In its simplest form, a Doji is a candle where the open and close prices are virtually identical, giving it a distinct cross-like shape. This pattern tells us there’s a fierce tug-of-war going on between buyers and sellers, and right now, nobody is winning. Think of it as a sign that the current trend might be running out of gas, setting the stage for a potential pause or reversal.
Unpacking the Story of a Doji Candlestick
Imagine two armies clashing on a battlefield all day long, pushing back and forth. By sunset, they end up exactly where they started—no ground gained, no ground lost. That’s precisely what a Doji candlestick shows us in the market. It’s a single candle, but it packs a dramatic story of conflict and equilibrium.
The unique look of a Doji is what makes it so revealing. Most candles have thick, colored bodies, but a Doji’s body is just a thin, horizontal line. This happens because the price opened and closed at almost the exact same level for that period. Even if the price shot way up or plunged way down during the session (creating long wicks), the final score was a tie.
The Psychology Behind the Pattern
To really understand a Doji, you need to think less about its shape and more about the market psychology it represents. This one little candle signals a moment of profound uncertainty. It’s telling you that the conviction driving the previous trend, whether it was bullish or bearish, is starting to waver.
- During an uptrend: A Doji suggests buyers are losing their grip and sellers are digging in their heels, stopping the upward push.
- During a downtrend: It signals that sellers are getting exhausted and buyers are finally starting to fight back.
The Doji isn’t some newfangled indicator; it has deep roots in 18th-century Japan. The legendary rice trader Munesuke Homma developed candlestick charting to get an edge, and the Doji quickly became his go-to symbol for a market in perfect balance. To get the full picture on its history and how to read these charts, check out our guide to understanding candlestick graphs. Nailing down these fundamentals is crucial for any serious technical trader.
A Doji is the market taking a deep breath. It's a moment of quiet indecision before the next major move. Ignoring this signal is like ignoring a pause in a conversation—you might miss the most important part of the story.
Ultimately, this pattern is a critical heads-up. It's not a trade signal all by itself, but rather a warning flag that the market's momentum could be shifting. When you see a Doji, it’s time to pay close attention and wait for the next candle to confirm where the price might be headed next. That’s how you turn a simple observation into a real trading opportunity.
For a quick reference, here's a breakdown of what each part of the Doji tells you about the market's state of mind.
Doji Candlestick at a Glance
| Component | Appearance | Market Psychology Interpretation |
|---|---|---|
| Thin Body | The open and close prices are nearly the same, forming a line. | A perfect stalemate between buyers and sellers; signifies pure indecision. |
| Upper Wick | The long shadow extending above the body. | Represents the session's high, showing how far buyers pushed before sellers took back control. |
| Lower Wick | The long shadow extending below the body. | Represents the session's low, showing how far sellers pushed before buyers stepped in. |
This table helps illustrate how the Doji visually captures the balance of power—or lack thereof—in a single trading period. It’s the visual cue for a market on the verge of making its next big decision.
Mastering the Four Types of Doji Candles
While all Doji candles signal indecision, they don’t all tell the same story. Think of them as a family of patterns, each with its own personality and message about the market's inner conflict. Understanding these variations is the key to moving beyond simply spotting a Doji to truly interpreting what the market is trying to tell you.
By looking closely at the length and position of the wicks, we can uncover a much deeper narrative about the battle between buyers (bulls) and sellers (bears). Each type offers a unique clue about which side might be gaining the upper hand, even when the final score looks like a tie.
This concept map breaks down the core conflict a Doji represents—a tug-of-war where bulls and bears fight to a standstill.
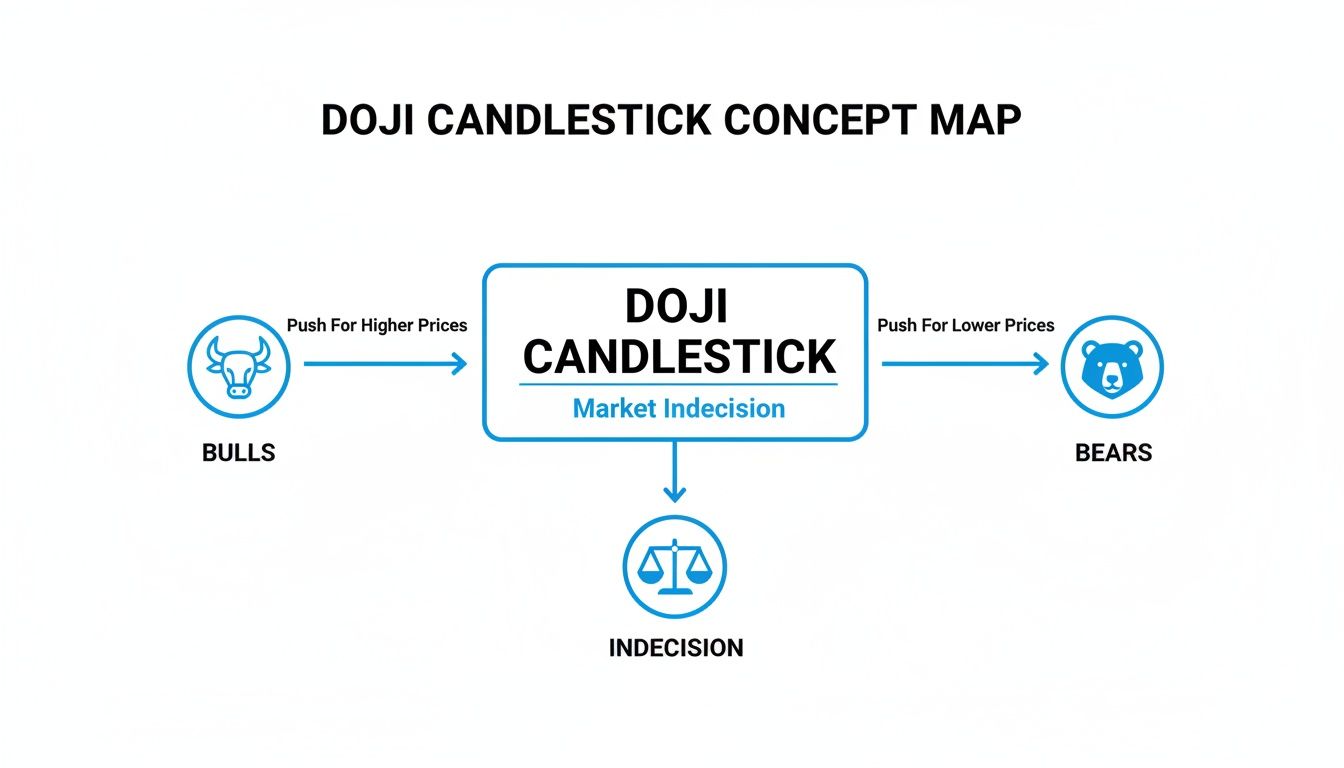
When buying and selling pressures cancel each other out, the result is equilibrium. That's precisely what a Doji pattern screams from a chart.
The Standard or Neutral Doji
The Standard Doji is your classic indecision candle, looking like a simple plus sign (+). It has short, relatively equal upper and lower wicks, showing pure, unadulterated hesitation.
During the trading session, neither the bulls nor the bears could gain any real ground before being shoved right back to the opening price. It’s a signal of a temporary truce and perfect balance, often popping up during periods of market consolidation.
The Long-Legged Doji
Now, imagine that tug-of-war getting far more intense. The Long-Legged Doji has noticeably longer upper and lower wicks, which tells you the session was a period of extreme volatility where the price swung wildly in both directions.
Despite the chaotic price action, the session still closed right back where it started. Even after a fierce battle, the market remains deeply uncertain about what's next. This pattern suggests that while volatility is high, traders have no clear conviction, making it a much stronger signal of indecision than the standard Doji.
The Dragonfly Doji: A Sign of Bullish Hope
The Dragonfly Doji is a powerful pattern that looks like the letter "T." It forms when the open, high, and close prices are all squished together at the top of the session's range, leaving a long lower wick and almost no upper wick.
This candle tells a very specific story:
- Sellers initially took control, pushing the price down hard.
- But then, buyers staged a massive comeback, driving the price all the way back up to its opening level.
The Dragonfly Doji is like a spring being compressed and then released. The market aggressively rejected lower prices, showing that strong buying pressure is lurking just below the surface. When one of these appears at the bottom of a downtrend, it’s a potent signal that a bullish reversal could be just around the corner.
The Gravestone Doji: A Warning for Bulls
As its ominous name suggests, the Gravestone Doji is the bearish twin of the Dragonfly. It looks like an inverted "T," forming when the open, low, and close are all near the bottom of the session's range. It has a long upper wick and little to no lower wick.
Here’s the story it tells:
- Buyers started the session strong, pushing the price significantly higher.
- But the sellers stormed back in, completely overwhelming the buyers and forcing the price all the way back down to its open.
This pattern is a stark warning, especially when it shows up after a strong uptrend. It’s a visual representation of the market rejecting higher prices and suggests that sellers are seizing control. Think of it as a gravestone marking the potential "death" of the current uptrend—a crucial bearish reversal signal that traders watch for like a hawk.
How to Read Dojis as Reversal Signals
Spotting a Doji is the easy part. The real skill is learning to interpret what it’s telling you about a potential turning point in the market. A Doji isn't just a pause; think of it as a flare going up, signaling that the battle between buyers and sellers has reached a fever pitch, and a power shift might be imminent.
The story a Doji tells depends entirely on where you find it.
Imagine a general surveying a battlefield. The same troop formation means one thing on an open plain but something completely different at the top of a strategic hill. It's the same with a Doji. Its meaning changes dramatically based on where it appears in a trend. Context is everything.
A Doji that pops up after a long, sustained uptrend is a serious red flag for the bulls. It screams that their momentum is sputtering. On the flip side, when a Doji appears at the bottom of a nasty downtrend, it’s a sign that sellers are finally getting exhausted.
The Critical Role of Location
The psychology here is simple but incredibly powerful. A trend needs conviction to keep running. A Doji is the visual proof that conviction is cracking.
It’s that brief moment of equilibrium where the dominant force—whether buyers or sellers—suddenly slams into an equal and opposite force, grinding the price to a halt. This is why understanding Dojis is a core part of identifying reversal signals, like a Bitcoin bottom alert.
This standoff often happens right before one side gives up, leading to a sharp move in the opposite direction.
Dojis at Trend Extremes
Dojis carry the most weight when they show up at significant market tops or bottoms, marking the potential exhaustion point of a move.
-
Bearish Reversal (At the Top): After a string of strong green candles, a Gravestone Doji is a particularly ominous sign. It shows buyers tried to push higher but were brutally rejected by sellers, who shoved the price right back down to the open.
-
Bullish Reversal (At the Bottom): Following a painful downtrend, a Dragonfly Doji can be a ray of hope. It tells you sellers attempted to drag the price lower, but a wave of buyers stepped in, absorbed all the selling pressure, and drove the price back up.
You see these patterns play out time and again. A single Gravestone Doji appearing at a key resistance level during a roaring uptrend can be the first concrete warning of a top. When you dig into the data, these patterns are surprisingly effective at pinpointing reversals. To see how Dojis fit in with other powerful signals, check out our guide on the 7 candlestick reversal patterns every trader should know.
Crucial Takeaway: A Doji signals indecision, not a guaranteed reversal. It’s a warning shot, not the final verdict. The real signal comes from the candle that follows.
Never, ever trade a Doji in isolation. It’s a powerful clue that the market's internal dynamics are shifting, but it's just one piece of the puzzle. Smart traders use the Doji as a prompt to pay closer attention, wait for confirmation from the next candle, and then look to enter a high-probability setup. That patience is what separates the pros from the gamblers.
Using Confirmation to Trade Dojis Effectively
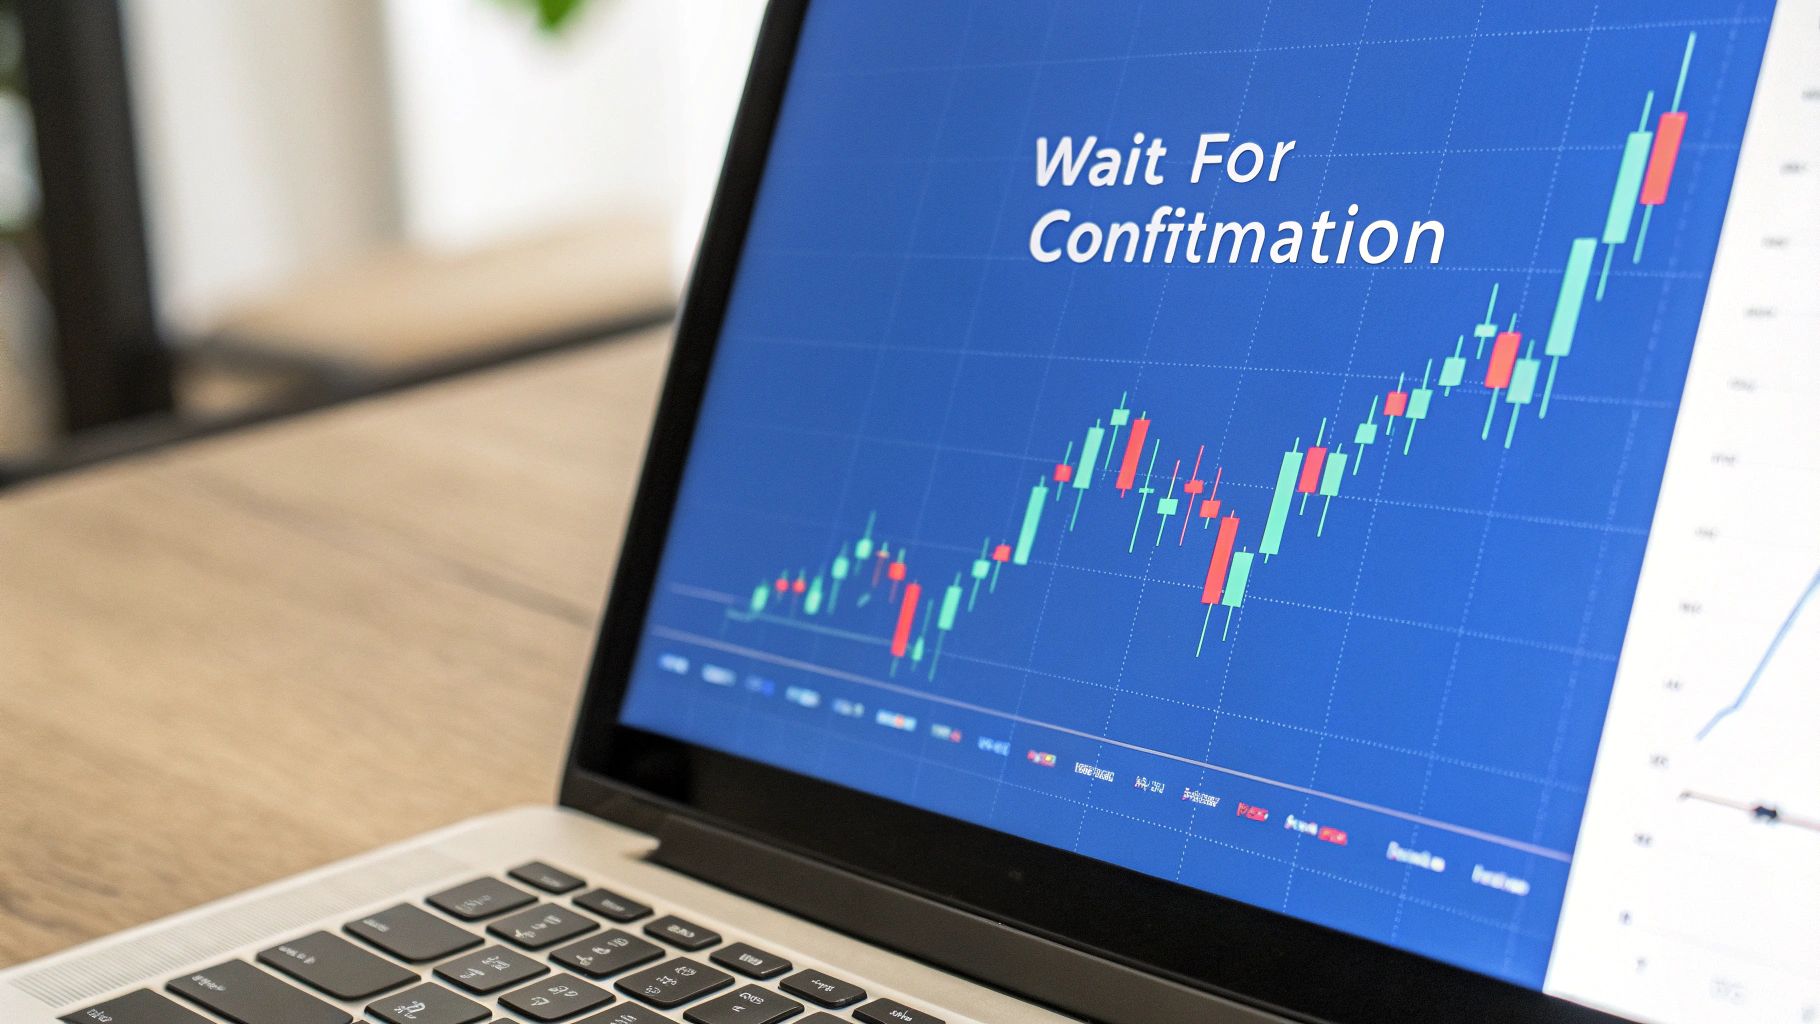 Seeing a Doji pop up on your chart is like hearing a single clap of thunder. It gets your attention, but you wouldn't run for cover without first checking the sky for storm clouds. A Doji is just that—a warning shot, a signal of pure market indecision. It’s not an order to buy or sell.
The single biggest mistake I see traders make is jumping the gun and trading the Doji itself. The real signal isn't the Doji; it's the candle that forms right after it. That next candle is your confirmation. It’s the market showing its hand and telling you which side won the battle.
The Power of The Confirmation Candle
Think of the Doji as the market asking a question: "Is this trend running out of steam?" The very next candle is the answer. Its direction and momentum tell you everything you need to know.
-
Bullish Confirmation: You're in a downtrend, and a Doji appears. The next candle is a strong, decisive green one that closes well above the Doji's high. That’s your green light. It shows that buyers have soaked up all the selling pressure and are now firmly in control.
-
Bearish Confirmation: The price has been climbing, and a Doji forms at the top. If the next candle is a powerful red one that closes significantly below the Doji's low, that's your cue to be cautious. It confirms sellers have overwhelmed the buyers and are getting ready to push the price down.
Without waiting for this confirmation, you're just gambling. Patience is your best friend here. Waiting one more candle transforms a 50/50 guess into a calculated, strategic entry.
A Doji candlestick tells you to pay attention. The confirmation candle tells you when to act. This simple distinction is the bedrock of every successful Doji trading strategy.
Stacking The Odds With Confluence
While the confirmation candle is your primary trigger, the sharpest traders don’t stop there. They look for confluence, which is just a fancy way of saying they layer multiple, independent signals that all point to the same outcome. It’s how you filter out weak setups and stack the odds in your favor.
To trade Dojis well, you also need to know how they fit into your broader strategy. For instance, in swing trading, a Doji at a key level can be a powerful entry signal. Checking out the [best stocks for swing trading](https://www.openswingtrading.com/blog/best-stocks for swing trading) can give you great context on how these patterns play out in bigger moves.
Here are the most powerful confirmation factors to look for alongside a Doji:
-
Trading Volume: A big spike in volume on either the Doji or the confirmation candle gives the signal serious weight. High volume proves a real fight took place, making the outcome that much more meaningful.
-
Support and Resistance Levels: A Doji that forms right at a key support or resistance level is a classic, high-probability setup. A Dragonfly Doji bouncing perfectly off a 200-day moving average is a much stronger buy signal than one floating in the middle of nowhere.
-
Technical Indicators: Pairing a Doji with an oscillator like the RSI or Stochastics can be incredibly effective. A Gravestone Doji at the peak of an uptrend is a decent signal. But if the RSI is also screaming "overbought" (above 70), it becomes a much more compelling reason to sell.
This layering of evidence is how you build a rock-solid case for a trade. Think about this: a Doji’s predictive power is most potent at trend extremes. One study showed its effectiveness can climb to a 78% hit rate when combined with a Stochastic indicator showing an oversold reading below 20. That’s the power of confluence in action.
To help you tell the difference between a weak signal and a strong one, I've put together a quick checklist.
Doji Confirmation Signal Checklist
| Confirmation Factor | Low-Probability Signal (Warning Sign) | High-Probability Signal (Trade Trigger) |
|---|---|---|
| Context | Appears in choppy, sideways price action. | Forms at the peak of an uptrend or bottom of a downtrend. |
| Confirmation Candle | The next candle is small and indecisive. | The next candle is strong, long, and closes decisively. |
| Volume | Volume is low or declining on the Doji and confirmation. | A significant spike in volume confirms the price move. |
| Key Levels | The Doji is floating in the middle of a price range. | The Doji forms directly on a major support/resistance level. |
| Indicator Signal | Indicators (like RSI) are neutral (around 50). | Indicators show overbought (>70) or oversold (<30) conditions. |
Always look for the high-probability signals. When you see multiple factors from that right-hand column lining up, your odds of a successful trade go way up. If you're mostly seeing signs from the left-hand column, it's best to stay on the sidelines.
Finding Doji Setups with ChartsWatcher
Knowing what a Doji is and actually making money from it are two different things. The real challenge isn't just spotting one; it's finding the high-probability setups in real-time across hundreds, if not thousands, of stocks.
Let's be honest, manually flipping through charts is a surefire way to get decision fatigue and miss the best moves. This is exactly where automation becomes a trader's best friend. Instead of hunting for patterns one by one, you can build a system that brings the A+ setups directly to you.
A tool like ChartsWatcher lets you turn all the theory we've discussed into an automated, actionable trading edge.
Building Your Custom Doji Scanner
The first step is to teach your scanner exactly what you’re looking for. Think of it as creating a digital assistant whose only job is to sift through market noise and find your ideal trade. In ChartsWatcher, you can build a custom filter that defines the precise anatomy of a Doji.
You can set a rule to find candles where the body is just a tiny sliver—for example, less than 5% of the total candle's range (from high to low). This one simple rule instantly weeds out thousands of irrelevant candles and zeroes in on moments of true market indecision.
From there, you can layer on more conditions to refine your search, turning basic pattern theory into a real-time notification system that works for you.
A basic Doji definition is just the start. The real power comes from adding the confirmation factors we’ve covered. This is how you separate random noise from truly actionable signals. Your scanner shouldn't just find Dojis; it should find high-probability Dojis.
Here’s how you can stack layers of confluence directly into your scanner rules:
- Volume Spike: Add a rule that volume on the Doji or confirmation candle must be at least 150% of its 20-period average.
- Proximity to Key Levels: Filter for Dojis that form within 1% of a major moving average, like the 50-day or 200-day SMA.
- Indicator Confirmation: Tell the scanner to only flag a Gravestone Doji if the RSI is simultaneously above 70 (overbought).
By combining these rules, you're no longer just pattern hunting. You are building a comprehensive trading strategy that automatically screens the entire market for setups that meet your strict, pre-defined criteria.
Setting Up Instant, Actionable Alerts
Once your scanner is built to your liking, the final piece of the puzzle is making sure you never miss an opportunity. Manually checking a scanner all day is just as bad as checking individual charts. The goal is automation that frees you up to analyze and execute.
With ChartsWatcher, you can set up your custom scan to trigger instant alerts. These can be sent right to your desktop, email, or phone the moment a stock ticks all your boxes.
For instance, you could create an alert named "Bullish Reversal Signal" that fires off only when:
- A Dragonfly Doji forms at the bottom of a clear downtrend.
- The pattern appears on or very near a known support level.
- The RSI indicator is below 30 (oversold).
When that specific combination of events happens on any stock you're watching, you get pinged immediately. This system does all the heavy lifting, allowing you to react quickly and decisively when a prime trading opportunity appears. It turns your knowledge of what a Doji is into a systematic, repeatable process for finding—and acting on—them.
Common Doji Trading Mistakes to Avoid
Spotting a Doji on a chart is a great first step, but honestly, a little knowledge can be a dangerous thing in trading. Even the most powerful signals have their pitfalls, and plenty of aspiring traders fall into the same predictable traps. Sidestepping these common errors is just as important as knowing what to look for in the first place.
The biggest mistake, hands down, is trading Dojis in the wrong market environment. A Doji’s power comes from signaling exhaustion at the end of a strong, clear trend. If the market is just chopping sideways with low volume, Dojis are practically meaningless. They’ll pop up all over the place, simply reflecting the existing indecision rather than signaling a new one.
Fighting the Prevailing Trend
Another classic blunder is trying to use a single Doji to fight a powerful, established trend. If a stock is in a monster uptrend, one lonely Gravestone Doji isn't a magical signal to short the top. More often than not, it's just a brief pause before the trend resumes with a vengeance.
Remember, a Doji signals a potential shift, not a guarantee. Always trade with the dominant trend in mind. Think of the Doji as a sign that momentum might be sputtering, but never as a reason to blindly bet against it. A failed Doji is often just the market taking a quick breath before the next leg up.
A Doji in a choppy market is just noise. A Doji at the end of a clear trend is a signal. Knowing the difference is what protects your capital.
Forgetting Basic Risk Management
Finally, we get to the most unforgivable mistake: failing to set a protective stop-loss. No pattern, no indicator, no strategy works 100% of the time. Period. When you enter a trade based on a Doji, you absolutely must have a clear exit plan for when you're wrong. The market can and will prove you wrong.
Your stop-loss is your safety net. It’s what prevents a small, manageable loss from turning into a disastrous account-killer. Here are some simple, practical rules for placing them:
- For a Gravestone Doji (bearish signal): Place your stop-loss just a few ticks above the high of the Doji's upper wick.
- For a Dragonfly Doji (bullish signal): Set your stop-loss just a few ticks below the low of the Doji's lower wick.
This simple act of self-preservation ensures that if the market moves against you, your losses are contained. Trading without a stop-loss is like driving without a seatbelt—it only takes one bad trade to wipe out all your progress.
Questions Traders Ask About Doji Candlesticks
Even after you get the hang of Doji patterns, some questions always pop up when you start applying them to live charts. This section tackles the most common ones head-on, giving you clear, practical answers to help you navigate the tricky situations you'll face in the real world.
Think of this as a quick reference guide to clear up any lingering doubts. Let's get these sorted so you can trade with more confidence.
Can a Doji Candlestick Signal a Trend Continuation?
It's a common misconception that a Doji always signals a reversal. While it's famous for that, its true meaning is all about context. If the market is just chopping around sideways, a Doji simply confirms that indecision is still in control and often leads to more of the same messy price action.
You'll also see a Doji pop up in the middle of a strong trend. If the candle right after it pushes hard in the original direction, that Doji was just a momentary pause—a brief hesitation before the big players resumed control. The confirmation candle is always the final word.
What Is the Best Timeframe for Trading Doji Patterns?
The higher the timeframe, the more weight a Doji carries. It's that simple. A Doji on a daily or weekly chart is a big deal because it represents a full day or week of battle between buyers and sellers. A Doji on a 1-minute chart? Not so much. It's mostly noise.
Here’s a quick breakdown based on trading style:
- Long-Term Traders: Stick to the daily and weekly charts. These signals are the most powerful.
- Swing Traders: The 4-hour and daily charts give you a great mix of frequent signals without too much noise.
- Day Traders: The 15-minute and 1-hour charts are popular, especially when a Doji forms at a critical intraday support or resistance level.
Always match your timeframe to your trading strategy. It’s the best way to filter out the meaningless signals from the ones that matter.
A Doji on a higher timeframe reflects a major struggle between buyers and sellers. Treat these signals with respect—they often precede much larger, more sustained moves in the market.
How Does Trading Volume Affect a Doji Signal?
Volume is the ultimate truth-teller in trading. A Doji that forms on high or significantly above-average volume is a signal you should sit up and pay attention to. It proves that a huge number of participants were involved in that stalemate, which makes the resulting indecision far more significant.
On the flip side, if a Doji appears on super low volume, it might just mean the market is quiet or nobody's interested. You should view this kind of signal with a healthy dose of skepticism, as it doesn't represent a true turning point or exhaustion.
What Indicators Work Best with Doji Patterns?
Using a Doji in isolation is a rookie mistake. You need confluence—other tools pointing to the same conclusion. Momentum oscillators are fantastic partners for Doji patterns.
For instance, imagine a Gravestone Doji appears at the top of a blistering uptrend. If the Relative Strength Index (RSI) is also screaming "overbought" (above 70), that's a high-probability setup to look for a short. Likewise, a Dragonfly Doji at the bottom of a downtrend gets a massive boost if the RSI is "oversold" (below 30).
Moving averages are another great companion. A Doji getting rejected right at a major level like the 200-day SMA provides powerful, actionable confirmation that a level is holding.
Stop hunting for patterns manually and let the best setups come to you. With ChartsWatcher, you can build custom scanners and alerts to find high-probability Doji trades in real-time, giving you a decisive edge. Get started with ChartsWatcher today.
