W Pattern Trading: Proven Strategies for Success
The Hidden Psychology Behind W Pattern Trading
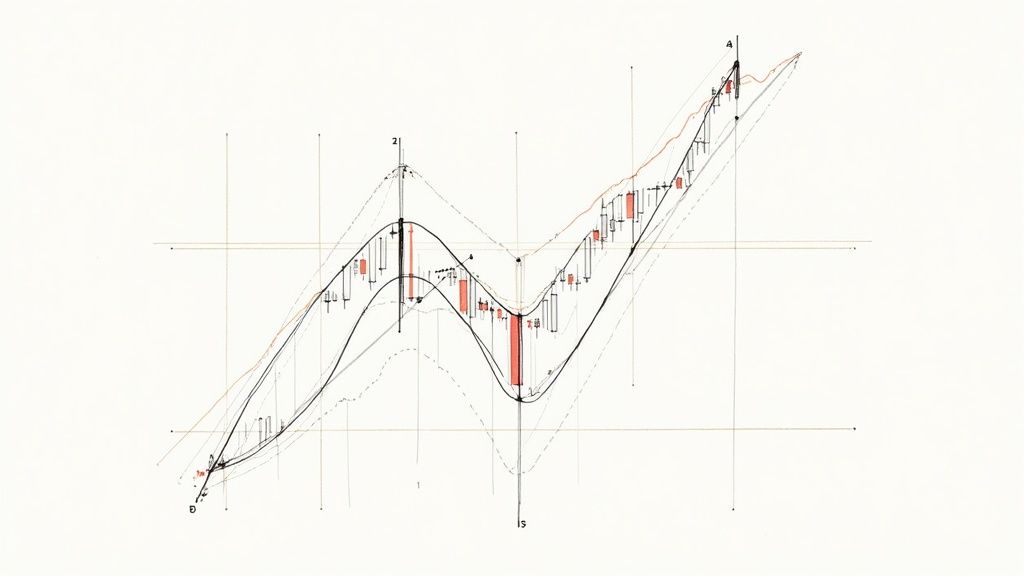
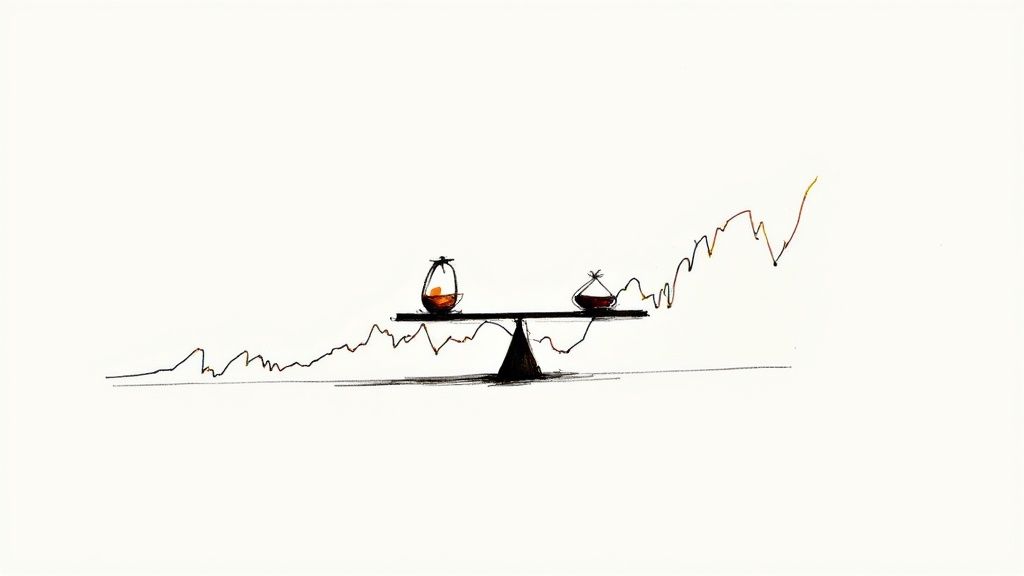
W pattern trading, also known as the double bottom pattern, provides insights into the market's psychological dynamics. It reveals the ongoing struggle between buyers and sellers. Emerging from a downtrend, the pattern hints at a potential bullish reversal. This shift is driven by the changing decisions of traders.
Deciphering the Two Bottoms
The first bottom often represents bearish exhaustion. Sellers lose momentum after pushing the price down. Buyers see this as a good entry point and start buying. A rally forms the middle peak of the W. This rally frequently faces resistance, leading to uncertainty.
This resistance tests the sellers' remaining power. If the price falls again, creating the second bottom, but stays above the first low, selling pressure is weakening. This second dip represents a final push by bears. Failure to break the previous low is a crucial turning point, possibly signaling a shift from sellers to buyers.
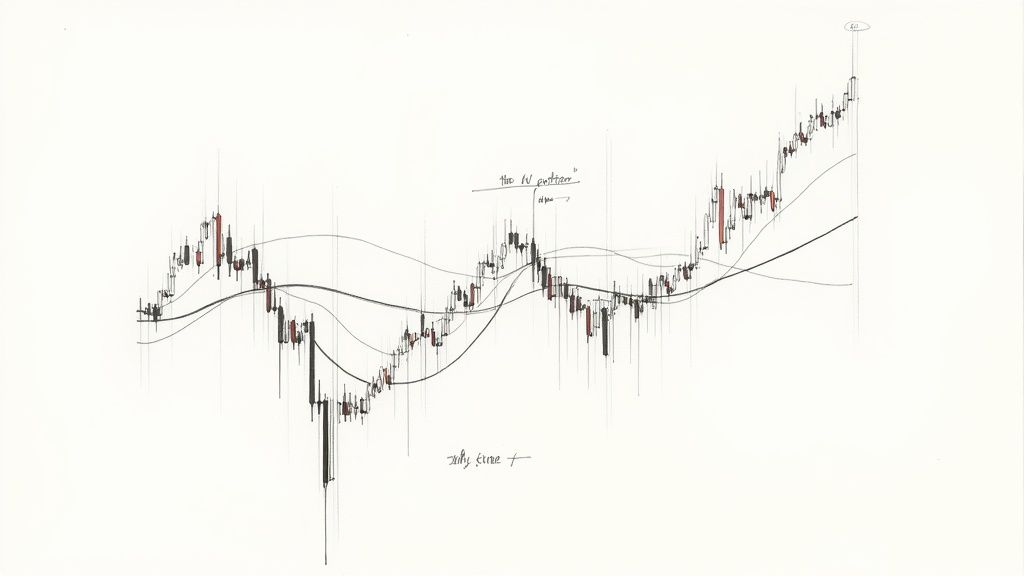
The W pattern, also known as a double bottom, is a key chart pattern used to find potential bullish reversals. Formed by two distinct price lows with a central high, it looks like the letter 'W'. The key is a confirmed breakout above the upper trendline connecting the two lows. This suggests a possible uptrend. For example, if a stock breaks out above the neckline, traders might consider a long position. Combining this with other technical indicators, such as those available on TradingView, can help manage risk. Learn more about W pattern trading here.
The Neckline Breakout: Confirmation of Bullish Momentum
The power of the W pattern lies in the neckline breakout. The price breaks through the resistance level of the peak between the two bottoms. This signals a buyer victory, confirming the potential reversal. Volume during the breakout is key.
High volume reinforces buyer conviction, validating the pattern. Low volume during a breakout can indicate a false breakout. This can trap traders who go long, only to see the price reverse.
Beyond the Basics: Variations and Context
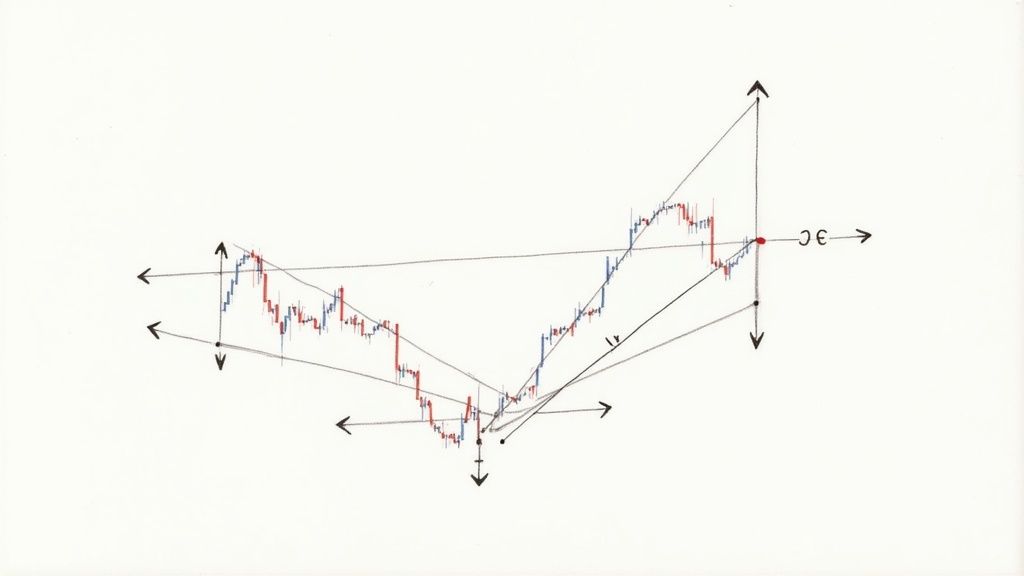
Not all W patterns are identical. Variations like the short-formed W and the extended W offer insights into the reversal's potential strength and duration. A short-formed W, with a second bottom higher than the first, implies a rapid shift in sentiment.
An extended W, with a second bottom lower than the first, indicates a longer battle between buyers and sellers. Understanding these variations allows traders to refine their strategies. This contextual understanding is vital for effective W pattern trading.
Spotting High-Probability W Pattern Setups That Actually Work
The W pattern suggests a potential shift in market sentiment. But not every W pattern leads to a true reversal. Understanding high-probability setups is key for successful trading with this pattern.
Volume and Bottom Relationships: Key Indicators of Reliability
Volume behavior is critical. Increased volume during the second bottom's formation, and especially on a neckline breakout, confirms buyer conviction. Low volume during these periods often signals a false breakout.
The relationship between the two bottoms also matters. A second bottom slightly higher than the first hints at a quick sentiment shift. A lower second bottom (extended W) suggests a longer, drawn-out struggle.
For example, consider two W patterns on the same stock. One shows increasing volume as the price nears the neckline. The other shows declining volume. The first likely has stronger buyer interest and a higher probability of a successful breakout. This shows how volume distinguishes between promising and less reliable setups. Read also: 8 Day Trading Chart Patterns Every Trader Should Know.
Measuring Pattern Quality: A Professional Approach
Professional traders use specific criteria to assess W pattern quality. This includes depth measurements, comparing the lows of the pattern to the peak. This helps gauge the potential strength of the upward move.
The ideal depth varies depending on the timeframe and the specific market. Generally, a deeper pattern implies a greater chance of a substantial breakout. The time it takes for the pattern to form also provides valuable insight. A fast W might indicate a quicker reversal. A slow W might signal a longer uptrend. Traders often use tools like those in ChartsWatcher to measure these aspects precisely. This helps identify optimal entry and exit points.
Scoring Pattern Reliability: A Checklist for Success
The following checklist helps systematically evaluate W patterns. This table offers a way to score potential W patterns. It summarizes key aspects to analyze when assessing these formations.
Before we delve into analyzing a W pattern example, let's look at a comprehensive checklist to evaluate its quality. This checklist outlines the crucial elements to consider when assessing the reliability of a W pattern setup.
W Pattern Quality Checklist: A comprehensive scoring system to evaluate the strength and reliability of W pattern formations
| Criteria | Strong Signal | Moderate Signal | Weak Signal |
|---|---|---|---|
| Depth of the Pattern | Deep, suggesting strong potential reversal | Moderate depth, indicating a decent reversal potential | Shallow, implying a weak reversal potential |
| Volume Confirmation | Increasing volume at second bottom and breakout | Moderate volume increase | Low or decreasing volume |
| Bottom Relationship | Second bottom slightly higher than the first (fast reversal) or significantly higher (stronger confirmation) | Second bottom at a similar level to the first | Second bottom lower than the first (extended W, slower reversal) |
| Neckline Clarity | Well-defined, clear horizontal resistance level | Slightly sloping or less defined neckline | No clear neckline |
| Timeframe Context | Appropriate depth and volume for the timeframe (e.g., deeper patterns and higher volume on daily charts compared to hourly charts) | Moderate alignment with timeframe expectations | Doesn't align with timeframe expectations |
This checklist helps traders filter out low-probability setups and focus on the most promising W patterns. This methodical approach helps increase the likelihood of successful trades.
Example: Analyzing a W Pattern on a 1-Hour Chart
Imagine a W pattern on a stock's 1-hour chart. The first bottom is at $50, the middle peak is at $55, and the second bottom finds support at $51. Volume increases as the price rises from the second bottom and breaks the $55 neckline with significant volume. This is a textbook W pattern with strong bullish signals. Combining pattern recognition with volume analysis can identify high-probability trading opportunities.
W Pattern Trading Performance Across Different Market Conditions
Let's move beyond theory and delve into the practical performance of W pattern trading. This section analyzes how effectively the pattern works in various market situations. We'll cover everything from strong bull markets to volatile corrections and sideways trends. This knowledge is essential for adjusting your strategies and improving your trading outcomes.
W Pattern Success Rates In Different Market Environments
The W pattern, which suggests a potential trend reversal, theoretically works best when a market shifts from a downtrend to an uptrend. But its success rate varies across different market conditions.
In a strong bull market, existing uptrends often continue, making reversals less common. This means W patterns might be less reliable in these situations.
Conversely, W patterns can be highly effective during market corrections or consolidations. As prices move within a range, the pattern can identify potential turning points more accurately. In volatile markets with sharp price swings, W patterns can help traders spot good entry points after pullbacks.
Historically, chart patterns like the W bottom have been studied for their predictive abilities. A 2007 study indicated that technical trading rules, including those based on chart patterns, could anticipate market changes. This highlights the potential of chart patterns. While specific W pattern performance data is limited, technical analysis suggests these patterns can be valuable tools. Learn more about market patterns from JPMorgan Chase & Co.
Asset Class Performance and W Pattern Trading
W pattern trading effectiveness also differs among asset classes. The pattern applies to stocks, forex, and cryptocurrencies, but some assets show better win rates than others. This difference is often linked to the unique features of each market.
Highly liquid markets like forex often have clearer price action, making W patterns simpler to spot and trade. Less liquid markets or assets with lower trading volumes might create more false signals. Careful analysis is vital when using the pattern with these assets. Understanding these nuances lets traders customize their approaches.
Adapting Your W Pattern Approach As Market Conditions Evolve
Market dynamics constantly change, requiring traders to adapt their W pattern strategies. During high volatility, wider stop-loss orders can be helpful. This accounts for price swings without prematurely exiting a trade.
During lower volatility, tighter stop-losses might be better. This maximizes profits by minimizing potential losses. Adjusting your profit targets based on market conditions is also crucial. In trending markets, higher profit targets can capture larger price movements. During consolidation, smaller targets might be more realistic. These flexible strategies are key to successful W pattern trading.
Optimizing Reward-to-Risk Ratios With W Pattern Variations
Different W pattern variations, like the short-formed W and the extended W, offer different reward-to-risk profiles. Understanding these is key to optimizing trading performance.
The short-formed W, with a higher second bottom, often suggests a faster reversal, enabling quick profit-taking. However, quicker reversals can also mean higher volatility and a greater risk of false breakouts.
The extended W, with a lower second bottom, often signals a longer, more sustained uptrend. This can lead to larger profits but requires patience and wider stop-loss orders. By understanding the subtleties of W pattern trading in various market environments, traders can improve their success. This includes recognizing the pattern's limits, adapting to market conditions, and choosing the right asset classes.
Entry and Exit Mastery for W Pattern Trading
This section explores mastering entry and exit strategies for W pattern trading. This knowledge helps traders effectively use this pattern to their advantage. Accurate entries and exits are vital for maximizing profits and minimizing potential losses.
High-Probability Entry Techniques for W Pattern Trading
Several entry techniques cater to varying risk tolerances within W pattern trading. Some traders prefer more aggressive entries to capitalize on large potential gains. Others prefer a more conservative approach, focusing on minimizing risk.
-
Aggressive Entry: This involves entering a long position as soon as the price moves above the neckline. This aims to capture maximum profit from the initial price movement. It does, however, have a higher risk of false breakouts.
-
Conservative Entry: This approach requires waiting for the price to retest the neckline as support after the initial breakout. This confirms the breakout's validity and offers a lower-risk entry point. The trade-off is potentially missing some initial profit.
-
Mid-Point Entry: This strategy balances risk and reward. Traders enter after the breakout but before a retest, aiming for a price around the midpoint of the initial breakout move.
The best entry technique depends on individual trading style and risk tolerance. Using tools like the customizable alerts and charts in ChartsWatcher can increase entry precision.
Stop-Loss Strategies for W Pattern Trading
Stop-loss orders are essential for protecting trading capital. They automatically close a trade if the price moves against your prediction. In W pattern trading, proper stop-loss placement is crucial. It’s all about balancing risk mitigation with allowing the pattern to develop.
A stop-loss placed too close to the entry price can lead to early exits from normal price swings. Conversely, placing it too far away can result in significant losses if the pattern fails. A common practice is placing the stop-loss just below the second bottom of the W formation. This allows for some price movement while protecting against a major breakdown.
Profit-Taking Methods for W Pattern Trading
Profitable exits are as important as correct entries. Many traders struggle with exit strategies, often missing potential profits or exiting too early. W pattern trading presents several profit-taking methods.
-
Fixed Target: This involves a pre-determined profit target based on the pattern's height. This gives structure, but may not capture maximum profit from a strong price surge.
-
Trailing Stop: This dynamically adjusts the stop-loss as the price moves favorably. This secures profits and allows capturing larger swings but requires careful parameter adjustments.
-
Multiple Profit Targets: This utilizes tiered profit targets, allowing traders to secure profits at different price levels. It balances early profit-taking with the possibility of larger gains.
Adapting Strategies to Market Volatility and Asset Classes
Market volatility and the traded asset class can influence W pattern trading strategies. In volatile markets like cryptocurrencies, wider stop-losses and flexible profit targets are important. More stable markets, like stocks, may allow for tighter stop-losses and fixed targets.
Forex trading often requires adjustments based on currency pairs and specific market conditions. Analyzing W patterns across multiple timeframes with ChartsWatcher’s platform can offer insights for strategy optimization in various market environments.
W Pattern Entry & Exit Strategy Comparison
The following table compares various W pattern trading strategies. Understanding the advantages, disadvantages, and ideal market conditions is key for selecting the best approach.
| Strategy Type | Entry/Exit Point | Advantages | Disadvantages | Best Market Conditions |
|---|---|---|---|---|
| Aggressive Entry | Breakout above neckline | Maximizes profit potential | Higher risk of false breakouts | Trending markets with strong momentum |
| Conservative Entry | Retest of neckline as support | Lower risk entry | May miss some initial gains | Consolidating or ranging markets |
| Fixed Target | Predetermined price level | Structured exit strategy | May limit profits | Stable markets with predictable price action |
| Trailing Stop | Dynamically adjusts stop-loss | Captures larger moves | Requires careful parameter setting | Trending markets with potential for extended moves |
| Multiple Profit Targets | Tiered profit levels | Balances profit-taking and potential | Increased management complexity | Volatile markets with unpredictable swings |
Mastering these entry and exit strategies, and adapting them to varying market conditions, can greatly improve W pattern trading performance and build consistent profitability. Tools like ChartsWatcher can enhance these strategies and help identify high-probability setups.
The Numbers Behind Successful W Pattern Trading
The W pattern in trading, while visually appealing, needs more than just recognizing the shape. To truly unlock its potential, it's essential to grasp the underlying statistics. This means analyzing factors like specific pattern dimensions, volume characteristics, and performance across different timeframes. Let’s explore the data behind profitable W pattern trades.
Win Rates and Timeframes: Decoding the Statistics
A crucial metric is the win rate, the percentage of winning trades using this pattern. While precise data on W pattern win rates is limited, understanding how win rates generally behave across different timeframes is vital. Shorter timeframes often have lower win rates due to market noise and false breakouts. For example, a W pattern on a 5-minute chart might have a lower win rate compared to a daily chart. Longer timeframes may offer higher win rates but demand more patience and wider stop-loss orders.
Pattern Variations and Performance: Identifying Outperformers
Not all W patterns perform equally. Some variations consistently outperform others. A W pattern with a higher second bottom often suggests a stronger reversal, potentially leading to improved win rates and more significant price movements. An extended W pattern, where the second bottom is lower than the first, might have a lower win rate but offer larger profit potential due to the longer duration.
Drawdown and Profit Factors: Managing Expectations
Analyzing drawdown characteristics is key for realistic expectations. Drawdown, the peak-to-trough decline in a trade, helps manage risk. Understanding typical drawdown for W pattern trades allows for suitable position sizing and stop-loss placement. Examining the profit factor, the ratio of gross profits to gross losses, helps evaluate overall profitability.
You might be interested in: Technical Analysis Indicators Explained - Unlock Market Trends. Using platforms like ChartsWatcher can help gather and analyze this data for informed trading decisions.
Statistical Thresholds for Your Trading Plan
Integrating statistical thresholds into your trading plan is vital. This could include minimum win rate requirements, acceptable drawdown limits, and target profit factors. You might choose to trade W patterns on daily charts only if the historical win rate exceeds a specific percentage, like 60%. A maximum drawdown limit, such as 10%, helps protect capital. Defining these thresholds and tracking performance helps refine W pattern strategies. This data-driven approach transforms W pattern trading from visual observation to a statistically robust method.
Evaluating W Pattern Success Through Statistical Analysis
The W pattern's effectiveness can be measured by analyzing successful breakout frequency and subsequent price action. While dedicated W pattern performance statistics are scarce, broader technical analysis studies suggest that chart patterns can be effective when used correctly. A study by Washington and Lee University explored the predictive power of stock price charts by comparing recent patterns to historical data dating back to 1926. While not specifically focused on the W pattern, this research highlights the potential predictive value of chart patterns in finance. Explore this further here.
Optimizing W Pattern Trading With ChartsWatcher
Analyzing the statistical side of W patterns is crucial for success, and ChartsWatcher provides the tools to achieve this. Using its features, traders can backtest W pattern strategies, monitor win rates across timeframes, and analyze drawdown and profit factor data. ChartsWatcher allows customizing alerts based on specific statistical thresholds, ensuring timely entry and exit points. This empowers traders to go beyond visual identification and utilize data-driven decisions for better W pattern trading.
Turbocharging Your W Pattern Trading With Confirmation Tools
Identifying a W pattern is a good starting point, but using confirmation tools can truly elevate your trading game. These tools provide extra layers of analysis, helping filter out bad signals and pinpoint high-probability breakouts.
Momentum Indicators: Validating the Reversal
Momentum indicators are invaluable for confirming the strength of a potential reversal within a W pattern. The Relative Strength Index (RSI), for example, helps identify divergence. If the price forms the second bottom of the W, but the RSI forms a higher low, this bullish divergence suggests weakening selling pressure. This, combined with a neckline breakout, can be a powerful signal.
The Moving Average Convergence Divergence (MACD) can also confirm momentum shifts. A bullish crossover on the MACD histogram as the price nears the neckline adds further weight to a potential reversal. Using these momentum indicators alongside the W pattern helps traders gain more confidence.
Volume Analysis: Gauging Buyer Conviction
Volume analysis is crucial for evaluating breakout strength. Increased volume during a W pattern neckline breakout indicates strong buyer interest. Conversely, low volume can signal a false breakout, potentially trapping traders. ChartsWatcher offers advanced volume analysis features to help traders closely monitor volume.
ChartsWatcher lets traders set alerts for volume spikes, ensuring they’re notified of potential breakouts with strong buyer conviction. This can help traders capitalize on opportunities and avoid early entries.
Multiple Timeframe Analysis: A Holistic Approach
Analyzing the W pattern across multiple timeframes provides a more comprehensive market view. A daily chart W pattern supported by confirming hourly chart momentum and volume significantly strengthens the signal. ChartsWatcher facilitates this by allowing seamless timeframe switching.
For instance, you might spot a W pattern on the daily chart and then use ChartsWatcher to examine the hourly chart for momentum and volume indicators at the second bottom. This multi-timeframe approach can help identify high-probability setups.
Indicators to Avoid: Separating Fact From Fiction
While many indicators can enhance W pattern trading, some can actually hinder performance. Over-reliance on oscillators, for example, might lead to premature entries and exits. Lagging indicators may not provide timely signals for fast-moving breakouts.
Understanding the strengths and weaknesses of various indicators is essential for optimizing your strategy. Focusing on the combined power of momentum, volume, and multiple timeframe analysis generally produces more consistent results.
Enhancing Profitability Across Market Environments
Using confirmation tools allows traders to adapt W pattern strategies to varying market conditions. During high volatility, strong confirmation signals like substantial volume increases and clear momentum shifts become critical. In calmer markets, multi-timeframe confirmation might suffice. Adaptability is key for profitability.
Building a Comprehensive W Pattern Trading Strategy With ChartsWatcher
ChartsWatcher helps traders systematically analyze W patterns and incorporate confirmation tools. The platform's customizable alerts based on indicator combinations and volume thresholds allow for timely decisions. The backtesting capabilities further refine strategies.
Traders can test various indicator combinations and optimize parameters based on historical data. This data-driven approach elevates W pattern trading from visual art to a statistically validated strategy, ultimately improving your trading edge and increasing the likelihood of success.
Avoiding the W Pattern Trading Traps That Drain Accounts
Even experienced traders can stumble into common W pattern trading pitfalls. These mistakes can quietly chip away at profits over time. This section highlights these traps and offers practical solutions and real-world examples to help you safeguard your trading capital.
The Premature Entry Trap: Patience Is Key
One of the most frequent mistakes in W pattern trading is entering a position too early. Jumping into a trade before the pattern is confirmed, particularly before the price breaks above the neckline, is risky. This impulsive action often comes from the fear of missing out (FOMO) and can lead to substantial losses if the expected reversal doesn't happen. Learning to wait for a confirmed breakout is crucial for long-term success.
For example, picture a stock forming a W pattern. The price moves toward the neckline, and you enter, expecting a breakout. Instead, the price reverses, creating a lower low and hitting your stop-loss. Waiting for the confirmed breakout could have prevented this.
Position Sizing Pitfalls: Adapting to W Pattern Dynamics
Standard position sizing methods are often insufficient for W pattern trading. These patterns have specific volatility characteristics that demand a customized approach to risk management.
- Calculate your position size based on the distance between your entry and stop-loss, not just on account size. This helps limit potential losses.
- Adjust position sizing based on market conditions and the strength of the W pattern. A well-defined W pattern with confirming volume and momentum indicators justifies a larger position than a weak pattern with unclear signals.
Psychological Challenges: Mastering Your Emotions
Trading psychology is essential for W pattern trading success. The fear of losing profits can make traders exit winning trades too soon. On the other hand, hope can lead traders to hold losing positions too long, waiting for a turnaround. These emotional responses can significantly affect your overall results.
- Develop strategies to manage your emotions.
- Use predefined profit targets and trailing stop-loss orders to take emotion out of your decisions.
Mastering the Art of the Exit: Securing Your Profits
Knowing when to exit is as important as knowing when to enter. Create a clear exit strategy that balances profit maximization with capital preservation.
- Consider using multiple profit targets to lock in some profit at different price levels.
- Trailing stop-losses can help you ride larger price moves while protecting against sudden reversals.
- Regularly review and adjust your exit strategies based on current market conditions and your performance.
Case Study: A Costly Lesson in Patience
Consider a trader who spotted a W pattern. Eager for the breakout, they entered early, just as the price neared the neckline. The price stalled and then reversed, dropping below the second bottom and triggering their stop-loss. This impulsive decision cost the trader a substantial amount of capital. Waiting for a confirmed breakout with higher volume could have changed the outcome. This underscores the importance of patience and discipline in W pattern trading.
Ready to improve your trading with advanced tools and real-time market data? ChartsWatcher offers the features you need to identify, analyze, and profit from W pattern trading opportunities. From customizable alerts to backtesting, ChartsWatcher helps you make informed trading decisions and navigate the stock market. Visit ChartsWatcher today.
