Understanding the Oversold Stocks Meaning
An oversold stock is one that’s taken a beating. Its price has dropped hard and fast, usually because of widespread market fear, not because the company suddenly became worthless. This intense selling pressure shoves the price down to a level that technical analysts see as unsustainably low.
Think of it like a pendulum that's swung way too far into pessimistic territory. When that happens, there's a good chance it's going to swing back.
What "Oversold" Actually Means for a Stock
Picture a popular store that suddenly announces a massive, unexpected clearance sale. Panicked shoppers rush in, afraid of missing out, and quickly strip the shelves bare. Before long, the initial frenzy dies down and the store is nearly empty.
An oversold stock is a lot like that. Intense selling, often kicked off by bad news or general market panic, flushes out anyone willing to sell and pushes the price down aggressively. It doesn’t mean the company is failing—it just means the selling momentum got extreme.
This is why you'll often see an oversold stock compared to a stretched rubber band. It’s been pulled down so far by selling pressure that it’s primed for a potential snap-back.
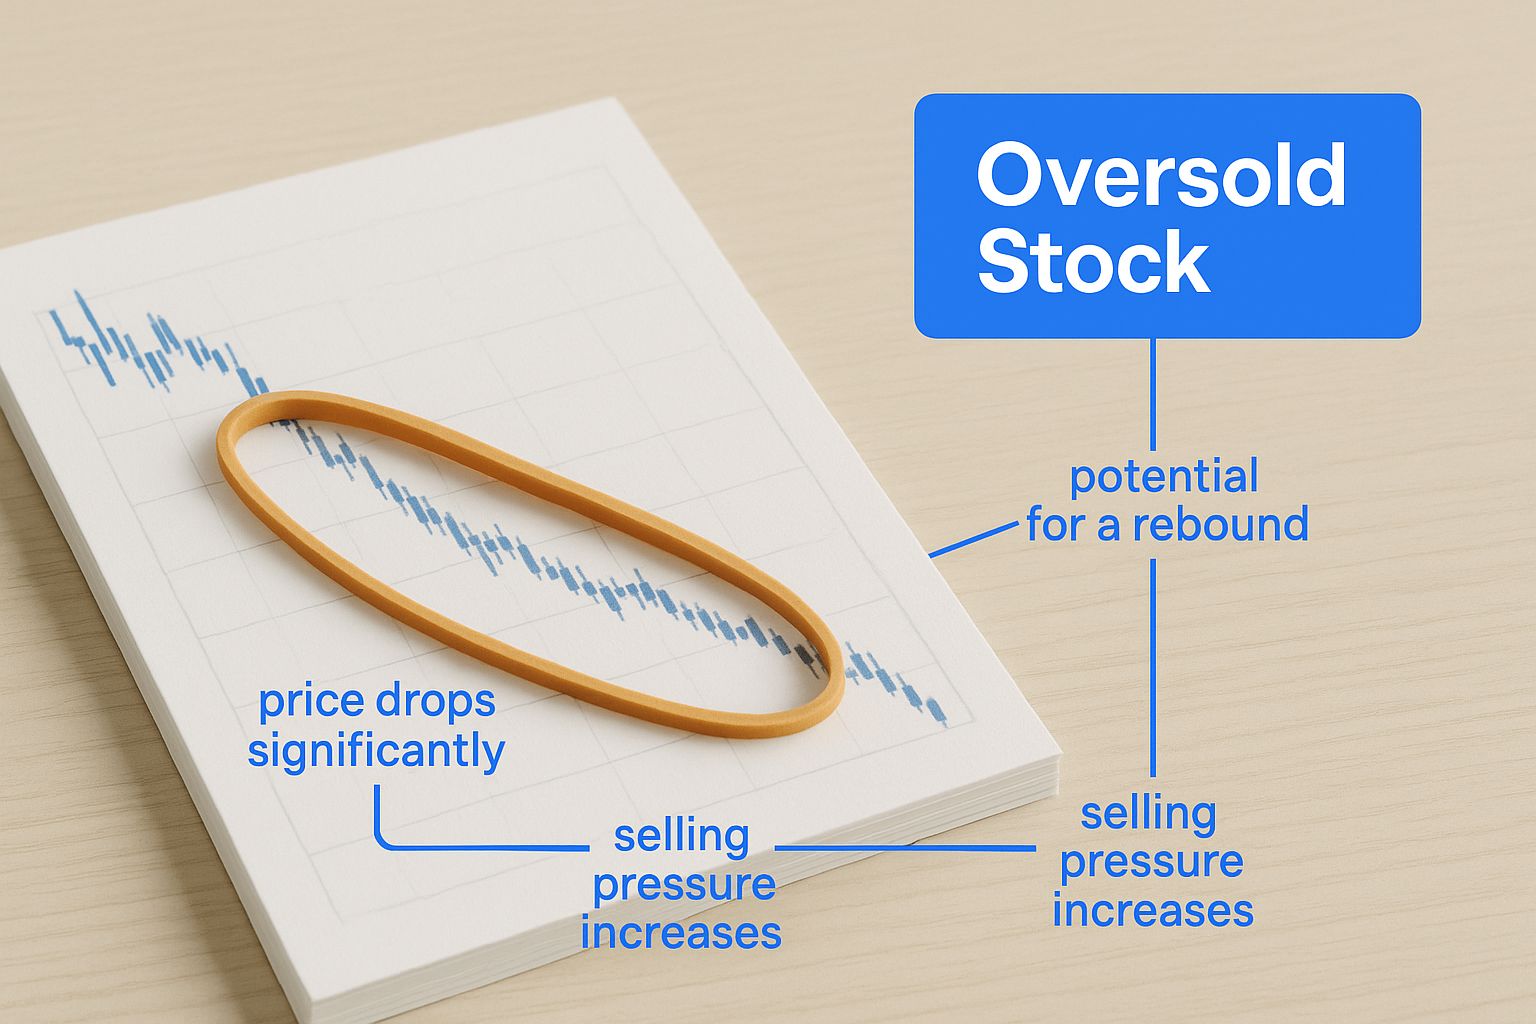
The visual nails the concept perfectly: the more the price is stretched downward, away from its typical range, the more tension builds for a potential rebound.
The Psychology Driving an Oversold Market
At its core, an oversold condition is all about market psychology. Fear and panic are contagious. They can trigger herd behavior where investors dump their shares simply because everyone else is doing it. This creates a nasty feedback loop: falling prices trigger more selling, which pushes the stock far below what its financial health would justify.
What usually kicks this off?
- Negative News: A bad earnings report or some gloomy industry forecast can easily start a sharp sell-off.
- Broader Market Downturns: When the whole market is in a correction or a crash, even the best, most fundamentally sound companies get dragged down with the tide.
- Sheer Panic: Sometimes, fear just takes over, causing investors to liquidate their positions without a second thought about the stock's long-term value.
A Technical Signal, Not a Fundamental Flaw
This is a critical distinction to make. The term "oversold" is a technical signal, not a final judgment on the company's quality.
A stock becomes oversold when its price falls to a point that key indicators, like the Relative Strength Index (RSI), flag as extreme. The classic rule of thumb is that when a stock's RSI value drops below 30, it's considered oversold. This is a sign to traders that the recent selling pressure might be overdone and a price bounce could be just around the corner. You can learn more about interpreting these signals over at CabotWealth.com.
The key takeaway is this: An oversold signal suggests the sellers might be running out of steam. Once there are very few sellers left, it doesn't take much buying pressure at all to start pushing the price back up. Traders look at this point of exhaustion as a potential reversal opportunity.
Oversold vs Overbought Conditions At a Glance
To really get a handle on what "oversold" means, it helps to see it next to its polar opposite: "overbought." They're two sides of the same coin, both signaling that market sentiment has likely gone too far in one direction.
| Characteristic | Oversold | Overbought |
|---|---|---|
| Price Action | Rapid and significant price decline. | Rapid and significant price increase. |
| Market Sentiment | Dominated by fear, pessimism, and panic. | Driven by greed, euphoria, and FOMO. |
| RSI Level | Typically below 30. | Typically above 70. |
| What It Suggests | Selling pressure may be exhausted; a potential price rebound is possible. | Buying pressure may be exhausted; a potential price pullback is possible. |
| Potential Opportunity | A potential buying opportunity for a bounce or reversal. | A potential selling or shorting opportunity for a correction. |
Ultimately, both conditions are about momentum reaching an extreme. An oversold stock has been sold too hard, too fast, while an overbought one has been bought with too much enthusiasm. Both are flashing signs that the current trend might be unsustainable.
How To Find Oversold Stocks With Key Indicators
Spotting an oversold stock isn't just about gut feelings; you need the right tools for the job. Think of technical indicators as a mechanic's diagnostic instruments—they're designed to measure market momentum and tell you when selling pressure has gotten out of hand. They help us quantify that "stretched rubber band" effect and see it on a chart.
While dozens of indicators exist, a few have become the go-to choices for traders because they’re reliable and easy to read. Once you know how to use them, you can go from just understanding what an oversold stock is to actively finding potential reversal points yourself.
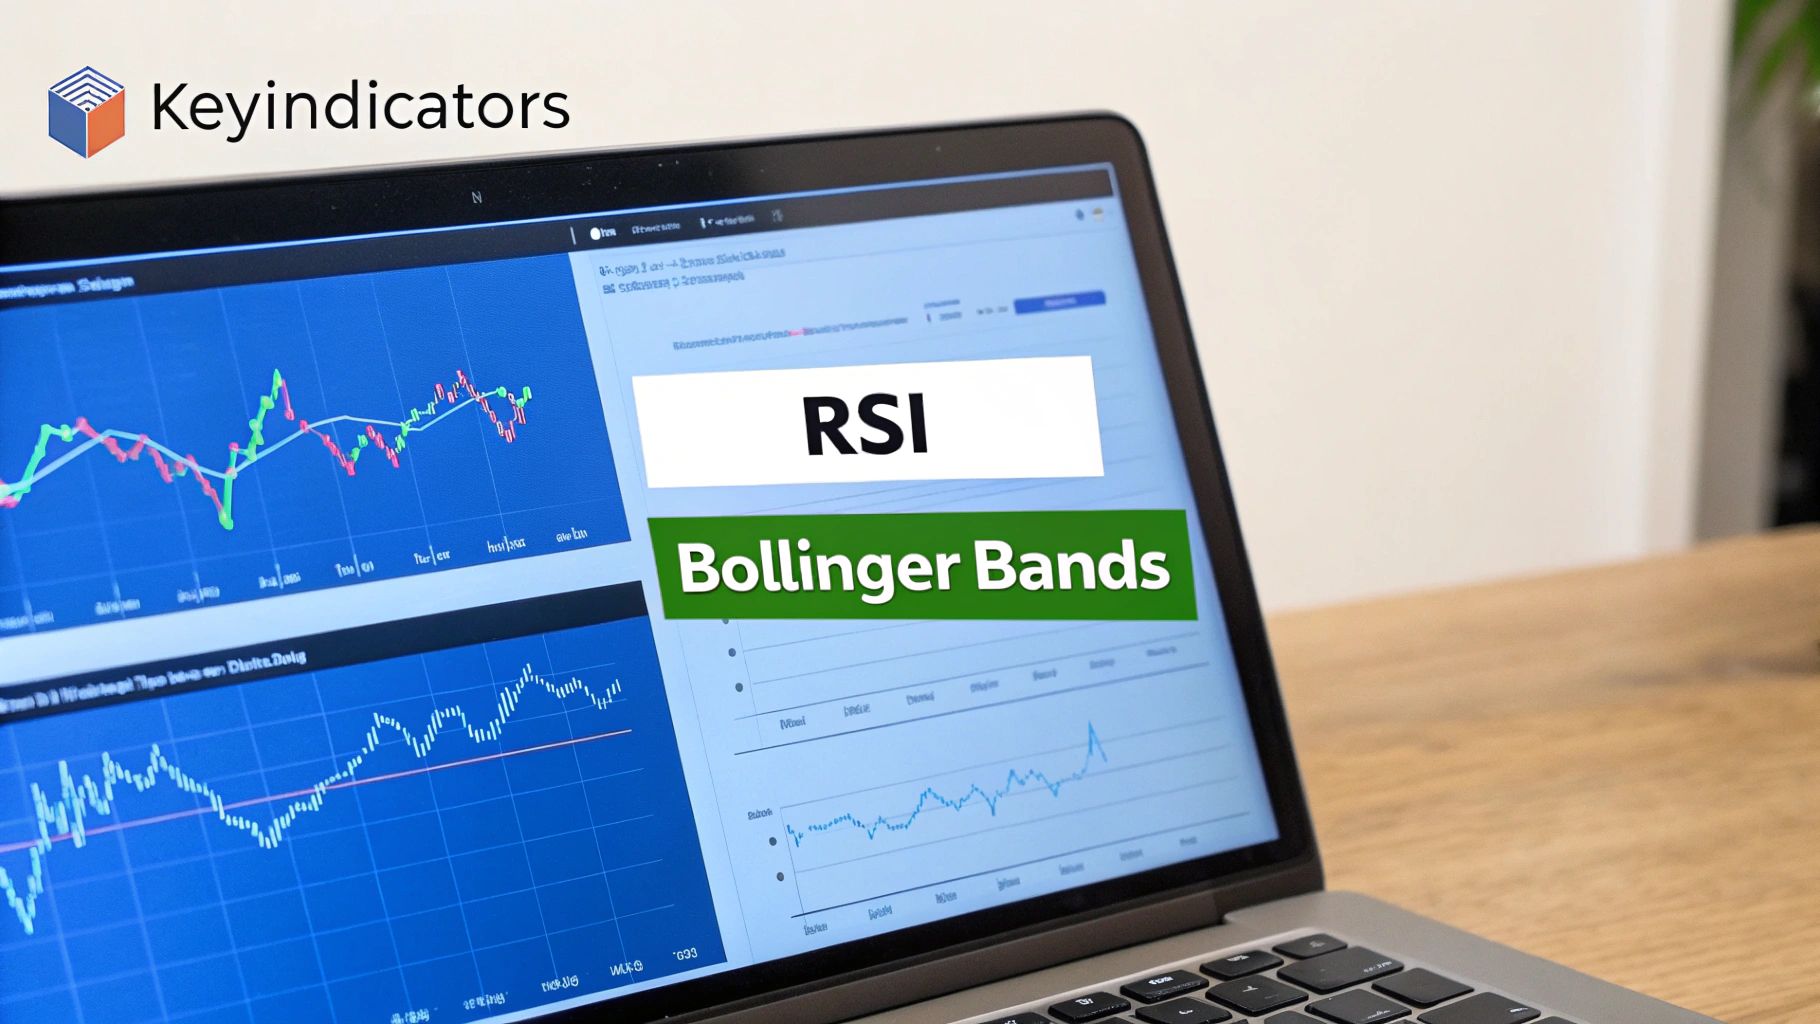
The Relative Strength Index (RSI)
The most popular tool in the shed is the Relative Strength Index (RSI). It’s a momentum oscillator that measures the speed and change of price movements, boiling it all down to a simple number between 0 and 100.
- An RSI above 70 suggests a stock is overbought. Buying has been aggressive, and the price might be due for a cooldown.
- An RSI below 30 is the classic signal for an oversold stock. This tells you the sellers have likely exhausted themselves, setting the stage for a potential bounce.
The RSI has been a trader's staple since it was introduced back in 1978. It's not just theory, either. Studies of major markets like the NYSE have shown that stocks hitting an RSI below 30 historically produced mean excess returns between 5% to 10% over the next one to three months. That’s some serious predictive potential.
The Stochastic Oscillator
Another heavy hitter is the Stochastic Oscillator. It also works on a 0-100 scale, but it looks at the market from a slightly different angle. Instead of just measuring price speed, it compares a stock's closing price to its price range over a set period.
The logic is straightforward: in a healthy uptrend, prices usually close near their highs. In a downtrend, they tend to close near their lows.
A Stochastic reading below 20 is the standard signal for an oversold condition. It tells you the stock is consistently closing near the bottom of its recent range—a solid clue that the bears might be running out of steam.
The Stochastic is often more sensitive than the RSI, meaning it can give you earlier signals. The trade-off? It can sometimes generate more false alarms, especially when a stock is in a very strong trend. For a deeper dive into these nuances, you might be interested in our guide on the top overbought and oversold indicators for traders.
Bollinger Bands
Unlike RSI and Stochastics, which appear in a separate window below your chart, Bollinger Bands are drawn right on top of the price. They’re made up of three lines:
- A middle band, which is just a simple moving average (SMA).
- An upper band, which is the SMA plus two standard deviations.
- A lower band, which is the SMA minus two standard deviations.
These bands get wider or tighter depending on how volatile the market is. The oversold signal here is when the stock's price touches or, even better, pokes through the lower Bollinger Band. This move suggests the price has fallen so far below its recent average that the sell-off is statistically extreme and probably can't last.
This screenshot from ChartsWatcher shows just how easy it is to put this into practice.
Here, the screener is set to find stocks with an RSI below 30. In an instant, you have a list of potential oversold opportunities ready for a closer look.
Learning From Real World Market Reversals
Technical indicators are great on a chart, but their true power snaps into focus when you see them play out during major market events. Theory is one thing; watching a real-world panic and reversal is another entirely. The best lessons come from history, showing how moments of extreme fear can create textbook opportunities for traders who know what to look for.
By studying these past blow-offs, we move from abstract ideas to concrete examples. These events show just how fast market sentiment can flip from pure panic to a sharp recovery, often rewarding the disciplined traders who recognized the signs of seller exhaustion.
The Ultimate Test Case: The 2020 Market Crash
There's no better recent example of an oversold signal than the market crash of March 2020. As the reality of the global pandemic hit, sheer panic gripped the markets. The result was a waterfall decline that felt like it would never end.
In just 33 days, the S&P 500 index absolutely cratered, dropping roughly 34%. This historic plunge sent the RSI for countless stocks—and the index itself—deep into oversold territory, far below the typical 30 threshold. This wasn't just a blip on a chart; it was a crystal-clear reflection of widespread fear completely overwhelming rational thought. You can learn more about how the market recovered from these lows at Schwab.com.
This was a critical lesson for every trader: markets can become wildly oversold due to macro panic, even when the underlying companies are still fundamentally solid. For those watching their indicators, it was a screaming signal that the selling was overdone.
What happened next? A swift and incredibly powerful rebound. Traders who spotted the oversold conditions and had the nerve to act were perfectly positioned for one of the fastest market recoveries in history. It was a masterclass in the idea that maximum fear often coincides with maximum opportunity.
Sector-Specific Reversals
You don't have to wait for a once-in-a-decade crash to find these opportunities. Oversold conditions pop up all the time within specific industries or sectors that have temporarily fallen out of favor.
Think about the energy sector. Let's say a sudden drop in oil prices sends investors fleeing. In that rush for the exits, the stocks of even the most stable, well-run energy companies can get dragged down into oversold territory. A single company’s RSI might dip below 30 not because of anything it did wrong, but simply because of broad, industry-wide pessimism.
This creates a much more focused opportunity. A savvy trader can see these oversold signals and start looking for fundamentally strong companies that are being unfairly punished. Instead of trying to time the entire market, they can hunt for reversal plays within a single, beaten-down industry. These smaller-scale events happen far more often and are just as valuable for putting these technical principles to work.
Developing A Strategy For Trading Oversold Stocks
Spotting an oversold stock with an RSI below 30 is just the starting pistol, not the finish line. A disciplined strategy is what separates a calculated trade from a blind gamble. If you just buy every time an indicator flashes "oversold," you're setting yourself up for a world of pain. A cheap stock can always get cheaper.
The goal is to build a structured plan around that initial signal. It’s about waiting for confirmation, managing your risk, and knowing exactly where you plan to get out—win or lose. Building this kind of discipline is a core part of any successful trading approach, and it ties into broader concepts like effective Portfolio Management Hacks for Rapid Financial Growth.
The Confirmation Entry Approach
One of the oldest—and most painful—mistakes in trading is trying to catch a falling knife. A stock can stay oversold for a long, long time during a nasty downtrend. A much smarter approach is to wait for a clear sign that the selling pressure is finally letting up before you put a single dollar on the line.
This is the whole idea behind the Confirmation Entry strategy. Instead of jumping in the second the RSI dips below 30, you patiently wait for it to climb back above 30. This tiny shift in timing is huge. It's your confirmation that buyers are starting to tiptoe back into the ring and the immediate downward momentum is fading.
Sure, your entry might be a little later, but your odds of success often shoot up because you’re trading on evidence, not just hope. We dive deeper into this with more charts and examples in our guide on using oversold and overbought indicators to time your trades.
Leveraging Bullish Divergence
If you're looking for a more advanced—but incredibly powerful—signal, keep an eye out for bullish divergence. This pattern can be a fantastic clue that a downtrend is running out of gas and a reversal might be just around the corner.
Bullish divergence happens when the stock's price makes a new low, but a momentum indicator like the RSI or Stochastic Oscillator fails to follow suit. Instead, the indicator forms a higher low.
This mismatch between price and momentum is a big deal. It’s like the engine is still revving, but the car is barely moving. It tells you the bears are getting tired.
Here’s what this pattern is really saying:
- Waning Momentum: The downward push is losing its punch.
- Underlying Strength: Buyers are quietly starting to absorb the selling, even if the price hasn't turned up yet.
- Potential Reversal: This is often one of the earliest signs you'll get that the trend is about to turn.
Building Your Trading Framework
Once you have a signal you trust, you need a plan. A complete trading strategy isn't just about when to get in; it's also about when to get out. It should always have three key parts:
- Entry Point: This is your trigger. It could be the RSI crossing back above 30 or a clear bullish divergence pattern taking shape.
- Stop-Loss Order: This is your eject button. You need to decide before you enter the trade at what price you'll cut your losses if you're wrong. No exceptions.
- Profit Target: Know where you’re going to cash in. This could be a specific price, like a previous resistance level, or maybe when the RSI hits overbought territory (above 70).
By defining these three elements before you click "buy," you take emotion out of the equation and replace it with a disciplined, repeatable process. That’s how you build consistency.
Common Mistakes to Avoid With Oversold Signals
Trading based on oversold signals can be a powerful strategy, but it’s also riddled with traps that can quickly drain your capital. Seeing an oversold signal is only the first step; knowing what not to do is just as important. Far too many traders see a low RSI and jump in headfirst, only to find themselves nursing a nasty loss.
The most dangerous and all-too-common mistake is what traders call "catching a falling knife." This is when you buy a stock simply because its price has plummeted, assuming it has to be a bargain. Here's the hard truth: a cheap stock can always get cheaper, and an oversold signal is absolutely not a guarantee that the selling has stopped.
In fact, a stock that looks oversold can easily become even more oversold. This happens all the time during a powerful downtrend fueled by terrible news, like a failed product or a major accounting scandal. That initial oversold reading is often just a quick breather before the next painful leg down.
Relying on a Single Indicator
Another critical error is putting all your faith in one indicator. Seeing an RSI below 30 might be a good reason to start your research, but it's a terrible place to finish it. Without getting confirmation from other sources, you're essentially trading with one eye closed.
A low RSI by itself just doesn't give you enough context. You need to build a stronger case for the trade by looking for other supporting evidence.
- Look for Bullish Divergence: As we've covered, this is a much stronger signal. It happens when the price hits a new low, but your indicator refuses to follow, suggesting the downward momentum is fading.
- Check the Volume: Is buying volume starting to perk up as the price drops? This can be a clue that the "smart money" is quietly starting to build a position.
- Identify Support Levels: Is the stock approaching a historical price level where buyers have consistently shown up in the past?
An indicator is just a tool, not a crystal ball. Relying on one signal is like trying to build a house with only a hammer—you're missing the other crucial tools needed for a stable structure.
Ignoring the Broader Market Trend
Finally, it's a huge mistake to trade an oversold signal on a stock while completely ignoring what the overall market is doing. If the entire S&P 500 is in a freefall, your single stock’s oversold signal is fighting against a powerful, market-wide tide.
Even the most perfect-looking setup can get crushed if the broader market sentiment is overwhelmingly bearish. Always ask yourself: Is the market in an uptrend, downtrend, or just chopping sideways?
Trading in harmony with the primary market trend dramatically increases your odds of success. Buying an oversold stock in a raging bull market is a high-probability setup; doing the same thing in a vicious bear market is a high-risk gamble.
Frequently Asked Questions About Oversold Stocks
As we've journeyed through the world of oversold stocks—from spotting them with indicators to building trading strategies around them—a few common questions always pop up. Getting these straight is the key to trading with confidence instead of just crossing your fingers.
Let's tackle some of the most pressing questions traders have. Think of this as the final briefing before you put these ideas into action.
How Long Can a Stock Stay Oversold?
This is where so many traders get burned. They see an RSI below 30 and assume a rebound is just around the corner. But the hard truth is, a stock can stay oversold for days, weeks, or even months. There's no built-in timer.
Think about it: if a company is bleeding money, losing customers, or caught in a massive scandal, that selling pressure isn't going away anytime soon. The stock will stay pinned to the mat until something fundamentally changes.
An oversold signal isn't a timer about to buzz; it's a condition report. It tells you the selling is extreme right now, but it makes no promises about when that pressure will finally let up.
Is an Oversold Stock Always a Good Buy?
Let me be crystal clear: Absolutely not. This is probably the single most important lesson to remember about the oversold stocks meaning. An oversold reading is a technical observation, not a certificate of quality.
A stock can be oversold for a very good reason. The business model might be broken, it could be drowning in debt, or its entire industry might be in a death spiral. Buying into that isn't a bargain hunt—it's catching a falling knife.
Always treat an oversold signal as a starting point for more research, never as a blind "buy" signal. You have to pair the technical reading with a look at the bigger picture to avoid falling into a classic value trap.
What Is the Difference Between an Oversold Stock and a Value Stock?
It’s easy to mix these two up, especially since an oversold stock can sometimes also be a good value. But they are fundamentally different concepts, rooted in completely different schools of thought.
- Oversold Stock: This is a technical condition. It's all about recent price action and momentum, identified with indicators like the RSI or Stochastic Oscillator. It’s a short-term snapshot of intense selling.
- Value Stock: This is a fundamental assessment. It's about a company's intrinsic worth, discovered by digging through financial statements. Analysts use metrics like the price-to-earnings (P/E) ratio or discounted cash flow to find companies trading for less than they're truly worth.
An oversold stock is defined by how it's trading. A value stock is defined by what it is. One is about market psychology, the other is about business health. Knowing the difference is crucial for building any kind of sound strategy.
Ready to stop guessing and start analyzing? ChartsWatcher provides the powerful, real-time scanning and charting tools you need to identify oversold opportunities with precision. Customize your dashboard, set precise alerts, and find your next trade before the market turns. Start your free trial at https://chartswatcher.com and gain the edge you need.
