Triangle Pattern Trading: Proven Methods for Market Success
Understanding What Makes Triangle Patterns Actually Work
Triangle pattern trading isn't just about connecting lines on a chart; it's about grasping the underlying dynamics of supply and demand. These patterns, formed by converging trendlines, represent periods of price consolidation. During these times, neither buyers nor sellers have a clear upper hand. This creates a coiled spring effect, with the eventual breakout often leading to substantial price movements. Identifying a triangle early can provide a significant advantage in anticipating potential market shifts.
The Psychology of Triangles
The true strength of triangle patterns resides in the market psychology they reveal. As prices fluctuate within the narrowing confines of a triangle, trader indecision grows. This uncertainty fuels anticipation and sets the stage for a powerful breakout. For instance, within an ascending triangle, buyers consistently push prices higher, encountering resistance at a specific price point. This suggests increasing buying pressure, potentially leading to an upward surge. You might find this interesting: How to master technical trading patterns for better trading results.
Volume and Validity
While the triangle's shape is important, volume patterns are essential for confirming its validity. Declining volume during triangle formation often indicates a weakening of the current trend and a build-up of potential energy. A volume spike during the breakout confirms the move's strength and reduces the chance of a false breakout. This makes volume a crucial indicator for validating the pattern and improving trading choices. The triangle pattern is a common tool in technical analysis, assisting traders in spotting trends and potential breakouts across various markets. Characterized by a narrowing trading range, it frequently appears after a significant uptrend or downtrend.
There are three primary types of triangle patterns:
- Ascending
- Descending
- Symmetrical
Ascending triangles are generally considered bullish, while descending triangles are bearish. The symmetry of the triangle is key to its predictive ability, as it often signals a balance between buyers and sellers. This balance can result in significant price movements when the breakout occurs. Learn more about triangle patterns here.
Timing Your Entry
Precise entry timing around a triangle breakout can greatly improve trading results. Entering too early carries the risk of being caught in a false breakout. Entering too late may mean missing a significant portion of the price move. Many successful traders wait for confirmation, typically a candle closing outside the triangle boundaries, combined with increased volume. This approach minimizes risk and maximizes profit potential. Triangle patterns appear across various sectors, including Financial Services. Further understanding of broader market trends and technical indicators can enhance your triangle pattern trading strategy.
The Numbers Behind Triangle Pattern Success
Triangle pattern trading hinges on understanding probability and market dynamics. This helps traders anticipate breakouts and capitalize on price movements. But how effective are these patterns? Let's explore the statistical evidence behind triangle pattern trading.
Statistical Significance of Triangle Patterns
The success of triangle patterns lies in their ability to predict price direction. This predictive power comes from the balance between buyers and sellers as the pattern forms. The infographic below shows a typical ascending triangle pattern on a candlestick chart, highlighting the converging trendlines that define its structure:
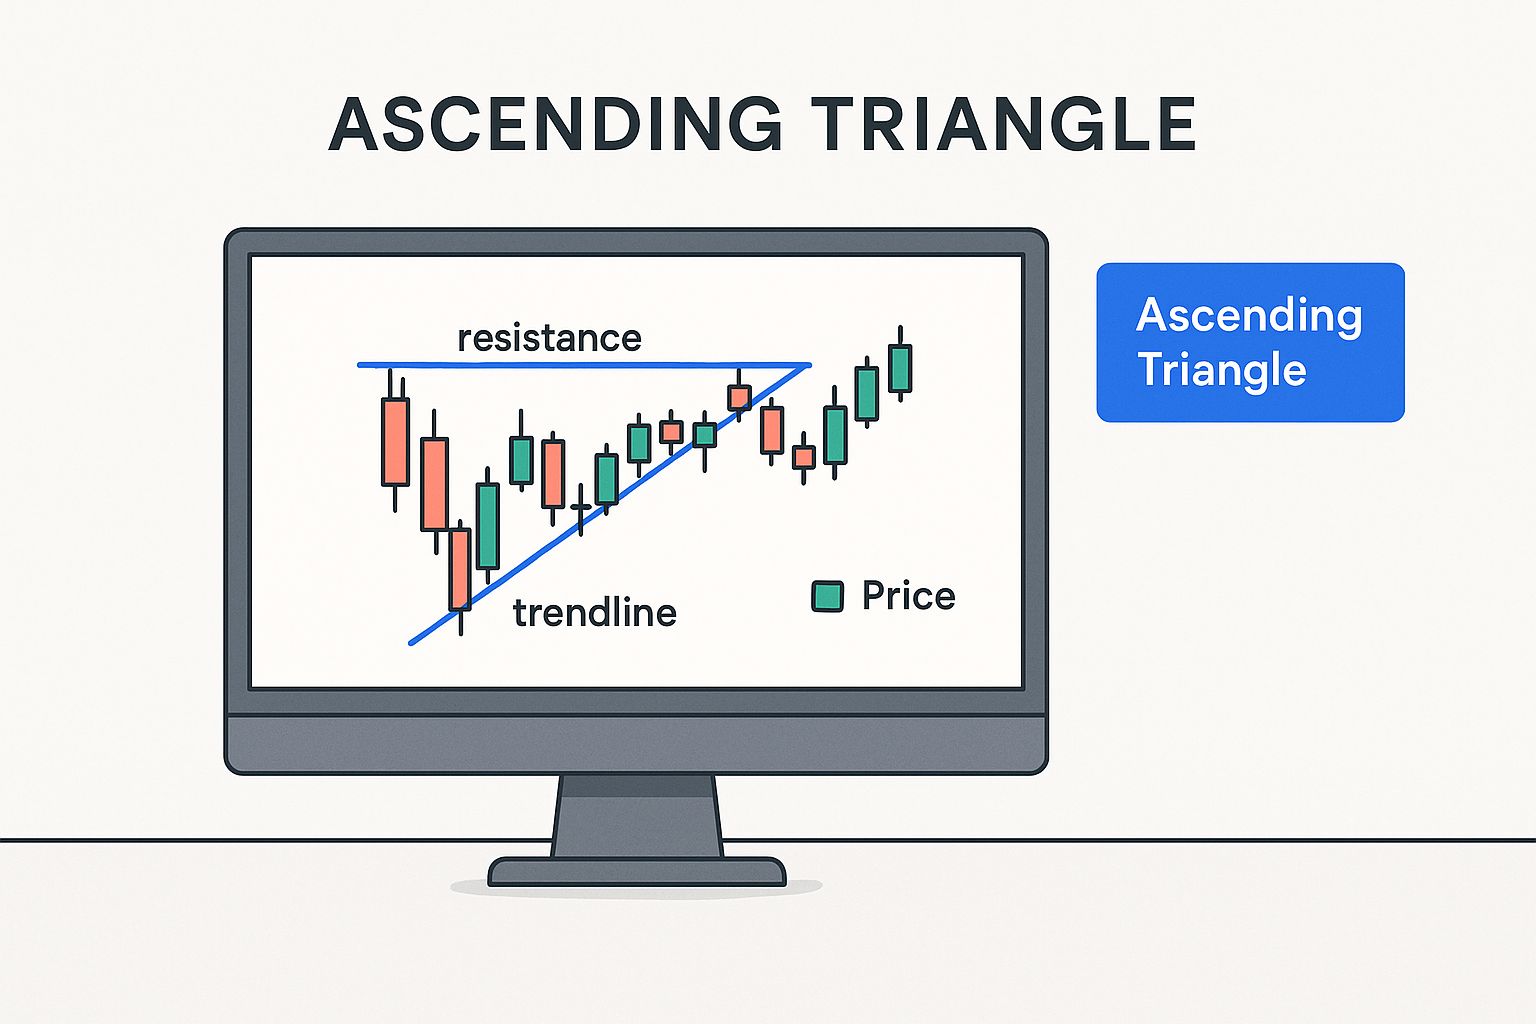
The ascending triangle shows increasing buying pressure against a resistance level, building anticipation for a potential breakout. Statistical analysis provides compelling evidence of breakout success rates. For example, the Samurai Trading Academy found that the descending triangle has a success rate of approximately 72.93% as a continuation pattern. The ascending triangle shows similar success at about 72.77%. This means the price continues in the direction of the prior trend almost three-quarters of the time. This statistical foundation makes triangle patterns a useful tool for technical analysts.
Volatility, Volume, and Pattern Completion
Several factors impact the success rates of triangle patterns. Market volatility is key. In highly volatile markets, breakouts from triangles are often more explosive, offering greater profit potential. However, increased volatility also increases the risk of false breakouts.
Volume confirmation is therefore crucial. A surge in volume during a breakout validates the move and makes a false signal less likely. Strict pattern completion criteria, such as waiting for a candle to close outside the triangle’s boundaries, can further improve the reliability of triangle pattern breakouts.
Risk-Reward Ratios and Mathematical Edge
Calculating realistic risk-reward ratios is vital for successful triangle pattern trading. The risk is the distance between the entry point and the stop-loss order, usually placed just outside the triangle’s opposite boundary. The potential reward is determined by projecting the triangle's height from the breakout point.
This helps traders find setups with favorable risk-reward profiles, maximizing potential gains while minimizing potential losses. This analytical approach provides traders with a mathematical edge, allowing for more calculated trading decisions based on historical data and statistical evidence.
To further illustrate the different types of triangle patterns and their respective performance, let's examine the following table:
Triangle Pattern Success Rates Comparison Statistical performance data showing success rates and reliability metrics for different triangle pattern types
| Pattern Type | Success Rate | Best Market Conditions | Typical Duration |
|---|---|---|---|
| Ascending Triangle | 72.77% | Trending Markets | Several Days to Weeks |
| Descending Triangle | 72.93% | Trending Markets | Several Days to Weeks |
| Symmetrical Triangle | Varies, generally lower | Consolidating Markets | Several Days to Weeks |
As this data highlights, ascending and descending triangles perform well in trending markets. Their success rates are impressively consistent. Symmetrical triangles, forming during consolidation, have more variable outcomes.
Applying Triangle Patterns Across Timeframes
Triangle patterns work across various timeframes, from short-term charts for scalping to longer-term charts for swing trading. On shorter timeframes, triangles form and resolve quickly, offering fast trading opportunities. On daily or weekly charts, triangles can indicate more significant price movements and provide long-term market direction insights. This adaptability makes triangle patterns useful for both short and long-term trading strategies.
How Successful Traders Actually Use Triangle Patterns
Moving beyond textbook definitions, let's explore how successful traders use triangle patterns in real-world trading. These patterns aren't just theoretical; they're practical tools used by experienced traders across various markets.
Practical Applications of Triangle Patterns
Professional traders don't just look for perfect textbook triangles. They consider the context, analyzing prior price action, overall market sentiment, and related technical indicators. Converging trendlines are important, but so is confirmation from other indicators like volume. For example, decreasing volume during triangle formation often precedes a breakout. Traders also consider the timeframe. A triangle pattern on a daily chart is more significant than one on a 5-minute chart.
Case Studies Across Markets
Triangle patterns appear in all financial markets. In forex, traders might use a symmetrical triangle on a currency pair like EUR/USD to anticipate a breakout and trend continuation. Forex traders often look for confirmations from additional technical analysis tools and indicators. Stock traders might spot an ascending triangle, signaling a buying opportunity. Commodities traders might observe a descending triangle in gold futures, suggesting a bearish outlook. Cryptocurrency traders use triangle patterns in assets like Bitcoin to identify potential price reversals or continuations. Historical case studies show triangle patterns can be effective. For instance, forex traders have used them for various timeframes, from short-term intraday to longer-term weekly strategies. Triangle patterns are versatile, allowing traders to adapt to different market conditions and timeframes. Economic news and events can influence breakouts, making patterns more predictive. Explore this topic further here.
Timing Entries and Managing Positions

Successful traders emphasize precise entry and exit strategies. They often wait for a confirmed breakout—a candle closing outside the triangle—before entering. Premature entry can lead to losses from false breakouts, especially during low volume. A sudden volume spike often validates the breakout. Traders use stop-loss orders placed outside the triangle to manage risk and define profit targets based on the triangle's height or other technical measurements.
Trading Triangles Across Timeframes
Triangle patterns offer opportunities across multiple timeframes. Scalpers might use 1-minute or 5-minute charts. Day traders might focus on 15-minute or hourly charts. Swing traders look for triangles on daily or weekly charts. Each timeframe requires adjusting entry/exit strategies, stop-losses, and profit targets. Understanding these nuances is crucial. On shorter timeframes, traders must react quickly, while longer timeframes allow more considered decisions.
Spotting High-Quality Triangle Setups Before Others Do
Identifying a triangle pattern is one thing, but recognizing a high-probability setup before other traders is where the real edge lies. This involves looking beyond the basic triangle shape and delving into the subtleties of volume analysis, trendline validation, and other confirming factors. These insights can give you a head start in triangle pattern trading.
Volume Analysis: Confirming the Breakout
Volume plays a crucial role in validating triangle patterns. Decreasing volume during the triangle's formation suggests a period of consolidation and potential energy buildup. Conversely, a surge in volume during the breakout confirms the move's strength and reduces the likelihood of a false breakout. Think of it like a coiled spring: the tighter it gets, the more powerful the release.
Trendline Validation: The Importance of Clean Breaks
Clean breaks of the trendlines are critical for confirming the validity of triangle patterns. A decisive move through either the upper or lower trendline, accompanied by increased volume, indicates a strong breakout. Hesitant price action or multiple false breaks can signal a weak or invalid pattern. Imagine a rocket launching: a clean lift-off signifies a successful mission.
Confluence Factors: Increasing Pattern Reliability
Several confluence factors can increase the reliability of triangle patterns. These include:
- Support and Resistance Levels: A triangle forming near significant support or resistance levels enhances its breakout potential.
- Fibonacci Levels: Confluence with Fibonacci retracements or extensions can add further weight to the pattern.
- Other Technical Indicators: Combining triangle patterns with indicators like RSI or MACD can provide additional confirmation.
These factors act like reinforcing beams, strengthening the overall pattern structure. Professional traders using advanced pattern recognition techniques often identify profitable triangle setups 2-3 days earlier than retail traders, resulting in better entry points and higher success rates. Explore this topic further here.
Advanced Concepts: Triangle Variations and Nested Patterns
Beyond the basic triangle types, there are more advanced variations to consider. These include ascending, descending, and symmetrical triangles. Understanding these variations provides a deeper insight into market dynamics. Another aspect is nested triangles, where smaller triangles form within larger ones. This can indicate a longer-term consolidation phase. These advanced patterns offer a more nuanced market view for experienced traders.
Multiple Timeframe Analysis: Confirming and Refining Entries
Analyzing triangle patterns on multiple timeframes can confirm the pattern's validity and refine entry timing. A triangle forming on a daily chart, confirmed by a similar pattern on a 4-hour chart, increases the breakout’s significance. This multi-perspective approach empowers traders to enter positions with increased confidence.
Continuation vs. Reversal Triangles: Determining Market Context
Distinguishing between continuation and reversal triangles is vital. Continuation triangles suggest the prevailing trend will resume after the breakout, while reversal triangles indicate a potential trend change. This determination depends on the surrounding market context, including prior price action and overall market sentiment. Identifying the type of triangle shapes your trading strategy, ensuring your approach aligns with the anticipated market direction.
Protecting Your Capital While Trading Triangle Patterns
Identifying triangle patterns accurately is only half the battle. Without a solid risk management plan, even the most promising setup can lead to losses. This section explores how to protect your trading capital and maximize profits when trading triangle patterns.
Setting Precise Stop-Loss Orders
Stop-loss orders are your first line of defense. They limit potential losses by automatically exiting a trade if the price moves against you. The triangle's structure provides a natural framework for stop placement. Generally, place your stop-loss just outside the triangle's opposite boundary.
In a bullish ascending triangle, the stop-loss goes slightly below the lower trendline. Conversely, in a bearish descending triangle, it sits just above the upper trendline. However, be mindful of false breakouts. A slightly wider stop-loss might be necessary to avoid being prematurely stopped out of a valid breakout.
Position Sizing for Explosive Moves and False Breakouts
Position sizing, determining how much capital to risk on each trade, is another crucial element. Triangle patterns can lead to significant price swings, both up and down. Your position size should reflect this volatility.
A smaller position size limits losses if a false breakout occurs. If you're highly confident in the breakout, a larger position size allows you to capitalize on the potential move. Balancing risk and reward is key.
Defining Realistic Profit Targets
Knowing when to take profits is as important as knowing when to cut losses. Profit targets define your exit point for a winning trade. Pattern measurement techniques offer a simple method. Project the height of the triangle from the breakout point to estimate a potential price target.
Fibonacci extensions, based on Fibonacci ratios like 1.618 or 2.618, provide another approach. Combining these techniques with market analysis helps establish realistic profit targets. You might be interested in: How to master supply and demand zones.
Mastering the Psychology of Triangle Trading
Triangle pattern trading requires more than just technical analysis. Patience and discipline are essential. During the triangle's formation, avoid premature entries. Wait for a confirmed breakout.
Once a breakout occurs, stick to your trading plan. Manage your emotions and avoid impulsive decisions driven by fear or greed. A balanced approach helps navigate the inherent uncertainties of trading.
Portfolio Management for Multiple Setups
Many traders track multiple triangle setups simultaneously. Effective portfolio management becomes paramount. Diversifying across various setups limits the impact of any single trade.
Allocate a specific percentage of your portfolio to each trade. This prevents overexposure to any one position and protects your overall capital. This disciplined strategy fosters long-term, sustainable trading.
To further illustrate risk management within triangle pattern trading, let's examine the following comparison table. It outlines the key risk factors and how they apply to different triangle types.
Triangle Pattern Risk Management Framework
Comprehensive risk management guidelines comparing stop-loss placement, position sizing, and profit targets for different triangle patterns
| Risk Factor | Ascending Triangle | Descending Triangle | Symmetrical Triangle |
|---|---|---|---|
| Stop-Loss Placement | Below Lower Trendline | Above Upper Trendline | Outside Opposite Boundary |
| Position Sizing | Adjust for Volatility and Conviction | Adjust for Volatility and Conviction | Adjust for Volatility and Conviction |
| Profit Targets | Pattern Measurement, Fibonacci Extensions | Pattern Measurement, Fibonacci Extensions | Pattern Measurement, Fibonacci Extensions |
This table demonstrates the importance of adapting your risk management approach to each specific triangle pattern. While the general principles remain consistent, the specific placement of stop-losses and profit targets varies based on the triangle's geometry and the anticipated direction of the breakout.
Key Takeaways For Triangle Pattern Trading Success
This section offers a practical guide to using triangle pattern trading strategies effectively. We'll explore the critical differences between successful traders and those who struggle, focusing on efficient pattern recognition, strong risk management, and setting achievable performance goals.
Essential Elements for Successful Triangle Pattern Trading
Several crucial factors contribute to successful triangle pattern trading. First, a robust trading plan is essential. This plan should detail clear entry and exit rules, how to size your positions, and parameters for managing risk. Much like a driver uses a maintenance checklist to keep their car running smoothly, traders need a structured plan. A trading plan provides essential guidance for navigating market conditions.
Second, accurate pattern recognition is paramount. This involves correctly identifying valid triangle formations and distinguishing them from misleading signals. Recognizing the subtleties of ascending, descending, and symmetrical triangles, as covered previously, is essential for informed trading.
Third, effective risk management is non-negotiable. This includes placing appropriate stop-loss orders and sticking to your predetermined position sizes. Managing risk safeguards your capital and allows you to weather market fluctuations.
Finally, maintaining realistic expectations is vital. Accepting that losses are inevitable and part of the trading process is crucial for long-term success. Discipline and avoiding emotional decisions are key traits of successful traders.
Avoiding Common Mistakes in Triangle Pattern Trading
Many traders stumble into common pitfalls when trading triangle patterns. One frequent mistake is entering a trade too early, before a confirmed breakout. This can result in losses from false breakouts, especially when trading volume is low. Waiting for a decisive break of the trendline, coupled with increased volume, significantly improves the odds of a successful trade.
Another common error is neglecting proper risk management. Failing to set stop-loss orders or overextending your capital on a single trade can quickly deplete your account. A well-defined risk management plan is critical for preserving capital and achieving consistent profitability.
Furthermore, many traders underestimate the importance of multiple timeframe analysis. Confirming a triangle pattern on longer timeframes adds greater weight to the setup and increases the likelihood of significant price movements. For example, a triangle observed on a daily chart, reinforced by a similar pattern on a 4-hour chart, offers stronger confirmation.
Developing Your Triangle Trading System
Building a personalized triangle trading system involves several steps. First, develop a pattern recognition checklist. This checklist should define the specific criteria for identifying legitimate triangle formations. Key elements include converging trendlines, volume patterns, and price action within the triangle itself.
Next, create a clear risk management framework. This framework should outline your rules for stop-loss placement, position sizing guidelines, and profit-taking strategies. Adapting these parameters to your personal risk tolerance and trading style is essential.
Finally, integrate alerts and screening tools to improve your workflow. Setting alerts for potential breakouts and using scanners to find developing patterns can save valuable time and allow you to quickly seize opportunities. Consider using a platform like ChartsWatcher for advanced charting and scanning capabilities.
Tracking Performance and Continuous Improvement
Monitoring your trading performance is vital for ongoing improvement. Track key metrics such as win rate, average profit per trade, and maximum drawdown. This data offers valuable insights into your triangle pattern trading strategy's effectiveness.
Regularly review your trades, identifying areas for improvement. Analyze both winning and losing trades to understand what worked well and where you can refine your approach. This process of continuous learning and adaptation is essential for maximizing your trading potential. Consistent evaluation and adjustment of your strategies are key to achieving measurable, consistent results in your portfolio.
