Trading the Inverted Head and Shoulder Pattern
If you've spent any time looking at charts, you've probably heard traders talk about the “inverted head and shoulders.” It’s one of those classic patterns for a good reason: it often signals a major shift in a stock's story, marking a potential end to a long, painful downtrend.
Think of it as the final act of a power struggle between buyers and sellers. For weeks or months, the sellers have been in complete control, shoving the price lower and lower. The inverted head and shoulders pattern is the moment the buyers finally draw a line in the sand and start to fight back.
What the Inverted Head and Shoulder Pattern Reveals
This pattern doesn't just pop up randomly; it tells a compelling story about a stock hitting rock bottom and finding its footing. Each piece of the formation reveals a crucial chapter in this turnaround tale, showing how bearish momentum slowly dies out and bullish confidence takes over.
It’s built from four key parts, and understanding what each one means is key to trading it effectively.
-
The Left Shoulder: This first dip is part of the existing downtrend. But the small rally that follows is the first hint that buyers are starting to show some interest, stepping in where they were previously absent.
-
The Head: This is the sellers' last big push. They manage to drive the price to a new, lower low. But the rally off this bottom is surprisingly strong and aggressive—a huge red flag for anyone shorting the stock. This is where serious buying power starts to make its presence felt.
-
The Right Shoulder: The sellers try one more time to take control, but they run out of steam. They can't even push the price down to the previous low set by the head. This "higher low" is a critical sign that the bears are exhausted and losing their grip.
-
The Neckline: This is the line in the sand. Drawn by connecting the peaks after the left shoulder and the head, this resistance level is what holds the pattern in check. A decisive break above this line is the confirmation many traders wait for—the signal that the buyers have officially won the battle.
To make it even clearer, here's a quick breakdown of how these components fit together and what they signal about market psychology.
Key Components of the Inverted Head and Shoulder Pattern
| Component | Description | What It Signals |
|---|---|---|
| Left Shoulder | An initial low in an existing downtrend, followed by a minor rally. | First sign of buying pressure emerging. Sellers are still in control, but not completely unopposed. |
| The Head | A second, deeper low that undercuts the left shoulder, followed by a strong rally back to resistance. | Sellers' final, exhaustive push. The strong rebound shows significant buyer commitment at lower prices. |
| Right Shoulder | A third low that is higher than the head, showing sellers are losing strength. | Fading bearish momentum. Sellers can no longer push the price to new lows, indicating a shift in power. |
| The Neckline | A resistance line connecting the peaks of the rallies between the shoulders and the head. | The final confirmation level. A breakout above this line signals the downtrend is over and a new uptrend is likely beginning. |
Putting it all together, this pattern provides a logical roadmap of a market bottom, turning a messy chart into a clear narrative of shifting sentiment.
Why This Pattern Matters to Traders
The real value of the inverted head and shoulders is its reliability in forecasting a major trend reversal from bearish to bullish. It's not just a cool-looking shape on a chart; it’s a visual footprint of seller exhaustion and growing buyer conviction. That predictability has made it a cornerstone of technical analysis for decades.
The inverted head and shoulders is widely considered one of the most dependable bullish reversal patterns. It gives traders a clear, structured way to spot potential market bottoms before the new uptrend really gets going.
History backs this up. Numerous backtests run on trading strategies built around this pattern have shown impressive performance across different markets. This suggests that traders who can properly spot the setup and act on it have historically had a statistical edge. For more details on its historical performance, you can explore these findings on the pattern's effectiveness.
By understanding these components, you can transform a complex chart into a simple story, helping you anticipate a trend reversal with much more clarity and confidence.
How This Bullish Pattern Takes Shape
Think of an inverted head and shoulder pattern not just as a squiggle on a chart, but as the story of a power shift unfolding in real-time. Every dip and rally is a chapter in the struggle between buyers and sellers, and it all leads up to a potential, explosive trend reversal. When you learn to read this sequence, you’re really learning to read the market's underlying psychology.
The whole formation is a battle of attrition. The sellers, who’ve been steering the ship during the downtrend, start to get tired. At the same time, buyers begin to sniff out a bargain and step in with more and more confidence. What you get is a predictable sequence that often signals the final exhaustion of the bears.
This visual breaks down the three key troughs that give the pattern its classic shape.
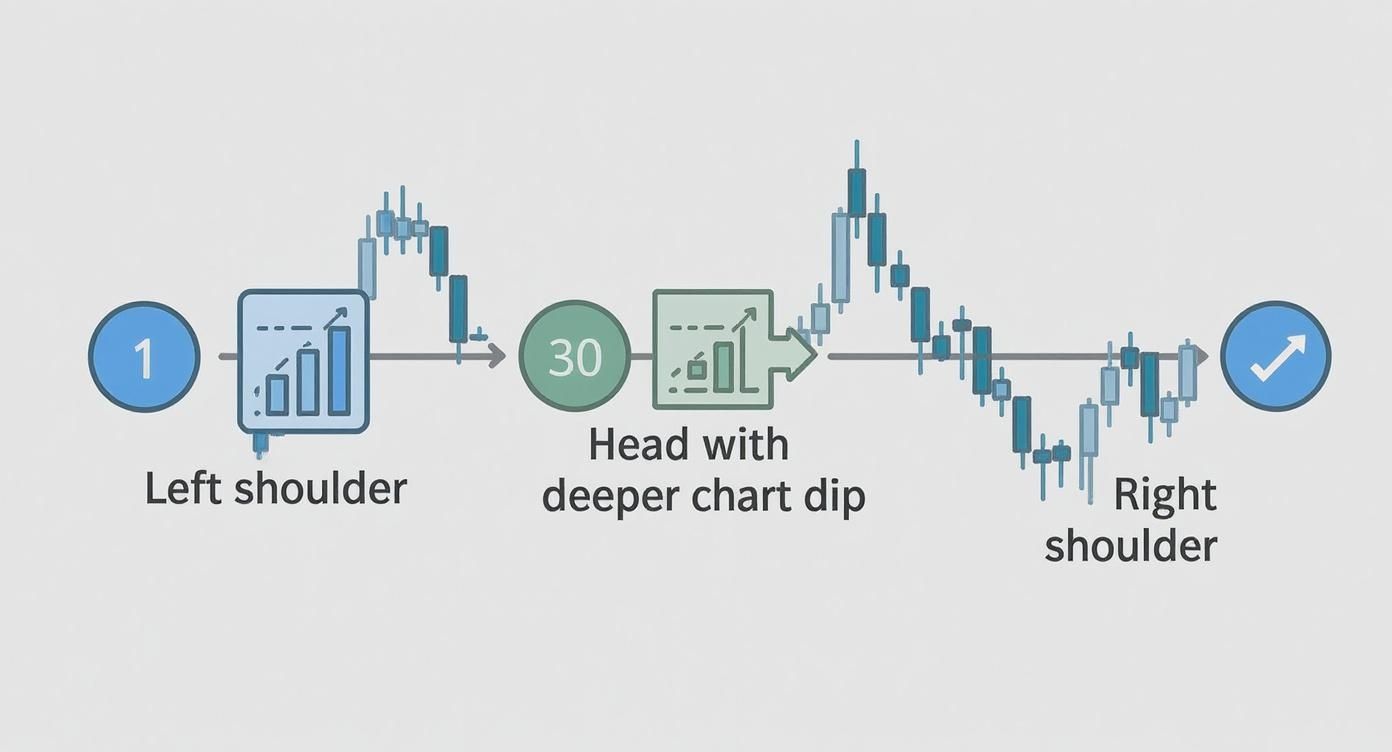
As you can see, the head is the absolute lowest point—peak desperation for the sellers. But the higher low of the right shoulder is the real clue; it tells you the sellers are losing their grip.
The Six Stages of Formation
To really get a feel for this pattern, it helps to break its development down into stages. This progression shows you exactly how control slips from the sellers' hands and into the buyers', setting the stage for a new uptrend.
Recognizing the inverse head and shoulders pattern involves six key stages that technical traders watch for. It all starts with a downtrend that carves out the left shoulder—a low point followed by a minor bounce. Then comes the head, which plunges to a new low, deeper than both shoulders, marking peak bearish momentum.
Next, the right shoulder forms as another trough, but this one is higher than the head and roughly level with the left shoulder. This is a huge tell, signaling that sellers are weakening. Finally, a strong rally pushes the price up to test and break through the neckline, which confirms the pattern is complete and often signals an ideal entry point for a bullish trade. You can dive deeper into these formation steps over on tradingsim.com.
The key takeaway is that the right shoulder’s failure to make a new low is the most critical clue. It tells you that sellers are out of ammunition and that buyers are now willing to defend higher price levels.
Volume: The Ultimate Confirmation Tool
While the price structure tells most of the story, volume is what confirms it. Think of it this way: price action is the car, but volume is the fuel in the tank. A car can’t go far without gas, and a breakout rarely succeeds without a strong push from volume.
Here’s what you want to see:
- Declining Volume: As the head and right shoulder are forming, you’ll often see trading volume dry up. This reflects fading interest from sellers and a general sense of indecision in the market.
- Breakout Surge: This is the most important signal. As the price punches through the neckline, you should see a significant increase in volume. This surge shows that buyers are stepping in with conviction and are ready to take control.
A breakout on low volume is a major red flag. It suggests there's no real commitment from buyers and raises the odds of a "false breakout"—where the price quickly slumps back below the neckline. This is why volume analysis is an absolutely essential tool for trading the inverted head and shoulder pattern successfully.
Your Playbook for Trading the Breakout

Spotting an inverted head and shoulders pattern is a fantastic start, but turning that chart observation into a profitable trade takes a clear, repeatable plan. A solid strategy really boils down to three key decisions: knowing precisely when to get in, where to set your stop-loss for protection, and how to define a realistic profit target.
Get these three pillars right, and you’ll transform a simple pattern into a genuine trading opportunity.
Defining Your Entry and Exit Points
First up, you need to decide on your entry. There are two main ways to approach this, each with its own pros and cons.
The more aggressive method is to buy the moment the price closes decisively above the neckline. A strong surge in volume here is a great sign. This gets you into the move early but comes with the risk of getting caught in a "fakeout." If you're leaning this way, our guide on https://chartswatcher.com/pages/blog/breakout-trading-strategy-to-maximize-gains can help you nail the timing.
The second, more conservative entry is to wait for a retest of the neckline. It’s common for the price to break out, then pull back to test that old resistance level (the neckline) and see if it now holds as new support. Entering on this retest gives you more confirmation that the breakout is real and often provides a better risk-to-reward setup. The only downside? If the price rockets up without looking back, you might miss the trade.
To help you decide, here’s a quick comparison of the two entry methods.
Trading Strategy Comparison
| Strategy | Entry Point | Pros | Cons |
|---|---|---|---|
| Aggressive Breakout | Enter as soon as the price closes above the neckline. | Catches the move early, potentially maximizing profit. | Higher risk of being caught in a false breakout. |
| Conservative Retest | Wait for the price to pull back and successfully test the neckline as support. | Higher confirmation that the breakout is valid; often a better risk/reward ratio. | You might miss the trade if the price doesn't retest. |
Choosing between these depends on your personal risk tolerance and how much confirmation you need before pulling the trigger.
Managing Your Risk and Taking Profits
Next, you absolutely must define your risk with a stop-loss. This is non-negotiable. A logical spot for your stop is just below the low of the right shoulder. Why there? If the price drops back to that level, it invalidates your entire trade thesis that the sellers are exhausted and the downtrend is over. It gives the trade enough breathing room without exposing you to a massive loss.
A well-placed stop-loss isn't about expecting to lose; it's about ensuring that if you're wrong, the cost is small and manageable, protecting your capital for the next opportunity.
Finally, you need a target to take your profits. The classic way to do this is by measuring the vertical distance from the bottom of the head up to the neckline. You then take that same distance and project it upward from your breakout point. This gives you a data-driven, objective price target for where the rally might run out of steam, helping you plan your exit with a clear goal.
Of course, identifying the pattern and entry points is only part of the battle. Your trading playbook must include effective risk management strategies to protect your capital in any market condition.
Bringing the Pattern to Life on Real Charts
Theory is one thing, but spotting an inverted head and shoulders pattern unfolding on a live chart is where the rubber really meets the road. To bridge that gap, let's break down how this classic reversal signal shows up in the wild, turning brutal downtrends into fresh bullish rallies. Think of these as practical case studies that show the pattern's true personality.
We're going to move past the clean, perfect diagrams and look at actual price history. We'll focus on the context of the trend leading into the pattern, the all-important volume spike on the breakout, and what happened next. This is how you build the kind of pattern recognition muscle that lets you trade with confidence. When you see it on a real chart, the market psychology behind the moves becomes crystal clear.

A Case Study in a Major Stock
You can find the inverted head and shoulders at the bottom of some of the most significant market turnarounds in history. Take Tesla, Inc. (TSLA), for example. Its daily charts have shown textbook examples of this pattern during recovery phases right after steep sell-offs.
With a high-volume, large-cap stock like Tesla, a confirmed pattern often kicks off a powerful rally. It's not uncommon to see gains of 15-30% over the following weeks. You can read more about trading this classic pattern to see how it works across different assets.
This brings up a crucial point: the pattern is most reliable when it forms in highly liquid, widely-followed stocks. Why? Because the shift from selling pressure to buying demand is unmistakable, and that big volume spike on the breakout is like a giant vote of confidence from the market.
Adding Layers of Confirmation
While the pattern is a solid signal on its own, smart traders rarely rely on just one piece of evidence. Pairing it with other technical tools—a practice known as confluence—can seriously stack the odds in your favor. You're basically looking for multiple signals that all point to the same conclusion.
Here are a couple of my favorite tools to use with the inverted head and shoulders:
- Relative Strength Index (RSI): Keep an eye out for bullish divergence. This is when the price makes the lowest low of the "head," but the RSI indicator prints a higher low. It’s a subtle clue that the bears are running out of steam, even as the price takes one last dip.
- Moving Averages: A breakout that also pushes the price back above a key moving average, like the 50-day, adds another layer of proof. It tells you the trend is truly starting to shift from bearish back to bullish.
Combining a classic price pattern with a momentum indicator like the RSI gives you a much richer story. You’re not just seeing the shape of a potential reversal; you're seeing the underlying strength that confirms it.
By studying these real-world examples and learning to stack indicators, you graduate from simply spotting a pattern to building a rock-solid trading plan. This is the difference between basic recognition and strategic execution.
Common Mistakes and How to Avoid Them
Even a classic, reliable setup like the inverted head and shoulders can burn you if you fall into a few common trading traps. Honestly, knowing what not to do is just as important as spotting the pattern in the first place. Think of this as your pre-flight checklist to keep your capital safe and tilt the odds in your favor.
The biggest mistake I see traders make? FOMO. Fear Of Missing Out. They see the price creeping up toward the neckline and get antsy. They jump in early, trying to front-run the breakout. But if you buy before that neckline officially breaks, you’re just buying straight into a wall of resistance. That's a low-probability trade, plain and simple.
Patience is a real edge in trading. Waiting for a confirmed close above the neckline isn't just a suggestion—it's the discipline that separates guessing from trading. It stacks the odds on your side and keeps impulse out of the equation.
Misinterpreting Key Signals
Another killer mistake is ignoring volume. A breakout that happens on weak or dying volume is a massive red flag. It’s like hearing a car engine trying to start but never quite turning over. It tells you there's no real conviction from buyers, which dramatically increases the risk of a "false breakout"—where the price pokes its head above the line only to get slammed right back down. A genuine, powerful breakout almost always comes with a big surge in trading activity.
Drawing the neckline incorrectly is another easy way to get into trouble. If your trendline is off, your entire trade setup is built on a faulty foundation. The neckline has to connect the peaks between the shoulders and the head. Draw it too high, and you’ll get in late. Draw it too low, and you'll jump the gun on a fake signal.
Finally, don't choke your trade with a stop-loss that's too tight. Placing it just a few cents below your entry might feel safe, but it gives the trade zero room to breathe. Markets are noisy. Normal price wiggles can easily knock you out of a perfectly good trade before the real move even gets started. A much more logical spot for your stop is just below the low of the right shoulder. If the price drops that far, the pattern's structure is broken anyway, and you want to be out.
By sidestepping these common errors, you move from just reacting to the market to executing a well-defined, strategic plan.
Automating Your Pattern Search with ChartsWatcher
Let's be honest: manually scanning hundreds of charts for a specific setup like the inverted head and shoulders is a brutal, time-consuming grind. It's just not practical.
In today's fast-moving markets, opportunities can pop up and vanish in the blink of an eye. This is where automation becomes a trader's best friend, shifting your workflow from tedious hunting to focused, strategic analysis.
Instead of spending hours searching for patterns, you can let technology do the heavy lifting. A solid scanning tool can watch the entire market in real-time, flagging potential setups the moment they start taking shape. This frees you up to concentrate on what actually makes you money: validating the pattern, planning your trade, and managing your risk.
Setting Up a Custom Scan
With a platform like ChartsWatcher, you can build a custom scan laser-focused on finding the inverted head and shoulders pattern. The process is surprisingly simple, letting you dial in the precise criteria that fit your trading style. You can filter by market, timeframe, and even the pattern's stage of completion.
Here’s a glimpse of a typical dashboard where you can build and manage your scans.
This kind of interface lets you run multiple automated scans at once, giving you a bird's-eye view of emerging opportunities across different stocks, forex pairs, or crypto assets.
You could, for example, tell the scanner to only alert you when a pattern’s neckline is breached with a significant spike in volume. This ensures you only get notifications for high-probability setups that are ready for action. This level of customization turns the scanner from a simple tool into a personal trading assistant that works for you 24/7.
The real goal of automation isn't just to save time—it's to improve precision. By setting clear, objective rules for your scan, you take emotional guesswork out of the equation and ensure you only act on setups that meet your exact standards.
You can get alerts delivered straight to your email, desktop, or phone, so you never miss a potential breakout, even when you're away from your screen. To see this in action, you can explore the powerful features of a professional-grade stock market scanner. This systematic approach keeps you ready to pounce on the best opportunities the market has to offer.
Common Questions Answered
Even with a solid game plan, you're bound to have questions when you first start trading a new pattern. Let's tackle some of the most common ones that come up with the inverted head and shoulders, helping to lock in the concepts we've covered.
How Is This Different from a Standard Head and Shoulders?
The big difference is the story they tell about the market's next move. A standard head and shoulders pattern is bearish—it's a warning sign that a strong uptrend is losing its mojo and might be ready to roll over. It looks exactly like it sounds: three peaks, with the middle "head" being the highest.
The inverted head and shoulders is simply its mirror image, making it a powerful bullish signal. It shows up at the tail end of a downtrend, suggesting that the sellers have finally run out of gas and a brand new uptrend is about to kick off. Instead of peaks, you get three troughs, with the middle one dipping the lowest.
Think of it this way: the standard version screams that a top is forming, while the inverted one signals that a bottom is likely in. They are bullish and bearish opposites, each signaling a trend reversal from opposite directions.
How Reliable Is This Pattern?
In the world of technical analysis, the inverted head and shoulders is considered one of the more trustworthy reversal patterns out there. But—and this is a big "but"—its success rate skyrockets when you wait for the right confirmation. No chart pattern is a sure thing, which is why smart risk management is non-negotiable.
So, what confirms the pattern and gives you the green light?
- A clean, decisive price close above the neckline.
- A major increase in trading volume as the breakout happens.
A breakout that occurs on weak volume is a huge red flag. It often means the move doesn't have enough conviction behind it and could fizzle out just as quickly as it started.
What Is the Best Timeframe to Use?
One of the great things about this pattern is its versatility. You can spot it on just about any timeframe, whether you're a day trader glued to a 5-minute chart or a long-term investor analyzing a weekly chart. The underlying market psychology—the battle between buyers and sellers—plays out the same way regardless of the duration.
That said, it's widely agreed that patterns forming over longer periods, like on daily or weekly charts, carry more weight. These bigger formations usually lead to more significant and lasting price moves compared to the smaller ones you'll find on intraday charts.
Ready to stop searching and start analyzing? ChartsWatcher automates pattern recognition across any market, delivering real-time alerts for high-probability setups like the inverted head and shoulder. Find your next trade faster at https://chartswatcher.com.
