Trading the Head and Shoulder Pattern
The head and shoulders pattern is a classic chart formation that technical analysts watch for like a hawk. When you see it, it’s often a big warning sign that a strong uptrend might be running out of gas and getting ready to reverse.
Think of it as a three-peak structure on a price chart. The middle peak (the head) is the highest, with two smaller peaks on either side (the shoulders). Once the price breaks decisively below the support line connecting the troughs—what we call the neckline—it’s a strong signal that the bulls have lost control.
Decoding the Market's Story
A head and shoulders pattern isn’t just a random shape; it tells the story of a battle between buyers and sellers. It’s the final, dramatic act where momentum fades, doubt creeps in, and the balance of power finally shifts.
Imagine a market in a healthy uptrend. Buyers are in charge, pushing prices higher. But eventually, their conviction starts to waver. The head and shoulders pattern captures this entire psychological shift, from peak confidence to exhaustion.
It’s one of the most reliable reversal patterns out there, which is why traders love it. You’ll find it on all kinds of charts and timeframes, whether you’re day trading the 5-minute chart or looking at a long-term weekly view.
The Anatomy of the Pattern
To really master this pattern, you have to understand its four key parts. Each piece of the puzzle reveals what’s happening in the minds of traders.
-
The Left Shoulder: The uptrend is still going strong. Buyers push the price to a new high before some profit-taking causes a minor pullback. This first peak and dip form the left shoulder. So far, everything looks normal.
-
The Head: The bulls rally again, feeling confident. They manage to push the price to an even higher peak than the left shoulder. But this is often the last gasp. The pullback that follows is usually sharper and deeper, a clear sign that sellers are waking up and gaining strength.
-
The Right Shoulder: Buyers try to make one last push, but they just don’t have the same energy. The rally stalls out at a lower high, well below the peak of the head. This failure is a huge red flag—it shows the buying pressure is officially exhausted.
-
The Neckline: This is the most critical part of the pattern. Draw a line connecting the low points of the two pullbacks (the one after the left shoulder and the one after the head). This line is your neckline, the ultimate "line in the sand." A clean, decisive break below it confirms the pattern and signals that a new downtrend is likely underway.
Standard vs Inverse Head and Shoulders at a Glance
The head and shoulders pattern has a bullish twin, the Inverse Head and Shoulders, which signals a potential bottom and a reversal from a downtrend to an uptrend. Here’s a quick comparison to help you tell them apart.
| Characteristic | Standard Head and Shoulders (Bearish) | Inverse Head and Shoulders (Bullish) |
|---|---|---|
| Market Trend | Forms after an uptrend | Forms after a downtrend |
| Signal | Bearish Reversal (Top) | Bullish Reversal (Bottom) |
| Structure | Three peaks: central peak (head) is highest | Three troughs: central trough (head) is lowest |
| Confirmation | Price breaks below the neckline | Price breaks above the neckline |
| Volume Pattern | Volume often decreases on the right shoulder | Volume often increases on the right shoulder and breakout |
| Trading Action | Sell or Short | Buy or Long |
This table neatly summarizes how the same core concept can be flipped to identify completely opposite trading opportunities. Understanding both is key to reading market reversals effectively.
The Bullish Counterpart: The Inverse Pattern
Just as the standard pattern helps you spot a market top, its mirror image—the inverse head andshoulders pattern—is your go-to for finding a potential market bottom. It shows up after a prolonged downtrend and signals a powerful shift from sellers to buyers.
Everything is simply flipped upside down. You get two troughs (the shoulders) with an even deeper trough in the middle (the head). A breakout above the neckline is the confirmation that the bulls are back in town. You can dive deeper into this bullish setup in our detailed guide on how to effectively trade the inverted head and shoulders pattern.
The head and shoulders pattern's popularity stems from its accessibility and statistical reliability. Formations appearing at the top of uptrends show a high probability of completing their predicted downward move once the neckline is breached, offering traders a clear signal. Learn more about the pattern's effectiveness from technical analysis experts.
How to Reliably Identify the Pattern
Moving from theory to a live chart requires a trained eye and a solid checklist. Anyone can spot three bumps on a chart, but identifying a high-probability head and shoulders pattern means digging deeper and understanding the subtle cues that signal a real shift in market control. Think of yourself as a detective building a case for a trend reversal—every piece of evidence matters.
The most obvious clue is the relationship between the peaks. The head absolutely must be the highest point, towering over both shoulders. If all three peaks are hovering around the same level, you're likely looking at a triple top, which is a different beast altogether. Ideally, the shoulders form at similar price levels, but a little variation is perfectly normal and expected in the real world.
This infographic breaks down the distinct stages of the pattern's formation, from the first shoulder to the last.
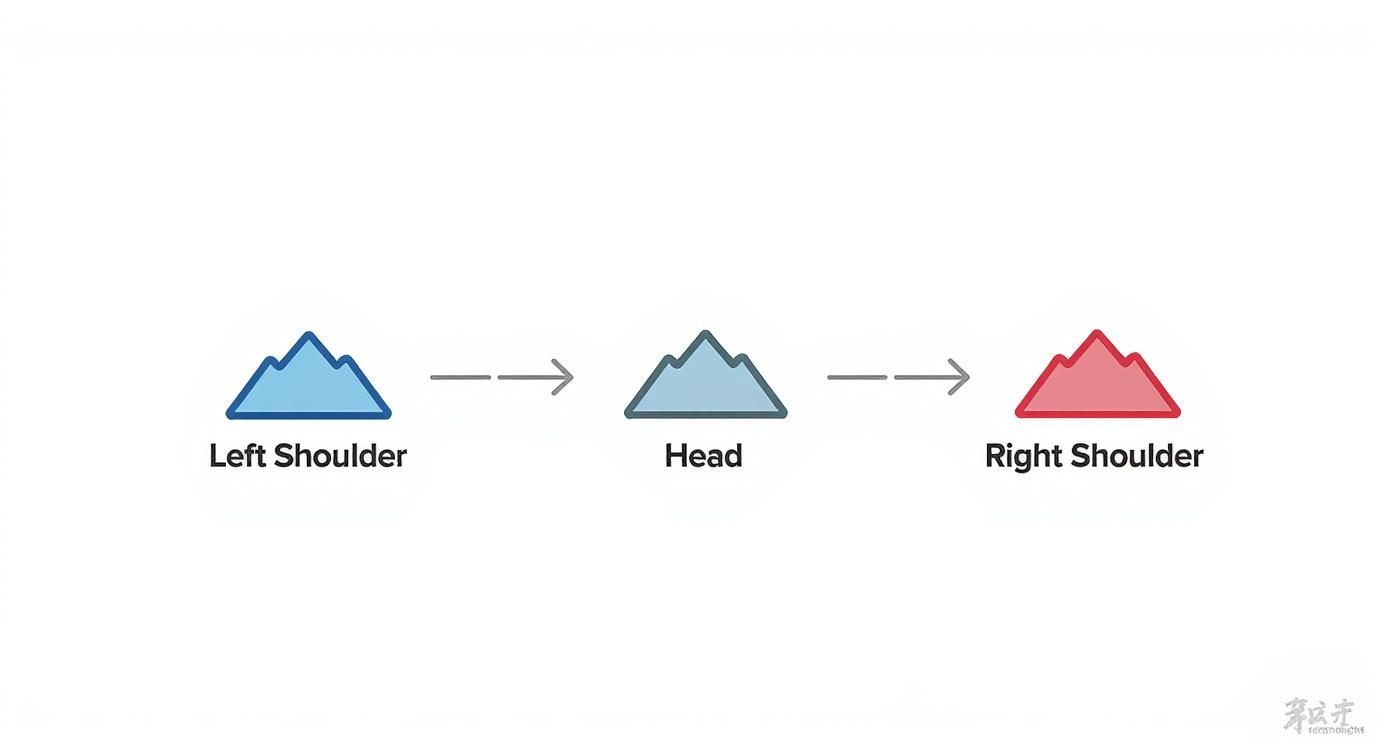
Each stage shows a subtle power shift between buyers and sellers, ultimately leading to the exhaustion of the old uptrend.
Using Volume as Your Truth Detector
Price tells you what happened, but volume tells you the conviction behind the move. Volume is arguably the most powerful confirmation tool you have for this pattern because it exposes the buyers' fading enthusiasm. A textbook setup will almost always have a distinct volume signature.
Here’s the story the volume bars should be telling you:
- Left Shoulder: Volume is usually strong and healthy. Buyers are confident, and the volume reflects the prevailing uptrend.
- Head: Here’s the first major red flag. As the price pushes to its final, highest peak, you'll often see lower trading volume than on the left shoulder. This tells you that fewer participants are driving the price up this time. Conviction is starting to dry up.
- Right Shoulder: Volume should be even lighter now. The fact that buyers can't even push the price back to the previous high—and on weak volume, no less—is a massive sign of exhaustion.
- Neckline Break: This is the moment of truth. A valid breakdown below the neckline must happen on a significant surge in volume. This spike confirms that sellers have finally wrestled control away with force.
A breakout on low volume is a huge warning sign of a potential "false breakout" or bear trap. High volume on the break is like a stamp of approval, validating the pattern’s bearish signal.
Layering on Additional Confirmation Tools
While price and volume give you a strong foundation, layering on other technical indicators can build an even more compelling case and boost your confidence. These tools simply help confirm the weakening momentum that the head and shoulders pattern is already hinting at.
A trader favorite is the Relative Strength Index (RSI), a momentum oscillator. As the pattern forms, you can often spot a bearish divergence. This happens when the price makes a higher high (from the left shoulder to the head), but the RSI makes a lower high. This discrepancy is a powerful tell, showing that the momentum behind the price rise is fading long before the neckline ever breaks.
Another excellent confirmation comes from candlestick patterns. Look for specific bearish candles forming at key spots, such as:
- At the peak of the right shoulder: A bearish engulfing pattern, a shooting star, or a dark cloud cover can signal the final rejection of higher prices before the fall.
- On the neckline break: A long, decisive bearish candle that closes well below the neckline adds serious weight to the breakout and shows the sellers mean business.
This pattern's reliability isn't just talk; it's well-documented. A historical analysis of 431 formations over six years found the pattern had a 93% success rate in predicting reversals, with an average price drop of 23% after the neckline break. With a false signal rate of only 7%, you can see why traders have so much respect for this setup. You can dig into these stats over at Quantified Strategies.
By combining the visual structure, volume analysis, and indicator confluence, you can learn to confidently separate the A-grade setups from all the market noise.
A Practical Framework for Trading the Pattern
Spotting a high-probability head and shoulders pattern is one thing, but turning it into a profitable trade is another. That takes a clear, rules-based plan. This is where we build a complete framework—covering precise rules for entering the market, managing risk, and setting logical profit targets.
A structured approach is what separates consistent traders from gamblers. It removes emotion and guesswork, leaving you with an actionable playbook for when the pattern appears.

This isn't just a set of loose suggestions; it's a systematic process designed to capitalize on the statistical edge this pattern provides. We'll cover two distinct entry methods, each catering to different risk appetites, along with non-negotiable rules for protecting your capital.
Choosing Your Entry Point
Once the right shoulder is formed and the price starts testing the neckline, you have a critical decision to make. There are two primary schools of thought on when to pull the trigger on a short position.
-
The Aggressive Entry (Breakout): This method involves jumping into the trade as soon as the price breaks and closes below the neckline. The main benefit? You're less likely to miss the move if the price tanks hard and fast. The downside, however, is a higher risk of getting caught in a "false breakout" or "bear trap," where the price briefly dips below support only to snap right back up.
-
The Conservative Entry (Retest): A more patient approach is to wait for the price to break the neckline and then return to retest it from below. This retest of the old support level, which should now act as new resistance, provides powerful secondary confirmation that sellers have taken control. Entering here often gives you a better risk-to-reward ratio, since your entry is closer to your stop-loss level.
Key Takeaway: Neither entry is universally "better." The aggressive entry is for traders who want to capture the entire move and are willing to accept more risk. The conservative entry is for those who prefer higher-probability setups and a more favorable risk profile. Your style, your call.
Setting Your Stop Loss for Capital Protection
A stop-loss order is your non-negotiable insurance policy. It defines the exact point at which your trade idea is proven wrong and gets you out before a small loss turns into a big one.
For the head and shoulders pattern, the placement is logical and built right into the structure. The most common and effective place to set your stop-loss is just above the peak of the right shoulder.
Why there? Simple. If the price rallies back up and surpasses the high of the right shoulder, the bearish structure is broken. The sellers have lost control, and your reason for being in the trade is gone. Placing the stop there gives the trade enough room to breathe without exposing you to a catastrophic loss.
Calculating Your Price Target
One of the most powerful features of the head and shoulders pattern is that it gives you a built-in, measurable price objective. No more guessing when to take profits. The calculation is straightforward and works the same way for both standard and inverse patterns.
Here’s the simple, two-step process:
-
Measure the Vertical Distance: Calculate the distance from the highest point of the head down to the neckline. This measurement captures the height of the pattern's volatility.
-
Project from the Breakout Point: Take that measured distance and project it downward from where the price broke the neckline. The resulting price level is your primary profit target.
This technique works because it assumes the momentum that built the pattern will carry the price a similar distance in the new direction. While it's a solid guideline, smart traders often consider taking partial profits at key support levels on the way down, rather than holding out for the full target. Locking in gains as the trade moves in your favor is never a bad idea.
How to Avoid Common Traps and False Signals
Even the most reliable chart patterns can throw a curveball now and then. The head and shoulders is a powerful formation, but it's far from foolproof. Knowing how to spot the common traps is what separates traders who get burned from those who learn to protect their capital and wait for only the best setups.
The most notorious trap is the false breakout. It’s a gut-wrenching scenario where the price pierces the neckline, sucking you into a short trade, only to violently snap back in the other direction. This move is a classic shakeout, designed to catch eager sellers off guard and stop them out for a loss before the market does something else entirely.

Learning the anatomy of a failed pattern is just as important as learning the real thing. When you can spot the red flags of a weak setup before you put money on the line, you’ll naturally filter out low-probability trades and give your strategy a serious edge.
Identifying a Weak Pattern Structure
Let's be clear: not all patterns are created equal. A sloppy, messy structure is often the first warning sign that something isn't right. A high-quality head and shoulders should be pretty obvious and relatively symmetrical. If you have to squint and tilt your head to make it fit, it’s probably a trade you should skip.
Here are a few tell-tale signs of a weak formation:
- Choppy Price Action: The swings that form the shoulders and head should be clean peaks and troughs. If the price action is erratic, overlapping, and messy, it screams indecision, not a clear shift in power from buyers to sellers.
- Inconsistent Volume: A textbook pattern has a distinct volume signature. Volume is typically high on the left shoulder, a bit lower on the head, and even lower on the right shoulder. If volume is random or—even worse—increases on the right shoulder, that’s a massive red flag. It suggests buyers aren't tired at all.
- A Funky Neckline: An extremely steep or poorly defined neckline makes it tough to find a reliable breakout point. You want to see a clear, relatively horizontal, or gently sloped line. It provides a much more dependable level to watch.
The Critical Importance of Market Context
A chart pattern never exists in a vacuum. This is probably the most overlooked aspect of pattern trading, and ignoring it is a recipe for disaster. Its reliability is massively influenced by the broader market trend.
Think of it this way: a perfect bearish head and shoulder pattern that forms during a raging bull market is fighting an uphill battle. The overwhelming buying pressure acts like a strong headwind against your short trade. The odds of a false signal or the pattern completely falling apart are way higher in this environment.
A pattern that lines up with the broader market trend is always going to have a higher probability of success. If you spot a bearish reversal pattern, zoom out and look for signs of weakness on higher timeframes to make sure the big picture supports your trade.
Patience: The Ultimate Trading Virtue
Honestly, the single most effective way to dodge false signals is to just be patient. The fear of missing out (FOMO) is a trader’s worst enemy. It’s that little voice that tells you to jump in right now before the pattern is fully confirmed.
Here are two simple rules to enforce patience and dramatically improve your trade quality:
- Wait for the Close: Never, ever enter a trade just because the price has poked through the neckline intraday. Always wait for the candle to close below the neckline on your chosen timeframe (e.g., a daily close for a daily chart). This one rule will filter out a huge number of fakeouts that happen mid-candle.
- Confirm with Volume: A breakout on pathetic, anemic volume is suspicious. A real, powerful breakout should be driven by a significant spike in trading volume. That surge shows conviction from the sellers and confirms a genuine shift in control has taken place.
By combining a critical eye for pattern quality, an awareness of the bigger market picture, and the discipline to wait for clear confirmation, you can sidestep the most common traps. This approach turns the head and shoulders from just a shape on a chart into a truly high-probability trading tool.
Using Technology to Find Trading Opportunities
Manually flipping through hundreds of charts looking for a developing head and shoulders pattern is a surefire way to burn out. It's slow, tedious, and frankly, an outdated way to operate in modern markets. Today, technology does the heavy lifting, letting you focus your brainpower on analysis and execution instead of the mind-numbing search.
Think about it: automated tools can scan the entire market for you in seconds. Instead of reacting to patterns that have already played out, you get alerts about formations as they're happening. This gives you a massive edge and plenty of time to build a solid trade plan. It’s the bridge between knowing the theory and actually applying it in the fast-paced, real world of trading.
Setting Up a Market Scanner
This is where platforms like ChartsWatcher really shine. They are built specifically to help you create custom screens that actively hunt for specific criteria, including classic chart patterns. Setting up a scanner for the head and shoulders pattern isn't complicated, and it completely transforms your workflow.
Your goal is to tell the software exactly what you’re looking for. By defining a few key parameters, you can filter out all the market noise and zero in on the most promising opportunities.
Here’s a simple way to get your scanner configured:
- Select Your Universe: First, decide which markets to scan. Are you focused on the S&P 500? A specific sector like technology? Or maybe your personal watchlist of stocks and forex pairs?
- Define the Timeframe: Pick the timeframe that matches your trading style. A day trader might scan 5-minute and 15-minute charts, while a swing trader will stick to 4-hour and daily charts.
- Specify the Pattern: This is the heart of the scan. Just select "Head and Shoulders" (or "Inverse Head and Shoulders") from the list of technical criteria.
- Filter by Pattern Stage: This is a neat trick. Many advanced scanners let you specify the pattern's stage. You can get alerts when a pattern is just emerging, when it's fully formed but waiting for a breakout, or right after it has broken the neckline.
This kind of setup creates a highly personalized and efficient process. You can learn more about this workflow in our trader's guide to real-time stock scanning.
From Automated Alert to Actionable Trade
Once your scanner is up and running, it's like having your own personal market watchdog. When it spots a stock matching your criteria, you'll get an alert. But here’s the critical part: an alert is not a signal to blindly jump into a trade. It's a call to action—a nudge to open the chart and do your own homework.
Here's an example of what a modern scanner's user interface might look like.
The dashboard gives you a clean, organized view of potential setups, letting you move quickly from a notification to a deep dive on the chart itself.
When an alert for a head and shoulders pattern pops up, it's your job to vet it against everything we've discussed. Pull up the chart and ask the important questions:
- Is the structure clean? Does the head clearly stand above the shoulders?
- What's the volume story? Is it dying down on the right shoulder?
- Is there a big volume spike on the neckline break (if it's at that stage)?
- What's the bigger picture? Does this pattern make sense in the context of the higher timeframe trend?
By using technology to generate ideas and your own skill to validate them, you create a powerful, systematic approach. The scanner finds the haystack; you just have to find the needle.
For traders looking to get a technological edge, platforms that allow you to explore trading applications can be an incredible resource. Ultimately, folding automated scanning into your routine frees you from the drudgery of the search. It elevates your role from a pattern hunter to a strategic analyst, making smart decisions based on high-probability setups that the technology has already pre-screened for you.
Got Questions? Let's Talk Specifics
Even when you've got a handle on the head and shoulders pattern, things get a little fuzzy when you're staring at a live chart. Let's clear up some of the most common questions that pop up when traders start putting this pattern into practice.
Think of this as sharpening the saw. Getting these details right will help you sidestep common traps and build a much more reliable trading plan.
What's the Best Timeframe for This Pattern?
Here’s one of the coolest things about the head and shoulders pattern: it's fractal. That's just a fancy way of saying it shows up everywhere, from a frantic one-minute chart to a slow-moving monthly one. The "best" timeframe really just boils down to your own trading style.
- Day Traders: If you're in and out on the same day, you'll find plenty of action on the 5-minute, 15-minute, and 1-hour charts.
- Swing Traders: Holding positions for a few days or weeks? You'll want to live on the 4-hour, daily, and weekly charts.
A crucial rule of thumb is that the higher the timeframe, the more significant the pattern. A head and shoulders playing out on a daily chart is a much bigger deal than one on a 5-minute chart. It signals a potentially larger and longer-lasting move. Always make sure your chart's timeframe matches your intended holding period.
Does a Sloping Neckline Kill the Trade?
Not at all. In fact, it's pretty rare to find a perfectly horizontal neckline outside of a textbook. Real-world charts are messy, and the slope of the neckline actually gives you some extra clues about what's going on under the surface.
A slightly sloping neckline is completely fine and doesn't invalidate the pattern. An upward slope on a standard bearish pattern hints that there’s still some buying pressure lingering. This means you'll want to see a very decisive, high-volume break to feel confident in the sell-off.
On the other hand, a downward-sloping neckline is a sign of serious weakness. It often acts as a precursor to a faster, more aggressive drop once the price finally gives way. The method for setting your price target is exactly the same: just measure the distance from the top of the head straight down to where the price broke through the neckline.
How Does Volume Confirm an Inverse Pattern?
For the bullish inverse head and shoulders, volume is just as vital, but you're looking for a different story to unfold. It’s a tale of sellers getting completely exhausted and a new wave of confident buyers storming in.
Here’s the ideal volume sequence for a high-conviction inverse pattern:
- Left Shoulder: Volume is usually high here. Sellers are still in charge, pushing the price down to that first low.
- Head: As the price scrapes out its final bottom to form the head, you'll often see volume dry up. This is a classic sign that the sellers are running out of gas.
- Right Shoulder and Breakout: Volume might stay low while the right shoulder forms, but the breakout is the moment of truth. A real, powerful move above the neckline needs to happen on a big surge of volume.
That volume spike is your confirmation that buyers have taken control with authority. A breakout on weak, anemic volume is a huge red flag—it suggests the move doesn't have the fuel to follow through.
What Happens When a Head and Shoulders Pattern Fails?
When a pattern fails, it's not just a trade gone wrong—it's a powerful signal in its own right. A failed head and shoulders is when the price breaks the neckline, luring in traders, only to whip back aggressively in the other direction.
For a standard bearish pattern, this means the price drops below the neckline and then rockets back above it. This failure is incredibly meaningful. It tells you the bears made their move, tried to take control, and got steamrolled by a surprisingly strong group of buyers.
This is why many experienced traders specifically hunt for these failed patterns to trade in the opposite direction. A failed bearish breakdown is often a very potent bullish signal, suggesting the prior uptrend is about to resume with a vengeance. It’s also the perfect example of why a non-negotiable stop-loss (usually placed just above the right shoulder) is so critical. It protects you the moment the pattern's logic falls apart.
Ready to stop searching and start analyzing? ChartsWatcher provides a powerful, real-time market scanner that automatically finds head and shoulders patterns for you. Customize your dashboard, set precise alerts, and spend your time making smart trading decisions instead of manually hunting for setups. Take control of your workflow by visiting https://chartswatcher.com to see how it works.
