The Reverse Cup And Handle Pattern A Trader's Guide
The reverse cup and handle pattern is a classic bearish formation that often signals a coming drop in a stock's price, especially after a solid run-up. Just picture an upside-down teacup on your chart. The rounded top is the 'cup', and a small, upward bounce that follows creates the 'handle' right before the price tends to fall.
The Story Behind The Bearish Pattern
At its heart, the reverse cup and handle tells a story about a tug-of-war between buyers and sellers—one that the bears are poised to win. It's not just a random shape on a screen; every part of the pattern reflects a crucial shift in market psychology. Once you understand this narrative, the pattern stops being an abstract drawing and becomes a much more intuitive trading signal.
The story starts during a strong uptrend, with buyers confidently pushing the price to new highs. But that bullish energy starts to run out of steam. The price action begins to round off, forming the inverted 'cup', which is a visual sign that buying pressure is getting exhausted. This rounded top is a key detail—it shows a gradual handover of power, not a sudden, panicked sell-off.
From Bullish Hope To Bearish Control
After the cup is formed, a little bit of optimism returns to the market, creating the 'handle'. This brief rally is the last real attempt by buyers to get back in the driver's seat. But the handle is usually weak and fails to push the price up to its previous highs, which shows that the bullish conviction has all but disappeared. This failure is the final clue that sellers are about to take over.
The pattern is confirmed when the price breaks below the support level at the bottom of the handle. This breakdown is the climax of the story, confirming that sellers have finally overwhelmed the buyers. The whole formation is a perfect visual of a market changing its mind.
This pattern is so powerful because it visually captures the entire transition from bullish exhaustion to outright bearish dominance. The failure of the handle to make a new high is the most critical signal that the prior upward momentum has been decisively broken.
Let's quickly recap the essential characteristics that define this pattern.
Key Characteristics Of The Reverse Cup And Handle
This table breaks down the core components of the pattern, what they look like on a chart, and what they're telling you about the underlying market psychology.
| Component | What It Looks Like | What It Means |
|---|---|---|
| Prior Uptrend | A clear, established run-up in price. | The stage is set for a potential reversal. |
| Inverted Cup | A smooth, rounding top that looks like an upside-down 'U'. | Bullish momentum is fading; buyers are getting tired. |
| The Handle | A short, weak rally or consolidation period on the right side of the cup. | A last-gasp effort by bulls that lacks conviction. |
| Breakdown | The price falls decisively below the support level formed by the handle's low. | Sellers have taken full control; the bearish trend is confirmed. |
Understanding these pieces helps you move from simply seeing a shape to reading the market's story.
What Makes This Pattern So Important
Spotting a reverse cup and handle can give you a significant edge by providing an early warning that a strong uptrend might be over. It’s more than just a simple bearish signal; it’s a detailed play-by-play of market behavior that highlights:
- Buyer Exhaustion: The rounded cup is a clear picture of buying pressure slowing down and eventually stopping altogether.
- A Failed Rally: The handle’s weakness confirms the bulls have lost their strength and are no longer in control.
- A Clear Breakdown Point: It gives you a specific price level—the handle's support—that can act as a trigger for a potential short trade.
While this pattern is a reliable bearish indicator, it’s just as important to understand its bullish twin. To get the full picture, check out our guide on the classic cup and handle pattern. Mastering both will give you a much deeper understanding of how these powerful formations can signal major shifts in market sentiment, no matter which way the trend is heading.
How To Identify A High-Probability Setup
Spotting the basic U-shape of a reverse cup and handle is a good first step, but not every little bump on the chart is a real trading opportunity. To separate the high-probability setups from simple market noise, you have to dig deeper than the pattern's silhouette. Think of yourself as a detective; the shape is the initial clue, but the real evidence is in the context.
A solid pattern tells a clear story: the bulls are losing steam. The "cup" should be a smooth, rounding top—not a sharp, V-shaped spike. Why? A gradual, rounded top shows an orderly transfer of power from buyers to sellers. A sharp peak, on the other hand, is usually just a quick panic-sell, which is a totally different and far less predictable event.
The Anatomy Of A Strong Pattern
The handle is another crucial piece of the puzzle. This short upward bounce needs to look shallow and weak. Ideally, it should retrace less than one-third of the cup's depth. If the handle rallies too high, it's a warning sign that buyers still have plenty of fight left in them, which could kill the whole bearish setup. A small, drifting handle, however, confirms the bulls' last gasp was unconvincing. That sets the stage for a breakdown.
Next, zoom out and look at the bigger picture. The most powerful reverse cup and handle patterns form over longer timeframes. A pattern that takes several weeks or months to build on a daily or weekly chart is far more significant than one you see on a 5-minute chart. Longer durations filter out the short-term noise and signal a more fundamental shift in market sentiment.
This diagram breaks down the typical formation of a reverse cup and handle pattern.
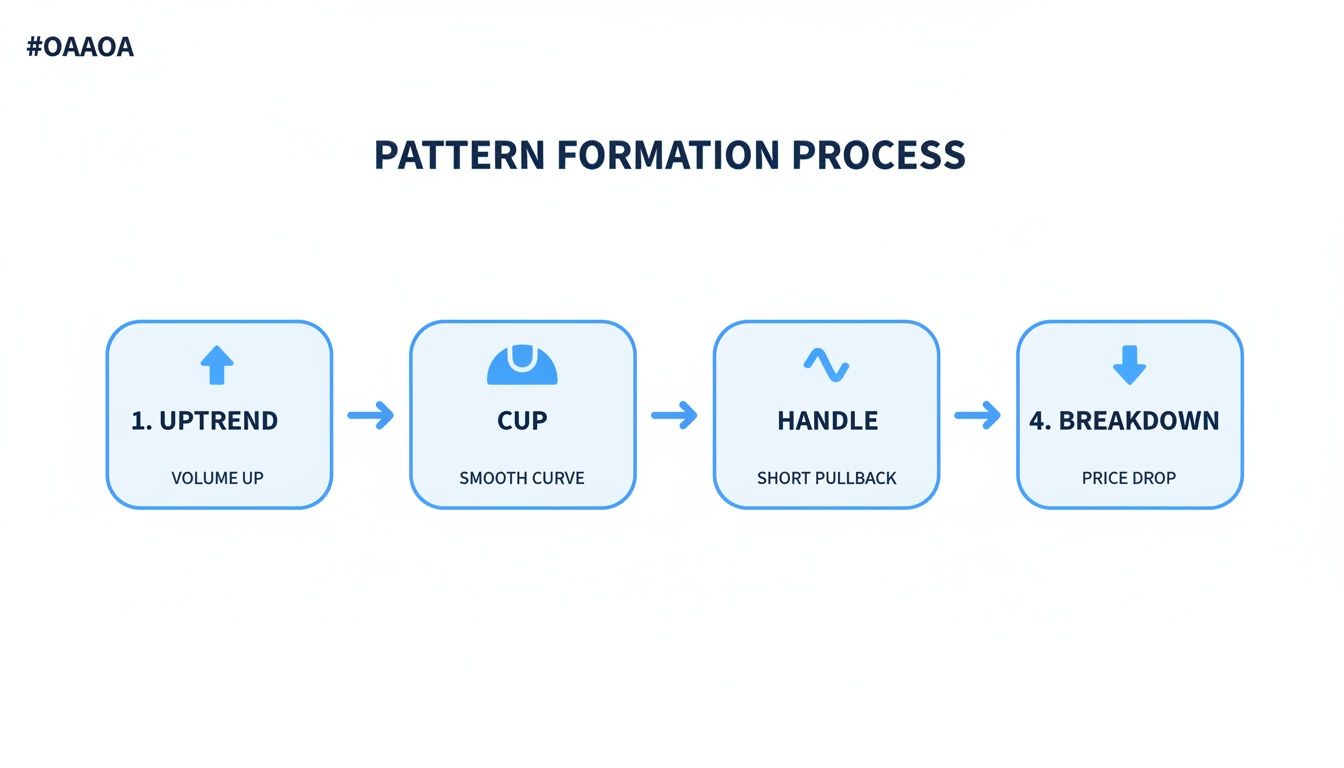
As you can see, the pattern visually captures the shift from a prior uptrend to a confirmed bearish breakdown.
Historical data backs up the importance of these details. While some studies have claimed success rates as high as 82% for this pattern in certain markets, its reliability isn't guaranteed. The true predictive power depends heavily on the timeframe and confirmation signals you use. Patterns on weekly charts are consistently more dependable than those on intraday charts because they represent a much bigger change in market psychology.
Your Most Important Confirmation Tool
Perhaps the single most important tool for validating a reverse cup and handle is trading volume. Volume is like a lie detector for the market; it reveals the conviction behind price moves. A genuine, high-probability setup has a distinct volume signature you absolutely must learn to read.
Here’s what the ideal volume profile looks like:
- During the Cup Formation: Volume should be moderate as the cup begins (the left side), then trail off as the price rounds the top and starts to fall. This drop in volume signals that the initial buying excitement is fizzling out.
- During the Handle Formation: Volume should stay low and light. This is your confirmation that the small bounce has no real buying power or market conviction behind it.
- At the Breakdown: As the price breaks below the handle's support level, there should be a dramatic, unmistakable spike in volume. This surge confirms that sellers have stormed the market with force, providing the momentum needed to push the price lower.
A breakdown without a big volume increase is a major red flag. It often means there isn't enough bearish conviction, raising the odds of a "false breakdown" where the price quickly snaps back up.
That volume spike is your final, critical piece of evidence. It validates the entire pattern and separates a weak signal from a strong one. For a deeper dive into interpreting volume across different market scenarios, check out our complete guide on trading with volume for modern market analysis. By combining the right shape, timeframe, and volume confirmation, you can dramatically improve your odds of catching a truly high-probability setup.
A Practical Strategy For Trading The Pattern

Spotting a reverse cup and handle is just the start. Actually trading it for a profit demands a clear, disciplined plan. Once you've confirmed the structure and the volume lines up, it's time to map out your entry, exit, and risk management with total precision. A good strategy pulls emotion and guesswork right out of the equation.
The prime moment to enter a short position is the breakdown. This is when the price closes decisively below the support line that formed at the handle's low. This move absolutely must come with a big spike in trading volume. That’s your confirmation that sellers have grabbed control with real conviction.
Jumping the gun is a classic mistake. You have to be patient and wait for the market to prove the pattern is valid before you put your capital on the line.
Pinpointing Your Profit Target
So, you’re in the trade. The next question is obvious: where do you cash out? The most common way to set a price target for a reverse cup and handle is the "measured move" method. It’s a simple but surprisingly effective way to project how far the price might fall.
Here’s how you calculate it:
- Measure the Cup's Depth: Find the vertical distance from the highest peak of the cup's rounded top down to the handle's support level.
- Project Downwards: Take that same distance and subtract it from the breakdown point where you entered the trade.
This projected level becomes your first profit target. For example, if a cup's depth is $15 and the breakdown happens at $180, your measured move target is $165. It's a logical approach because it works on the assumption that the bearish force will be roughly equal to the bullish exhaustion that created the pattern in the first place.
Protecting Your Capital With A Stop-Loss
Let’s be real: no pattern is foolproof. That makes risk management non-negotiable. A stop-loss is your safety net, automatically getting you out of the trade if things go south and the pattern fails. Without one, a single bad trade could do serious damage to your account.
For a reverse cup and handle, the most logical place for a stop-loss is just above the highest point of the handle. This placement makes perfect sense. If the price rallies back above that level, it’s a clear sign that the bearish momentum has fizzled out and buyers are back in charge. The pattern is officially broken, and you need to be out.
A well-placed stop-loss isn't just about cutting losses; it's about defining the exact point where your trading thesis is proven wrong. It forces you to stay objective and protects your capital for the next opportunity.
A solid trading plan is built on data and known thresholds. For instance, many traders see a handle that retraces less than 38.2% of the cup's depth as a much stronger signal of selling pressure. Likewise, a pattern that forms over at least 4–8 weeks on a weekly chart tends to be more reliable than one on an intraday chart. To dive deeper, you can explore a detailed breakdown of these technical thresholds and learn more about inverted cup and handle parameters on Defcofx.
Tying It All Together With Risk-To-Reward
The final check before you ever place a trade is to calculate your risk-to-reward ratio. This quick calculation tells you if the potential profit is actually worth the risk you're about to take.
To find it, just divide your potential profit (the distance from entry to your target) by your potential loss (the distance from entry to your stop-loss). Many pros won't even consider a trade unless the risk-to-reward ratio is at least 1:2 or 1:3. In other words, they need to be able to make at least two or three times the amount they are risking.
If the potential reward doesn't significantly outweigh the risk, pass on the trade. This discipline is what ensures your account can grow over the long run, even if you only win on half of your trades.
Real-World Chart Examples And Analysis
Theory is one thing, but seeing the reverse cup and handle pattern unfold in the wild is where it all clicks. By digging into actual charts, we can move from abstract rules to practical, real-time recognition. This is how you sharpen your eye and get a feel for spotting these setups as they develop.
Let's bring this pattern to life with some annotated examples from different markets. We’ll look at both picture-perfect patterns that led to major downturns and some cautionary tales of setups that fell flat. Each case study will highlight the key ingredients you've learned about: the prior uptrend, the rounded top, the weak handle, and that all-important volume surge on the breakdown.
A Textbook Stock Market Example
Picture a hot tech stock that’s been on a tear for months. Suddenly, the upward momentum starts to fizzle out, and the price action carves out a wide, rounding top over several weeks—that's our inverted cup. Volume, which was strong on the way up, begins to dry up as the top forms, signaling that buyers are getting tired.
After the cup, the stock tries to muster a small rally, forming a lazy, drifting handle. This bounce is weak, barely retracing a small fraction of the cup's depth. Crucially, volume remains exceptionally low. This lack of conviction from the bulls is a massive red flag.
Finally, the stock price cracks, breaking decisively below the handle's support line. At that exact moment, trading volume explodes, jumping to more than double its recent average. This is the confirmation traders have been waiting for. In the weeks that followed, the stock dropped by an amount roughly equal to the depth of the cup, hitting the measured move target like clockwork.
A Forex Case Study On A Major Pair
The reverse cup and handle isn't just a stock market phenomenon; it shows up all the time in forex. Take a major currency pair like EUR/USD on a daily chart. After a solid uptrend, the pair forms a classic inverted cup over a month-long period.
The handle that follows is a tight, narrow consolidation range lasting about a week. This coiling price action shows indecision but also a clear failure to get the prior uptrend going again. The breakdown happens when the price slices right through the handle’s lower boundary.
The key takeaway from looking at real charts is that confirmation is everything. A shape that looks like a reverse cup and handle without the right volume signature is just random noise, not a high-probability trade signal.
This breakdown gets its validation from a sharp spike in volume, signaling that sellers are now firmly in control. The pair then trends downward, with the initial price target—the measured move from the cup's depth—being hit within two weeks.
Understanding Failed Patterns
Of course, not every pattern plays out perfectly. It’s just as important to study the setups that fail so you know what to avoid. A common failure happens when the handle retraces too far into the cup, which tells you that buyers still have a lot of fight left in them.
Another reason for failure is a breakdown on weak volume. If there's no surge of sellers to back up the move, the price often snaps right back above the breakdown level, trapping short-sellers in a "false breakdown." These failed patterns drive home the importance of being patient and waiting for every single criterion to be met before you put capital at risk.
Market case studies show just how powerful a confirmed breakdown can be. When validated by a volume surge of 30–100%, stocks have shown declines of 10–35% from the breakdown point. In forex and commodities, these confirmed patterns have kicked off moves of several hundred pips. While failures will always be part of the game, the statistics show a clear edge for patterns that stick strictly to the rules. You can dive deeper into these post-breakdown market observations on HighStrike.
Knowing the textbook rules for trading the reverse cup and handle pattern is one thing. Actually avoiding the common traps that turn a perfect setup into a losing trade is another. It's just as important to know what not to do.
Even experienced traders get tripped up by these mistakes when discipline slips. Recognizing these pitfalls ahead of time is your best defense. It helps you build the right habits to trade with precision, protect your capital, and treat any mistakes as learning opportunities. Let's dig into the most common errors and how to sidestep them.
Jumping The Gun Before Confirmation
Patience pays in trading, but impatience costs. By far, the most frequent mistake is shorting the pattern too early—before the price has actually broken below the handle’s support level with conviction. Traders see the shape forming, get a jolt of FOMO (fear of missing out), and jump in before the market has proven them right.
This is a classic recipe for getting caught in a "false breakdown." The price might poke below the support line for a minute, tricking you into a short position, only to roar back up and stop you out.
- How to Avoid It: Simple. Wait for a candle to close below the handle's support line on your trading timeframe. A quick touch or a wick piercing the line means nothing. A close confirms that sellers were in control for that entire period and won the battle.
Ignoring The Volume Story
A reverse cup and handle without the right volume is just a meaningless shape on your chart. A breakdown that happens on weak, pathetic volume is a giant red flag. It tells you there's no real conviction from the sellers, which dramatically increases the odds that the move is a fake-out.
Ignoring volume is like trying to read a book by only looking at the pictures. You're missing half the story.
A breakdown that isn’t accompanied by a significant spike in volume—ideally at least 50% above the recent average—should be viewed with extreme suspicion. It’s often a bull trap in disguise, designed to suck in short-sellers before the price rips higher.
Seeing Patterns That Aren't Really There
When you're actively hunting for a particular setup, it's amazing how your brain can start seeing it everywhere. This is called confirmation bias, and it tricks traders into forcing a pattern onto a chart that doesn't fit the rules. They might mistake a sharp, V-shaped top for a "cup" or accept a handle that's way too deep and messy.
These sloppy, malformed patterns don't have the same psychological firepower as a textbook example, and they fail far more often.
- How to Avoid It: Be ruthlessly objective. Use a strict checklist. Does the cup have a smooth, rounded top? Is the handle a small, tight consolidation that retraces less than a third of the cup's depth? Is there a clear uptrend leading into the pattern? If you have to squint and talk yourself into it, it’s not an A+ setup. Just move on. Your discipline is what filters out the market noise and keeps you focused on the trades that truly give you an edge.
Putting the Reverse Cup and Handle in Your Trading Toolkit
Alright, let's move this pattern from the textbook to your actual trading screen. Knowing what a reverse cup and handle looks like is one thing; knowing how to trade it for real is something else entirely. Think of it less as a magic trick and more as a reliable tool that visually maps out a critical power shift in the market—from bullish exhaustion to the bears taking control. Its real power is in the clear, evidence-based roadmap it gives you for making decisions.
To get good, you have to nail the fundamentals. The pattern’s predictive punch comes from a few non-negotiable rules. Getting these down separates the high-probability setups from all the random market noise. Once you internalize these concepts, you can look at any potential trade with the clarity and confidence of a pro.
Your Final Pre-Trade Checklist
Treat this like a pilot's pre-flight checklist. Don't even think about entering a trade until every single one of these boxes is ticked.
- Spot the Right Formation: You absolutely need to see a clear uptrend first. This is followed by a smooth, rounded top—if it looks like a sharp "V," it's not the right pattern. The handle should be a pathetic little bounce, a weak attempt to rally that shows buyers have zero conviction left.
- Volume Is Your Confirmation Signal: This is crucial. Volume should die down as the cup forms and stay low during the handle's feeble bounce. The breakdown below the handle's support level must be accompanied by a massive spike in volume. No volume spike, no trade. It's that simple.
- Have a Plan Before You Enter: Never jump into a trade on a whim. You must know your exact entry point (the breakdown), your stop-loss (just a tick above the handle), and your profit target (calculated using the measured move) before you click the button.
The reverse cup and handle isn't just a shape on a chart; it's a story of market psychology playing out in real-time. The secret to trading it well is waiting for the final chapter—the confirmed breakdown—before you make your move.
Ultimately, getting proficient with this pattern comes down to good old-fashioned repetition and discipline. Start by pulling up historical charts and just spotting them. Train your eye. After that, move on to paper trading to practice your execution without putting real money on the line. Once you're comfortable, you'll have one more battle-tested tool in your arsenal, ready to go when the market gives you the right setup.
Frequently Asked Questions
When you start digging into a new chart pattern, a few common questions always pop up. Let's tackle some of the most frequent ones traders ask about the reverse cup and handle to make sure you're ready to use it with confidence.
What Is The Difference Between A Regular And A Reverse Cup And Handle Pattern
Think of them as polar opposites—mirror images signaling completely different market moves.
-
A regular cup and handle looks just like a teacup on the chart. It's a classic bullish continuation pattern. It tells you that after a breather, the price is probably getting ready to break out and keep climbing higher.
-
The reverse cup and handle pattern is its bearish twin, flipped completely upside down. This is a bearish reversal pattern, warning you that an uptrend is running out of gas and the price is likely headed for a downturn.
Which Timeframe Is Best For This Pattern
Generally, the longer the timeframe, the more reliable the pattern. A reverse cup and handle that forms over several weeks or months on a daily or weekly chart packs a much bigger punch than one you spot on a 5-minute chart.
Why? Because those longer-term patterns reflect a real, fundamental shift in market sentiment. They're far less likely to be thrown off by short-term market noise or random spikes, which means fewer false signals and a higher chance the pattern will play out as expected. While you can find them on any timeframe, the signal is much stronger on higher ones.
Can The Reverse Cup And Handle Pattern Fail
Oh, absolutely. It's crucial to remember that no chart pattern is a crystal ball, and this one is no exception. A failure happens when the price breaks below the handle's support line, luring in sellers, only to quickly reverse and shoot higher. This is what traders call a "false breakdown" or a classic "bear trap."
Failures don't just happen randomly; there's usually a reason. The number one culprit is a lack of volume on the breakdown. If there isn't a big surge of selling pressure to back up the move, it has no conviction and is likely to fizzle out.
Another common reason for failure is trying to fight a raging bull market. A powerful, market-wide uptrend can easily overwhelm a bearish pattern on a single stock, causing it to fail. This is precisely why a hard stop-loss is non-negotiable. It's your safety net that protects your capital when a setup just doesn't work out.
Ready to stop searching for patterns and start finding them? ChartsWatcher provides powerful, real-time scanning and backtesting tools designed to help you spot high-probability setups like the reverse cup and handle pattern across the market. Build custom screeners, set precise alerts, and validate your strategies with historical data. Take control of your trading and start your free trial at ChartsWatcher today.
