Stock Oversold Meaning: What Every Trader Should Know
When traders talk about a stock being oversold, they’re describing a specific kind of market exhaustion. It’s a situation where a stock has been beaten down by relentless selling, often falling much faster and further than its actual business fundamentals would justify.
Think of it like a rubber band being stretched to its absolute limit. The intense selling pressure can't last forever, and at some point, the tension becomes so great that a snapback is more likely than not.
What an Oversold Stock Really Is
Let's use a real-world example. Imagine a popular new gadget is released, but a rumor spreads that a key component is faulty. Panicked owners rush to sell theirs online, flooding the market and crashing the price. Soon, the gadget is selling for far less than it's actually worth. That's essentially what happens to an oversold stock.
Persistent selling pressure pushes the price down to a point that, according to technical indicators, just isn't sustainable. This selling frenzy is often kicked off by a few common catalysts:
- Negative News: A disappointing earnings report or bad industry news can trigger a wave of selling.
- Broader Market Downturns: When the entire market is in a slump, even fundamentally solid companies get dragged down with it.
- Panic Selling: Fear is a powerful motivator. Sometimes, investors sell irrationally, which only exaggerates the price drop.
This infographic is a great way to visualize the core idea of an oversold stock being stretched to its breaking point.
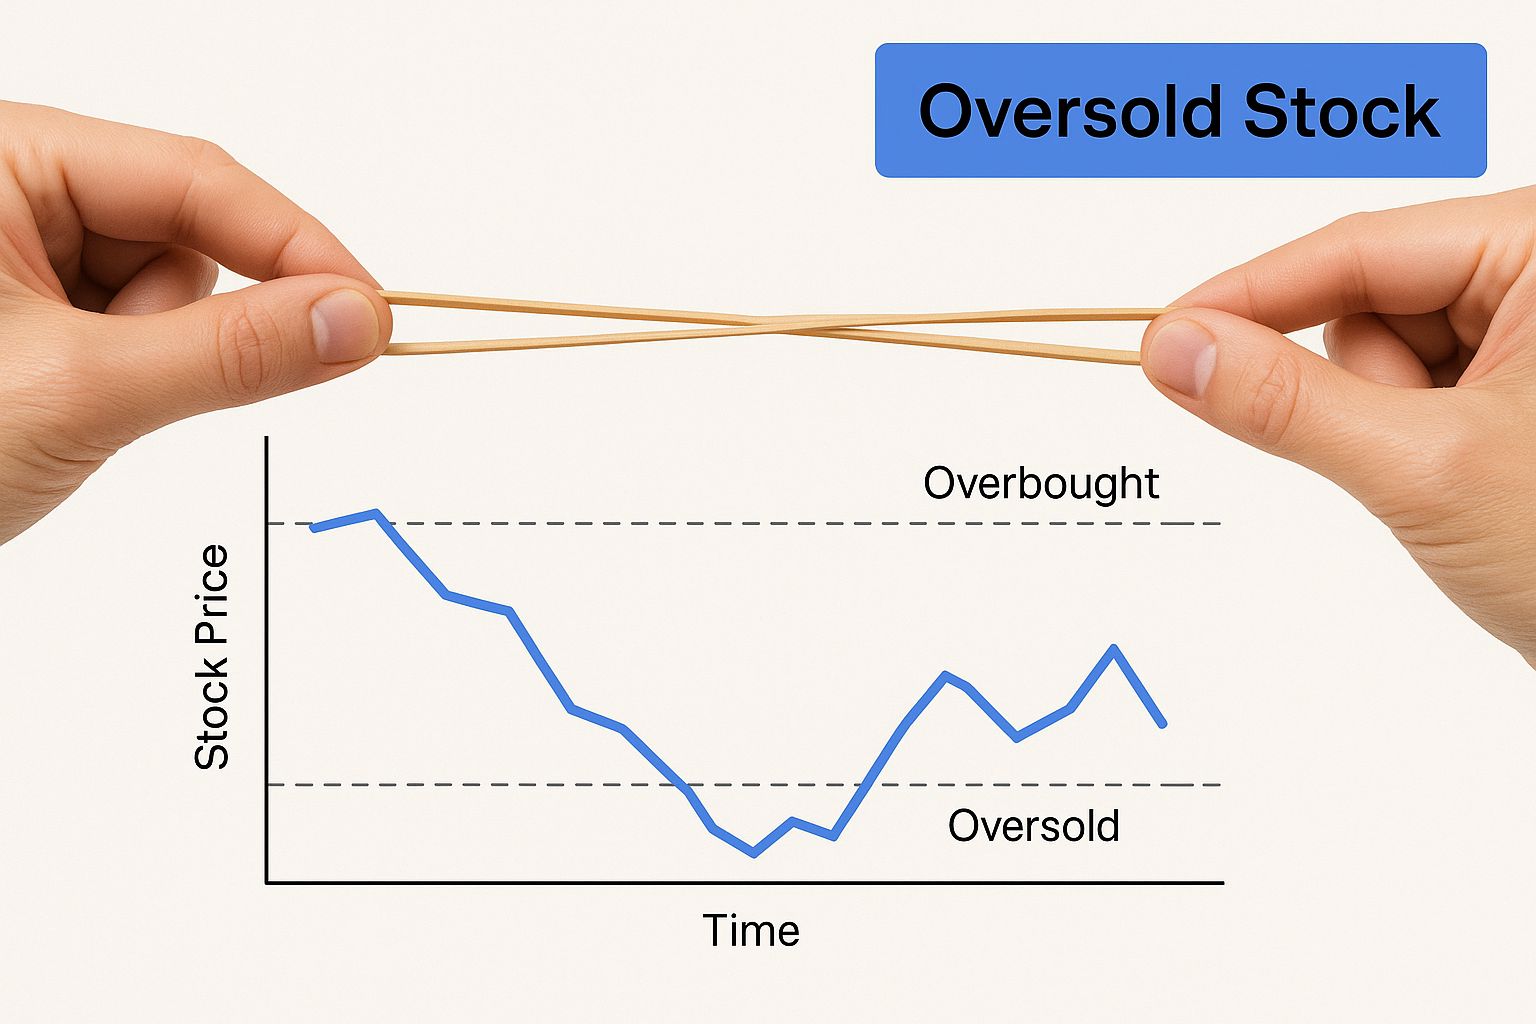
The image of that taut rubber band perfectly captures the idea that the downward momentum might be running out of steam.
But here’s the critical takeaway: "oversold" doesn't automatically mean a stock is cheap or a guaranteed buy. It’s a flag—a signal that the selling has become extreme and a price reversal, or at least a temporary bounce, is statistically more likely. Experienced traders see it as a cue to start paying very close attention, not a blind order to jump in. It's simply an alert that the sellers might finally be exhausted.
Using the RSI Indicator to Spot Reversal Potential
To hunt for oversold stocks, many traders turn to one of the most trusted tools in their arsenal: the Relative Strength Index (RSI). You can think of the RSI as a momentum gauge for a stock, running on a simple 0 to 100 scale. It crunches the numbers on recent price changes—both speed and size—to figure out if a stock is getting a little too hot or a little too cold.
When the RSI value dips below 30, it’s a strong signal that the stock has wandered into oversold territory. This reading suggests that the sellers have been in control for a while, and the downward push might be running out of gas. This is precisely where many new traders get tripped up.
An RSI reading below 30 is not a blind "buy" signal. It's a flashing yellow light, not a green one. A stock can stay oversold for a long time, especially during a powerful downtrend.
Experienced traders know better than to jump the gun. They wait for confirmation—specific signs that a reversal is actually starting to take shape, rather than just hoping one will happen.
How to Validate an Oversold RSI Signal
Instead of buying the second the RSI dips below 30, you’ll want to look for stronger validation signals to stack the odds in your favor. Here are the two big ones:
-
The RSI Crossover: Wait for the RSI line to climb back above the 30 level. This is a much clearer sign that buying pressure is kicking back in and momentum is potentially shifting from bearish to bullish. It’s the market’s way of saying, "Okay, the buyers are showing up again."
-
Bullish Divergence: This is a more subtle but powerful pattern. It happens when the stock’s price makes a new low, but the RSI makes a higher low. This disagreement between price and momentum often hints that the selling pressure is fading, even as the price ticks lower, and can often precede a significant reversal. To get a handle on these patterns, check out our guide on mastering the RSI trading strategy.
The data backs this up. A backtest on the S&P 500 going all the way back to 1985 found that buying when the 3-day RSI dropped into an extremely oversold state (below 20) resulted in a 75% win rate over 448 trades. This really drives home the practical stock oversold meaning in a data-driven way. You can dig into more of this kind of historical market data over at Quantified Strategies.
Confirming Signals with the Stochastic Oscillator
So, you've spotted an oversold signal with the RSI. That's a great start, but in trading, you never want to rely on just one piece of evidence. What if you could get a second opinion before pulling the trigger?
This is where the Stochastic Oscillator comes in. It’s another powerhouse indicator, but it looks at the market from a slightly different angle. While the RSI is fantastic at measuring the speed of price drops, the Stochastic Oscillator tells you where the current price is relative to its recent trading range.
Think of it this way: RSI is the speedometer, showing how fast the stock is falling. Stochastics is the altimeter, showing just how close to the ground it is compared to its recent flight path. It compares a stock's closing price to its high-low range, making it exceptionally good at spotting potential turning points.
Just like the RSI, the Stochastic Oscillator is plotted on a simple 0 to 100 scale. The magic number here is 20. When the indicator line dips below 20, it’s a clear flag that the stock is in oversold territory. This tells us the price is scraping the absolute bottom of its recent range and might be coiled for a bounce.
Combining Indicators for Stronger Signals
Here’s where a good strategy becomes a great one. Relying on a single signal is like making a big decision based on one person's advice—it's risky. The smartest traders look for confluence, where multiple, independent indicators are all telling the same story.
When you see the RSI drop below 30 and the Stochastic Oscillator fall below 20 around the same time, the probability of a genuine reversal shoots up. This "double confirmation" gives you a much stronger and more reliable foundation for a trade.
A dual signal from both RSI and Stochastics suggests a stock isn't just losing downward momentum (RSI) but is also trading at an extreme low of its recent price range (Stochastics). This powerful alignment strengthens the case that selling pressure is truly exhausted.
This isn't just theory. Studies across major exchanges have shown that when traders use this dual-signal approach, the probability of a successful reversal trade often increases. Historically, stocks flagged as oversold by both indicators tend to rebound, on average, by 3-5% within the next few trading sessions, though market conditions always play a decisive role. If you want to dive deeper, you can find more details about how these indicators compare in different market types.
Ultimately, using these tools together helps you filter out the noise and the weak signals. It gives you a much clearer picture of what stock oversold meaning looks like in a practical, actionable way.
Beyond the Basics: Finding Strength in Numbers
Trying to trade off a single indicator is like trying to navigate a city with just one landmark—sure, it's a starting point, but you’re still likely to get lost. The real magic in technical analysis happens with confluence, that powerful moment when several independent signals all point in the same direction. This is where we stop chasing simple alerts and start building high-probability trade setups.
A fantastic partner for a momentum tool like the RSI is Bollinger Bands. Think of these bands as a volatility channel, mapping out the upper and lower edges of a stock’s normal price behavior. When a stock's price actually touches that lower Bollinger Band, it’s a clear sign that it has stretched to an extreme—and potentially unsustainable—low.
The Power of Double Confirmation
Now, let's put these two tools together. Imagine a stock not only drops to an RSI below 30 but, at the very same time, its price smacks right into the lower Bollinger Band. This "double confirmation" is a signal that demands your attention.
It’s telling you two critical things at once:
- The stock's downward momentum is tapped out (that's the RSI talking).
- The stock's price has pushed to the absolute fringe of its normal volatility (that's the Bollinger Band's job).
Getting this dual signal suggests a much higher chance of a reversal than either indicator could ever give you on its own. In fact, studies on major indices have shown that these 'double oversold' scenarios led to positive returns over 65% of the time within the next five trading days. The average gains weren't trivial either, often falling between 1.2% and 2.8%. You can dig into more of these statistical findings on MarketBeat.
Why Market Context Is Everything
But even with the strongest confluence of signals, there's one final ingredient that can make or break your trade: context. Understanding the broader market trend is what separates consistently successful traders from beginners who get burned.
An oversold signal in a healthy, roaring uptrend is often a beautiful buying opportunity—a temporary dip before the next climb. But in a brutal, grinding downtrend, that very same signal is more likely a dangerous trap that leads to even more losses.
Before you ever act on an oversold signal, always zoom out and look at the bigger picture. Is this stock in a long-term uptrend or is it bleeding out in a downtrend? Answering that one question first will save you from a world of costly mistakes and ensure you’re trading with the market's current, not against it.
How to Find Oversold Stocks with ChartsWatcher
Knowing what an "oversold" indicator means is one thing. Actually finding those stocks among the thousands out there? That's a completely different ballgame.
This is where theory hits the road. You could spend all day flipping through charts, hoping to stumble upon a good setup. Or, you can use a powerful tool to bring the opportunities directly to you. With ChartsWatcher, you can build a custom screener that does all the heavy lifting, turning abstract concepts into a concrete list of potential trades in just a few minutes.
Building Your Custom Oversold Screener
Instead of manually hunting for setups, you can set up a few simple filters to scan the entire market for stocks hitting your exact criteria. This bridges the gap between understanding the stock oversold meaning and actually using it to trade.
The process is incredibly straightforward. By combining the indicators we’ve already talked about, you can create a highly targeted list of stocks that might be primed for a bounce.
Here’s a quick step-by-step guide to get you started:
- Set the RSI Filter: Your first rule is the classic. Target stocks with an RSI reading below the 30 threshold. This instantly cuts through the noise and shows you only the securities that have seen significant selling pressure.
- Add the Stochastics Filter: For an extra layer of confirmation, add a second condition for the Stochastic Oscillator to be below 20. This helps ensure you’re looking at stocks that are both oversold on momentum and scraping the bottom of their recent price range.
- Refine with Liquidity: Finally, add a filter for minimum average daily volume. Setting it to something like 500,000 shares a day makes sure you're only looking at liquid stocks that are easy to get in and out of.
Using a screener completely changes your workflow. You go from being reactive—hunting through chart after chart—to being proactive. You define the setup you want to see, and the tool delivers a curated list of opportunities right to your screen.
You can learn more about crafting these kinds of targeted scans by exploring the ChartsWatcher stock scanner and all its filtering options. It's the best way to find potential trades that line up perfectly with your strategy.
Common Questions About Oversold Stocks
When you're putting real money on the line, questions are bound to pop up. That's a good thing. Getting clear, straightforward answers about oversold conditions helps you build the confidence to read market signals correctly and act decisively.
Let's tackle some of the most common questions traders have.
How Reliable Are Oversold Signals?
Think of an oversold signal less like a crystal ball and more like a probability enhancer. A single indicator dipping into oversold territory, on its own, is not a guarantee of a reversal. A stock can stay oversold for a surprisingly long time, especially when a strong, news-driven downtrend has taken hold.
But their reliability shoots up with confluence.
When multiple, independent signals all start flashing at once—say, the RSI and Stochastics are both oversold, and the price just tagged the lower Bollinger Band—the probability of a bounce gets much, much higher. It’s like building a legal case: you're looking for multiple pieces of evidence, not just the word of a single witness.
The key is to see oversold signals as alerts to start looking for a trade, not as infallible commands to buy. Reliability comes from combining indicators with a solid read on the overall market context.
Can You Trust Oversold Signals in a Bear Market?
This is a critical question, and the short answer is: with extreme caution. In a fierce bear market, momentum can drag stocks far lower than anyone thinks possible. What looks like an oversold "dip" can easily just be the next step down in a long staircase of losses.
During these periods, oversold readings often just signal a brief pause or a tiny bounce before the downtrend kicks back in. A stock can go from "oversold" to "even more oversold." Trying to "catch a falling knife" based solely on an oversold signal is one of the riskiest plays in the book.
For this reason, many traders will only use oversold signals to hunt for buys when the broader market is trending sideways or up.
What Is the Biggest Mistake Traders Make?
The single biggest mistake is acting on an oversold signal without waiting for confirmation. It's the classic rookie move. A beginner sees the RSI dip below 30 and immediately mashes the buy button, thinking they’ve nailed the bottom.
An experienced trader sees that same signal and starts watching like a hawk, waiting for proof that buyers are actually stepping back in.
What does that proof look like?
- The RSI climbing back above the 30 level.
- A clear bullish divergence pattern forming.
- A classic bullish candlestick pattern, like a hammer or a bullish engulfing candle.
Jumping the gun without this evidence is a recipe for buying into a stock that still has plenty of room to fall. Patience isn't just a virtue in trading; it’s a core part of a profitable strategy.
Ready to stop hunting and start finding high-probability trade setups? ChartsWatcher provides the powerful, real-time scanning tools you need to build custom screens for oversold stocks, letting you apply these concepts with speed and precision. Start finding your next trade with ChartsWatcher today.
