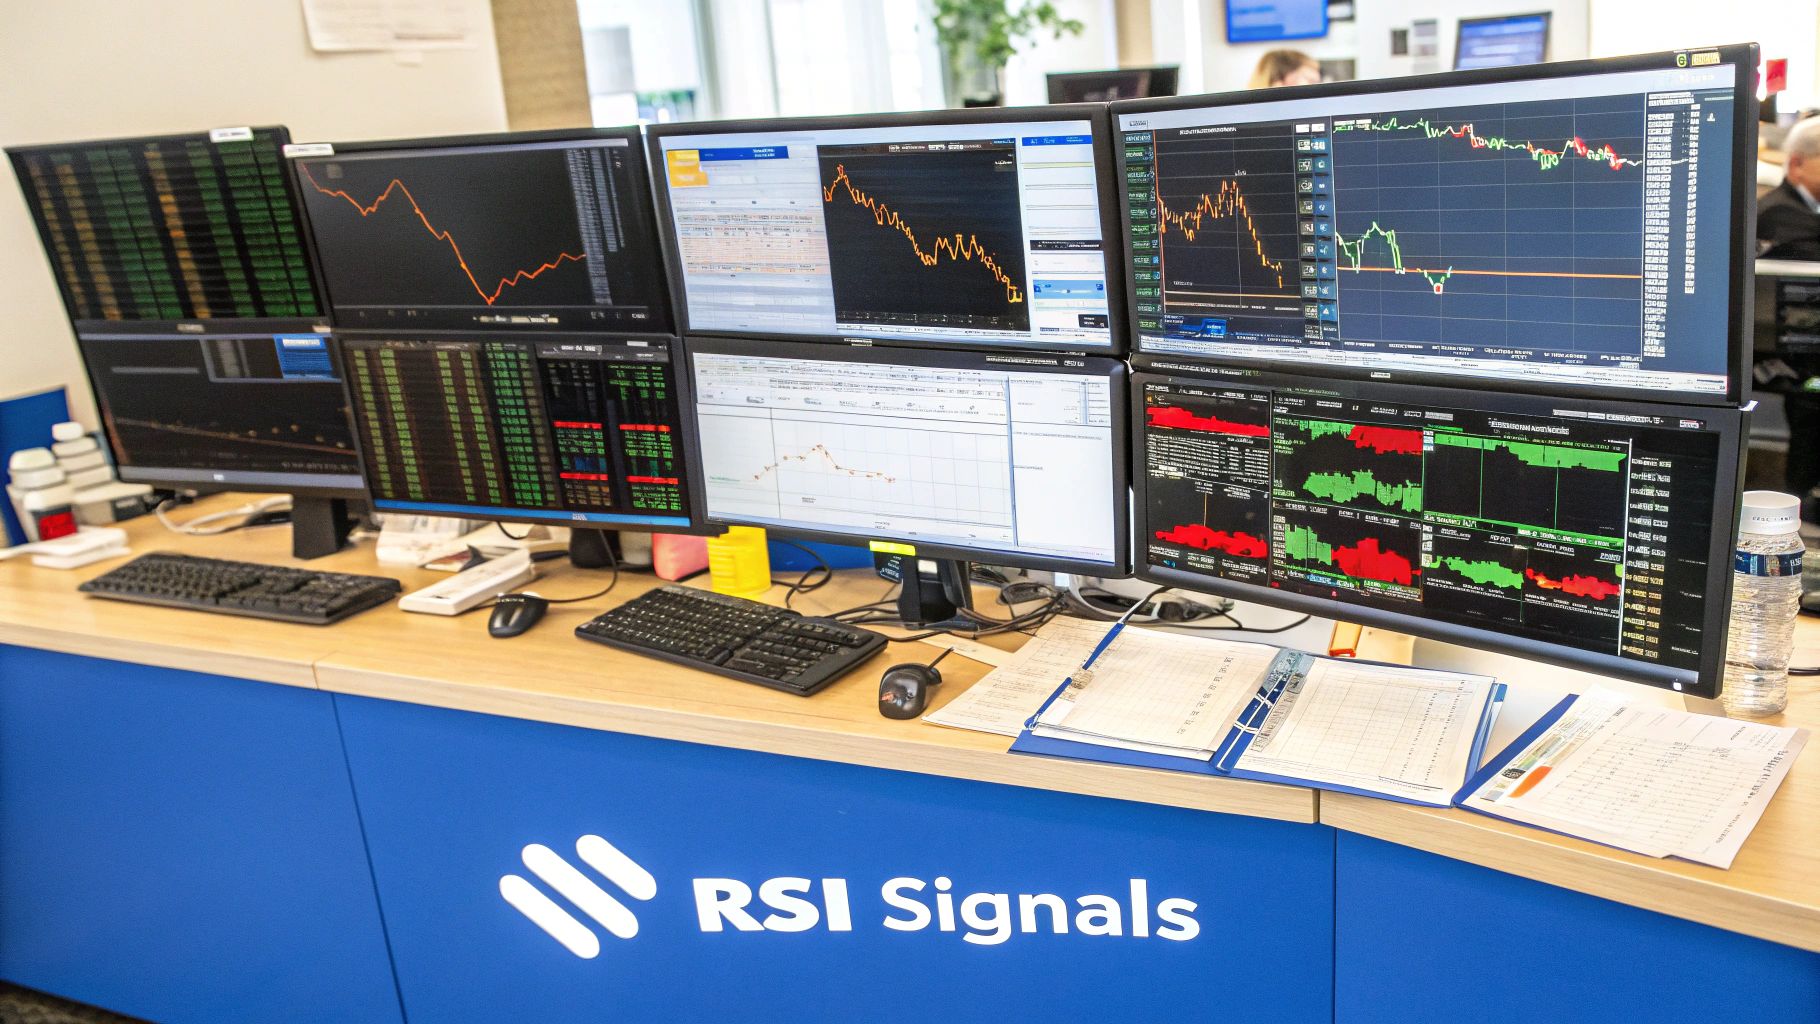
Master the RSI Trading Strategy for Profitable Trades
Understanding RSI Beyond the Textbook Definition
Most trading courses hammer home the 30 and 70 levels for the Relative Strength Index (RSI). Below 30? Oversold. Above 70? Overbought. Simple, right? Wrong. In my experience, relying solely on these numbers in today's market is a quick way to lose money. I've connected with plenty of full-time traders using RSI, and not a single one sticks rigidly to those textbook definitions.
So, what's the secret sauce? Understanding market psychology. An asset can remain "overbought" for a long time during a strong uptrend simply because buyers are more aggressive. The opposite is also true: fear can keep an asset "oversold" much longer than you might expect.
The Relative Strength Index (RSI) is a popular momentum indicator used to spot potential overbought and oversold conditions. It measures price changes on a scale of 1 to 100, typically over a 14-day period. An RSI above 70 suggests an asset might be overbought, hinting at a selling opportunity. Conversely, below 30 might indicate an oversold situation, potentially a buying opportunity. Want to learn more about RSI trading strategies? Check out this resource: https://www.quantifiedstrategies.com/rsi-trading-strategy/
Here's another key point: every asset dances to its own tune. A volatile stock might swing between RSI levels of 20 and 80 regularly, while a stable blue-chip might barely stray outside the 40-60 range. Using the same RSI rules for all assets is like using a hammer to tighten a screw. It’s not the right tool for the job. In ChartsWatcher, you can easily compare how RSI behaves across different assets in your watchlist and adjust your strategy accordingly.
Beyond Overbought and Oversold: Looking at RSI Trends
Forget fixating on those static levels. Experienced traders focus on RSI trends and divergences. They look for clues like the RSI forming higher lows while the price forms lower lows – a classic bullish divergence, often foreshadowing a reversal. They also watch how the RSI interacts with support and resistance levels. Just like price action, RSI often finds support and resistance around key levels, providing valuable confirmation signals.
The Power of Context
Context is everything. An RSI of 68 might signal a pullback in a ranging market but be perfectly normal in a strong uptrend. Pros use ChartsWatcher’s charting tools to analyze RSI within the bigger picture, factoring in things like volume, trendlines, and overall market sentiment. This helps them filter out noise and pinpoint the best trading opportunities.
Let's talk about interpreting those RSI signals. Here’s a handy guide I put together:
RSI Signal Interpretation Guide A comprehensive breakdown of RSI levels and their trading implications across different market conditions.
| RSI Level | Market Condition | Typical Action | Risk Level | Best Market Type |
|---|---|---|---|---|
| Below 30 | Oversold | Consider Buying | Medium | Downtrend/Ranging |
| 30-40 | Approaching Oversold | Watch for Divergences | Low/Medium | Downtrend/Ranging |
| 40-60 | Neutral/Consolidation | Look for Breakouts | Low | Any |
| 60-70 | Approaching Overbought | Watch for Divergences | Low/Medium | Uptrend/Ranging |
| Above 70 | Overbought | Consider Selling | Medium | Uptrend/Ranging |
This table gives you a general idea of how to interpret RSI levels. Remember, though, that these are just guidelines. The best action always depends on the specific market context.
By moving past the simple overbought/oversold idea, you'll unlock the real potential of RSI and significantly improve your trading game in ChartsWatcher.
Fine-Tuning Your RSI Settings for Maximum Impact
Forget what you’ve heard about the default 14-period RSI. It’s a starting point, not a commandment. Anyone consistently profiting with RSI knows that customization is key. It's like tuning a guitar – you adjust it for the perfect sound.
Adapting to Market Conditions
First thing’s first: market volatility. In a choppy market, a shorter RSI period (like 2-6) can be incredibly effective. It reacts faster to those quick price swings, giving you signals quicker. But, shorter periods can also give you more false signals in calmer markets. That's where ChartsWatcher’s backtesting becomes invaluable. Test different historical scenarios—find what truly works.
For example, picture the tech boom of the late 90s. A shorter-period RSI would have been excellent for snatching profits. Contrast that with the more stable bond market of the early 2000s – a longer period might have been the better play. Even the asset class you're trading impacts your ideal settings. A volatile penny stock needs a different RSI approach than a steady blue-chip. The RSI is especially good for stocks, and you can optimize it even more by adjusting the timeframe or pairing it with other indicators. A study actually showed that using shorter RSI timeframes (between 2 and 6 days) can boost your win rate and reduce drawdowns for short-term strategies. Check out more on RSI optimization here: https://www.quantifiedstrategies.com/rsi-trading-strategy/
Timeframe Considerations
Your trading timeframe also matters. Day traders on ChartsWatcher often lean towards shorter periods, while swing or long-term investors might use longer ones (like 21 or 28). Personally, I’ve had success swing trading certain indices with a 9-period RSI. But experiment in ChartsWatcher – find your sweet spot.
Avoiding Over-Optimization
One of the biggest traps with RSI (or any technical analysis, really) is over-optimization. You tweak and tweak until your backtests look perfect, but then it flops in live trading. It's like memorizing test answers without understanding the material. Sure, you might ace the practice test, but the real deal? Not so much. Keep it simple, focus on the why behind your settings.
Systematic Testing in ChartsWatcher
ChartsWatcher is perfect for systematic testing. Use its backtesting tools to check your RSI strategy in various periods and conditions. Start with a 14-period RSI as your baseline. Adjust from there, meticulously documenting your results. This testing and documentation process will teach you valuable lessons about how RSI behaves with different assets and markets. Ultimately, it'll help you build a stronger, more profitable RSI strategy.
Remember, the goal isn't to create a strategy that flawlessly replicates past performance. You want something consistent for the future. This takes a balance of optimization and a real-world understanding of the market. Don't get caught chasing the "perfect" backtest. Use ChartsWatcher to develop a well-rounded, adaptable RSI strategy that can handle whatever the market throws at it.
Building Powerful RSI Combinations That Actually Work
Relying on RSI alone is like trying to bake a cake with only flour. Sure, it's an ingredient, but you need more to create something truly delicious. The real magic of the RSI indicator happens when you combine it with other indicators and techniques in ChartsWatcher. This helps you confirm signals and filter out the noise, leading to better trades. Speaking of RSI, you might find this interesting: Master RSI In Stocks: Top Strategies Revealed
RSI and Moving Averages: A Dynamic Duo
One of my favorite RSI combos is pairing it with moving averages. Think of moving averages as smoothing out the choppy price action, giving you a clearer picture of the underlying trend. Using a simple moving average (SMA) or an exponential moving average (EMA) can be really helpful in confirming RSI signals. For example, imagine the RSI is above 70 (overbought) and the price is also above a key moving average. This might be a good shorting opportunity. On the flip side, an RSI below 30 (oversold) and a price below a moving average could be a great time to buy.
Adding Volume to the Equation
Volume is like the secret sauce in your trading recipe. It adds another layer of insight to your RSI strategy. High volume combined with an RSI breakout above 70 can confirm a strong uptrend. Conversely, high volume during an RSI dip below 30 often indicates a strong buying opportunity. ChartsWatcher lets you see both RSI and volume at the same time, which helps you get a complete picture of market momentum. This is particularly useful for spotting those pesky false breakouts where the RSI might go above 70, but low volume suggests a lack of real buying power.
Multiple Timeframes: Zooming In and Out
Many pros use RSI across multiple timeframes. I often use a longer timeframe, like the daily chart, to identify the overall trend, and a shorter timeframe, like the hourly chart, for my entry and exit points. This helps with timing. For instance, you might see an uptrend on the daily chart with an RSI above 50. Then, on the hourly chart, you'd look for buys when the RSI dips below 30 and then recovers, all while staying in line with the bigger trend.
Support and Resistance: Precision Entries and Exits
Combining RSI with support and resistance levels can help you fine-tune your entry and exit points. Imagine the RSI bouncing off a support level while oversold. That could be a high-probability buy. Or picture the RSI getting rejected from a resistance level while overbought. That's a pretty good sell signal. ChartsWatcher's drawing tools let you mark these levels right on your charts, making it easy to visualize these powerful combinations. You can enhance RSI effectiveness by using it with other indicators or price action analysis, helping to filter false signals and making trade decisions more reliable. Discover more insights on enhancing RSI Strategies.
Avoiding Conflicting Signals: The Art of Indicator Harmony
While combining indicators is powerful, be careful not to use indicators that clash. Using RSI with another momentum oscillator like the Stochastic RSI might create confusion, as they both measure similar things. The trick is to choose indicators that complement each other, offering different perspectives that confirm, rather than contradict. Play around with various combinations in ChartsWatcher’s backtesting environment to discover what suits your style and the market you’re trading in. Building a solid trading strategy is about a few indicators working well together, not a ton of them fighting each other.
Let's talk about some popular RSI pairings. The table below shows some effective indicator combinations, their strengths, and the best market conditions for using them.
Here's a look at some effective RSI indicator combinations:
Effective RSI Indicator Combinations: Popular indicator combinations with RSI, their strengths, and optimal market conditions for each pairing.
| Indicator Pair | Strategy Type | Best Timeframe | Win Rate Improvement | Market Condition |
|---|---|---|---|---|
| RSI + SMA | Trend Following | Daily | 10-15% | Trending Markets |
| RSI + MACD | Momentum | Hourly | 5-10% | Volatile Markets |
| RSI + Volume | Breakout Confirmation | 15-minute | 15-20% | High Volatility Breakouts |
| RSI + Support/Resistance | Range Trading | Hourly | 10-15% | Consolidating Markets |
These are just a few examples, and the "Win Rate Improvement" is an estimated range based on my experience. Your results may vary, so always backtest thoroughly!
Mastering RSI Entry and Exit Timing
Timing is everything with the RSI, and it's where so many traders get tripped up. We're going to move past the basic overbought and oversold ideas and dive into how the pros actually use RSI in real market conditions. Let's get practical.
Spotting Reversals With RSI Divergence
RSI divergence is your secret weapon for spotting reversals that have a high probability of playing out. It happens when the price action and the RSI are telling different stories – they're moving in opposite directions. A bullish divergence forms when the price makes lower lows, but the RSI is making higher lows. This tells you selling pressure might be fading, and a reversal to the upside could be coming. A bearish divergence, on the other hand, happens when the price makes higher highs, but the RSI is making lower highs. This shows weakening buying pressure and a potential drop.
This TradingView screenshot is a perfect example of a bearish divergence. See how the price is making higher highs, but the RSI is making lower highs? This divergence predicted a pretty big price drop—it’s a powerful signal.
Beyond Overbought and Oversold: Combining RSI with Price Action
Everyone talks about the 30 and 70 levels with RSI, but those numbers don't tell the whole story. An asset can stay "overbought" for a long time during a strong uptrend. Likewise, fear can keep an asset "oversold" much longer than you'd expect. The real trick is to combine RSI readings with price action analysis.
For example, let's say the RSI is above 70, but the price starts forming a bearish candlestick pattern, like a shooting star or an evening star. That might be your chance to short. On the flip side, an RSI below 30 with a bullish engulfing pattern could be a solid buy signal. ChartsWatcher’s charting tools let you see these combinations clearly, which is essential for making informed decisions.
Precise Entry Timing With ChartsWatcher
ChartsWatcher lets you time your entries precisely by combining RSI with other indicators. Using moving averages with RSI can help confirm trends and weed out false signals. Imagine the RSI crossing above 30 from oversold territory while the price breaks above a key moving average. That combination of signals makes the trade setup much stronger.
Mastering Exit Strategies: Maximizing Profits and Minimizing Losses
Your exit strategy is just as important as your entry. You can set profit targets based on previous support and resistance levels. For a long trade based on a bullish RSI divergence, you might set your profit target at the previous swing high. Trailing stop-loss orders are another great tool. These automatically adjust your stop-loss as the price moves in your favor, locking in profits and protecting you against sudden reversals. ChartsWatcher lets you put these exit strategies into action, so you can adapt to different market conditions.
Position Sizing Based on RSI Signal Strength
Pro traders adjust their position size based on how strong the RSI signal looks. A strong divergence or a breakout from extreme overbought/oversold levels might mean a larger position size than a weaker signal. For example, a bullish divergence, high volume, and a breakout above a key resistance level would probably justify a bigger investment. This dynamic approach to position sizing lets you make the most of high-probability setups while managing risk.
Holding vs. Taking Quick Profits: The RSI Perspective
The RSI can even give you clues about whether to hold a position or take profits quickly. In a strong trending market, the RSI can stay in overbought or oversold territory for a while. If the RSI keeps looking strong and the overall trend is still intact, holding might be the play. But, if the RSI starts to weaken or you see divergence, taking profits might be smarter.
By mastering these RSI techniques, you can really boost your trading results and feel more confident in the market. Remember, consistent profitability is all about combining technical analysis, risk management, and disciplined execution. ChartsWatcher gives you the tools and insights you need to reach your trading goals.
Testing Your RSI Strategy with Real Data
Hope isn't a strategy on Wall Street—cold, hard data is. Before you even think about risking your hard-earned cash, you absolutely need to understand how your RSI strategy would've performed in the past. That means rigorous backtesting, and thankfully, ChartsWatcher makes that whole process a lot smoother. Let's dive into how to backtest effectively, interpret the results, and refine your approach without falling into the over-optimization trap.
Think of it like this: you check the RSI levels, set your stop-loss and take-profit orders, and then figure out your position size. 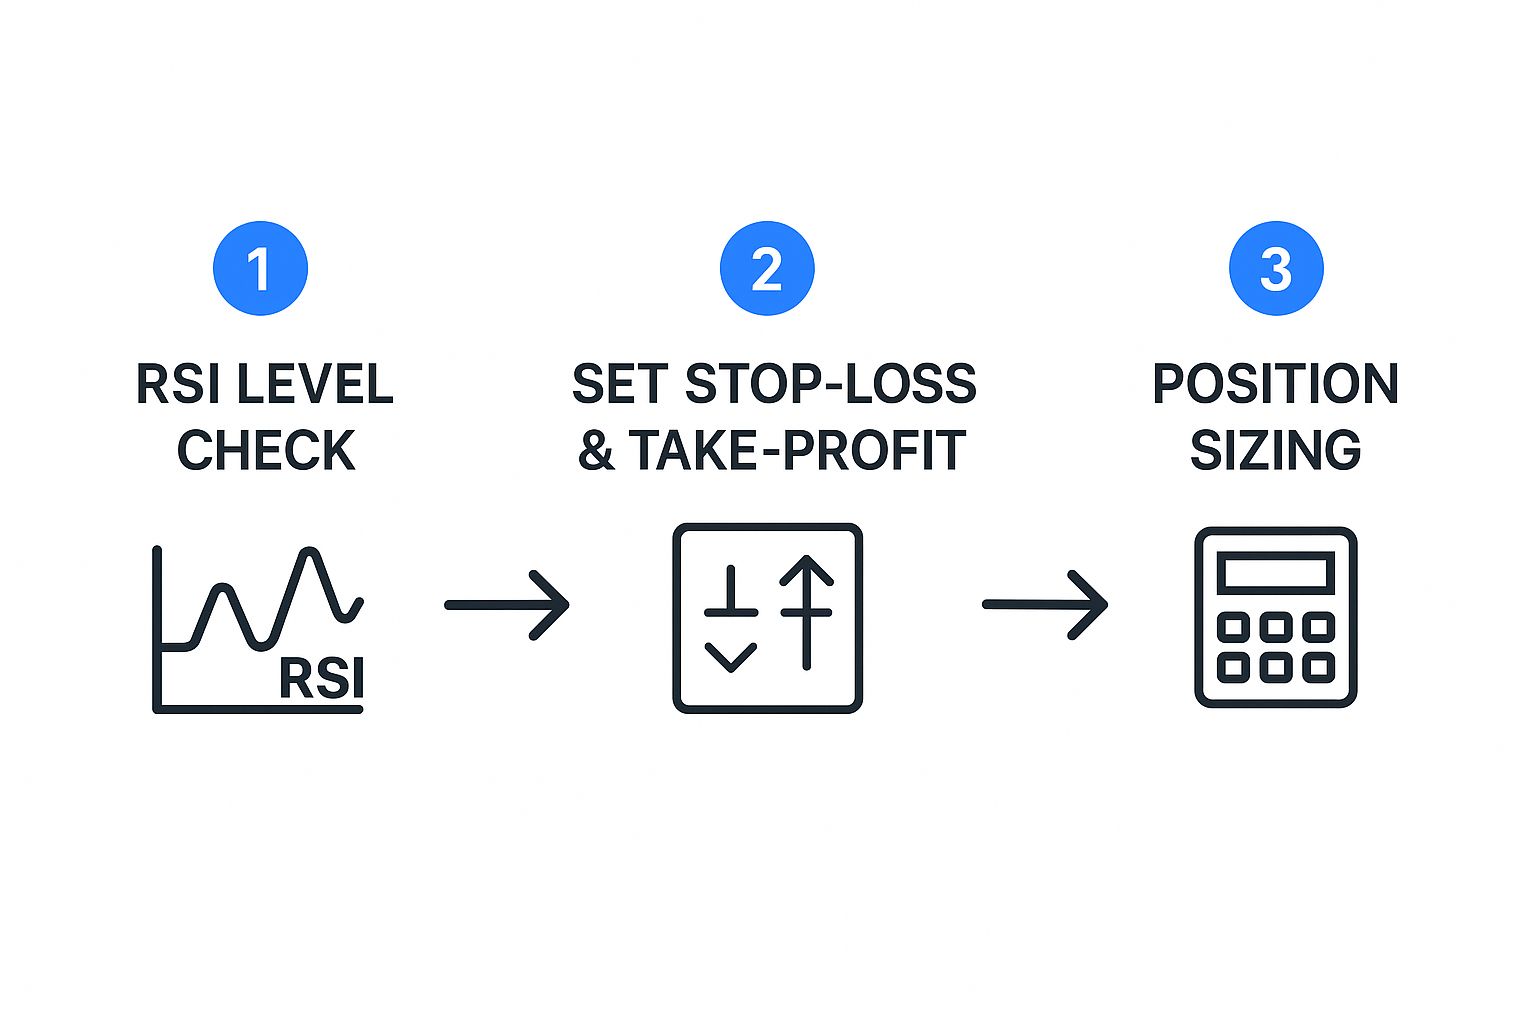 This infographic shows how a typical RSI-based trade flows. Each decision builds on the last, creating a complete trading process.
Backtesting Basics in ChartsWatcher
ChartsWatcher has some really solid backtesting features. You plug in your RSI parameters (period, overbought/oversold levels, entry/exit rules) and test them against historical price data. The platform then simulates trades based on your strategy and spits out detailed performance metrics. I’ve used this myself, and it's been super helpful in seeing how different RSI settings perform in different market environments.
This screenshot from Quantified Strategies gives you an idea of what kind of backtest results you should be looking for. The details aren’t important here, but it shows how useful visualizing your simulated trades can be.
Interpreting Backtest Results: Beyond the Win Rate
A high win rate looks great on paper, but don't get obsessed with it. What you really need to focus on is the overall profitability. That includes the average win size compared to the average loss size. A strategy with a lower win rate but bigger average wins can actually be way more profitable in the long run. Don't forget to look at the maximum drawdown, too. That’s the biggest peak-to-trough drop during the backtest. A big drawdown can wipe you out, even with a high win rate.
The Danger of Curve-Fitting: Avoiding the Backtesting Trap
Here’s a big one: curve-fitting. This is where you tweak and fiddle with your parameters until your strategy looks perfect on historical data. But then, when you try it live, it tanks. It’s like making a key that perfectly fits a lock after you’ve already picked it – totally useless for future locks! To avoid this, test your strategy on different time periods and market conditions. Include both bull and bear markets. ChartsWatcher makes this easy.
Optimizing Your RSI Strategy: Finding the Sweet Spot
Backtesting helps you optimize your RSI parameters. Play around with different periods, overbought/oversold levels, and entry/exit rules. But resist the urge to chase the "perfect" backtest. That’s how you over-optimize. Instead, look for a robust strategy that performs consistently in different situations.
Validating Your Strategy: Forward Testing and Paper Trading
Before you put real money on the line, validate your backtested strategy with forward testing or paper trading. ChartsWatcher offers both. Forward testing runs your strategy live with simulated trades. Paper trading lets you manually make simulated trades. These techniques bridge the gap between backtesting and live trading. Do this for at least a month or two to build confidence.
Key Performance Metrics for RSI Strategies
Keep an eye on these key metrics:
- Net Profit: Your total profit after all wins and losses.
- Profit Factor: The ratio of gross profit to gross loss. Above 1.5 is usually good.
- Sharpe Ratio: Measures risk-adjusted return. Higher is better.
- Win Rate: Percentage of winning trades. Don't rely on this alone.
- Average Trade Duration: How long a trade typically stays open.
By combining thorough backtesting, smart optimization, and validation, you can take your RSI strategy from a hopeful guess to a data-driven approach with a much better chance of success. ChartsWatcher gives you the tools; use them wisely, and you'll be well on your way.
Risk Management That Protects Your Capital
Let's be real, even the slickest RSI strategy in ChartsWatcher won't get you far without a solid risk management plan. It's where so many traders with real potential trip up. So, let's dive into some practical risk management techniques you can use within ChartsWatcher, specifically designed for RSI trading.
Position Sizing: Adapting to Signal Strength
Not all RSI signals are created equal. A screaming divergence or a breakout from extreme overbought/oversold territory deserves a bigger position than a weaker signal. Think of it like this: a bullish divergence backed by high volume and a breakout above key resistance? That’s your cue to invest more. A weaker signal? Maybe ease off the gas. This dynamic approach, easy to manage in ChartsWatcher, helps you squeeze the most out of high-probability setups while keeping potential losses in check.
It's all about being adaptable and responsive to what the market is telling you.
Stop-Loss Strategies: Working With RSI’s Characteristics
Stop-loss orders? Absolutely essential. They’re your safety net, automatically exiting a trade if the price takes a turn for the worse. For RSI trading, placing your stop-loss just below a recent swing low for long positions (or just above a recent swing high for shorts) is a good starting point. ChartsWatcher also has a trailing stop-loss feature, which is a real game-changer. It adjusts your stop-loss as the price moves in your favor, locking in profits and protecting you against sudden reversals.
Think of it as your automated profit protector.
Portfolio Management: Weathering the Drawdowns
Let's face it, no trading strategy wins 100% of the time. Drawdowns – those periods of losing trades – are going to happen. Good portfolio management keeps you in the game during these inevitable rough patches. Don't put all your eggs in one basket; diversify your trades. A good rule of thumb? Risk no more than 1-2% of your total trading capital on a single trade. This keeps your downside manageable and gives you the resilience to bounce back from losing streaks. For an even deeper dive into protecting your capital, check out these proven methods to Automate Data Extraction from PDFs and documents. It might surprise you how much this can help organize your financial life.
Diversification is key for long-term survival and success.
Mastering Trading Psychology: The Mental Game
Trading psychology is a huge factor in RSI trading success. FOMO (Fear Of Missing Out) can lead you to chase trades and make impulsive decisions. On the flip side, fear can freeze you up, preventing you from acting on valid setups. Staying disciplined, especially during false breakouts, is essential. ChartsWatcher’s backtesting feature is your ally here. It lets you see how your strategy would have performed in the past, building confidence and helping you avoid emotional reactions. This article on Mastering Day Trading Risk Management might also give you some valuable insights.
Control your emotions, or they'll control your trades.
Practical Tips for Psychological Resilience
- Develop a trading plan: A well-defined plan helps you stay on track and avoid emotional decisions.
- Stick to your rules: Don’t let impulses derail your strategy.
- Track your performance: Analyzing your trades helps identify areas for improvement.
- Manage your emotions: Be aware of fear, greed, and FOMO – and address them head-on.
- Take breaks: Step away from the charts regularly to avoid burnout.
By combining these risk management and psychological principles, you're shifting from gambling to a calculated, disciplined approach. ChartsWatcher gives you the tools and data; you bring the discipline and mental fortitude for long-term success. It’s a powerful combination.
Your Complete RSI Trading Action Plan
Let's get down to brass tacks and build a practical RSI trading strategy you can use immediately within ChartsWatcher. Think of this as your personalized action plan, clearing the fog and showing you a clear path forward.
Setting Up Your RSI Trading System in ChartsWatcher
First things first: what are you trading? A volatile stock reacts to RSI differently than, say, a stable index. ChartsWatcher's watchlist is perfect for comparing this behavior across different assets.
Once you’ve picked your asset, think about your timeframe. Are you a day trader, a swing trader, or more of a long-term investor? This determines your RSI period settings. Day traders might use a shorter period, like 7 or 9, while swing traders often prefer longer ones, like 14 or 21.
Start with the standard 14-period RSI, 30 for oversold, and 70 for overbought. But remember, these are just starting points. ChartsWatcher makes it easy to tweak these parameters and see the impact on your results—experiment!
Don't rely solely on RSI. I like to pair it with moving averages, volume, or support and resistance levels for confirmation. ChartsWatcher’s charting tools let you visualize these combinations beautifully.
Finally, and this is critical, define your entry and exit rules before you trade. Know precisely when you'll enter and where your stop-loss and take-profit orders will be.
Validating Your Signals: A Checklist for Trade Execution
Before jumping into any trade, run through this checklist:
- RSI Confirmation: Is the RSI actually giving a valid signal? Look for divergence, breakouts from overbought/oversold territory, or trend confirmations.
- Price Action Alignment: Does the price action agree with the RSI? Confirming candlestick patterns or breakouts add weight to your RSI signal.
- Other Indicator Confirmation: Are your other indicators on board? Moving averages, volume, and support/resistance levels should back up the RSI.
- Risk Management in Place: Never forget risk management! Are your stop-loss and take-profit orders set? Are you risking a reasonable amount of capital?
Adapting to Different Market Conditions
Markets are dynamic, and so should your RSI strategy.
- Volatile Markets: Shorten your RSI period for quicker signals, but be ready for some false alarms. Tighten those stop-losses to protect your capital.
- Ranging Markets: Focus on RSI divergences and overbought/oversold signals near support and resistance.
- Trending Markets: Use longer RSI periods and consider trailing stop-losses to maximize your gains on those bigger swings.
Troubleshooting and Continuous Improvement
Even the best strategies need tweaking.
- Too Many False Signals: Lengthen your RSI period or add some extra filters.
- Missing Good Trades: Try shortening your RSI period or relaxing your entry criteria a bit.
- Losing Too Much on Losing Trades: Tighten your stop-losses and revisit your position sizing strategy.
Constantly review your performance within ChartsWatcher. Analyze your wins, losses, and the reasons behind them. This allows you to refine and adjust your strategy based on real results.
Setting Realistic Expectations and Tracking Progress
Trading is a journey, not a sprint. Don’t expect to become a millionaire overnight. Aim for consistent progress, not grand slams. ChartsWatcher helps you track your progress by monitoring key metrics like net profit, win rate, and maximum drawdown.
Whether you’re paper trading or live, ChartsWatcher provides the tools for RSI trading success. Now, it's time to put this plan into action. Ready to take charge of your trading with a powerful, customizable platform? Explore ChartsWatcher today and start building your winning RSI strategy! Discover ChartsWatcher
