Spotting Stocks Breaking Out A Trader's Guide
When you hear traders buzzing about a stock that's "breaking out," they're talking about one of the most powerful signals in the market. A breakout happens when a stock’s price finally punches through a key resistance level, usually on a big surge in trading volume. This isn't just a minor uptick; it's a significant event that suggests the entire mood around the stock is shifting, potentially kicking off a whole new upward trend.
What It Means When a Stock Is Breaking Out

Think of a stock's price like a coiled spring. For days, weeks, or sometimes even months, it gets squeezed into a tight trading range. The price bounces between a clear ceiling (resistance) and a floor (support) as buyers and sellers are locked in a stalemate, building up tension. A breakout is that exact moment the spring is released, launching the price skyward with serious momentum.
This is much more than just a random price spike. It's a critical signal that the tug-of-war between buyers and sellers is over, and the buyers have won decisively. By pushing the price into new territory, they’ve cleared the way for what could be a fresh, sustainable trend.
The Anatomy of a Breakout at a Glance
To really get what's happening during a breakout, you need to see how a few key elements come together. When these pieces align, it’s a good sign you’re looking at a genuine market move and not just a temporary head-fake.
Here's a quick breakdown of what to look for.
| Element | Description | Why It Matters |
|---|---|---|
| Consolidation | The "coiled spring" phase where a stock trades sideways in a defined range, building up energy for a big move. | This period shows a balance between buyers and sellers. The longer the consolidation, the more powerful the eventual breakout can be. |
| Price Thrust | The moment the price decisively pierces through a key resistance level. It's not a gentle creep; it's a confident push. | This is the action signal. It shows that buyers have finally overwhelmed the sellers who were keeping the price down at that level. |
| Volume Surge | A dramatic, noticeable increase in trading volume that accompanies the price thrust. | High volume is your confirmation. It tells you that big institutions are likely buying, lending serious conviction and fuel to the move. |
Think of it this way: the price tells you what is happening, but the volume tells you how much conviction is behind the move.
A breakout without a significant jump in volume is a major red flag. It often means there isn't enough broad market participation to sustain the new price level, making it much more likely to fail and fall back down. Volume is the key ingredient that separates high-probability setups from risky gambles.
Why Breakouts Matter for Traders
For traders, a breakout is more than just an interesting chart pattern; it’s a clear, actionable signal. It pinpoints a potential entry at the very beginning of a strong trend, often creating a fantastic risk-to-reward opportunity.
The core principles are universal. Once you learn to spot the signs of a potential breakout, you can apply them to almost any asset class. It’s the same dynamic whether you're looking at a hot tech stock or identifying breakout signals in commodities.
These events aren't just limited to individual stocks, either. Major market indexes like the S&P 500 have breakouts, too, and these can signal much broader economic shifts. Historically, breakouts from long-term consolidation phases in the S&P 500 have often been the starting gun for entirely new bull markets.
How to Read Breakout Patterns on a Chart
Think of a stock chart as the visual story of a battle between buyers and sellers. The patterns that form are the language of this story, giving you clues about who’s winning and who’s losing. Learning to read these patterns is the key to spotting stocks breaking out just before they make a big move.
Some formations are far more reliable than others at signaling a breakout is coming. These aren't just random shapes on a screen; they represent real market psychology in action. To get the most out of what you’re seeing, it helps to apply some fundamental data visualization best practices.
Ascending Triangle: A Sign of Building Pressure
One of the classic breakout patterns every trader should know is the ascending triangle. This pattern takes shape when a stock’s price gets squeezed between a flat, horizontal resistance line (the ceiling) and an upward-sloping trendline of support (the floor).
Imagine sellers are stubbornly refusing to sell above $50, creating a hard ceiling. At the same time, buyers are getting more aggressive. Each time the price dips, they jump in sooner, creating a series of "higher lows." This tells you the buying pressure is building until, eventually, it has nowhere to go but up. The price punches through the $50 resistance, often with a ton of force.
Flags and Pennants: The Mid-Trend Pause
Flags and pennants are short-term patterns that signal a trend is likely to continue. They look like a brief pause after a sharp, nearly vertical price run-up (what traders call the "flagpole"). This sideways action is the market simply catching its breath before the next move.
- Bull Flag: After a powerful surge, the price drifts down slightly in a tight, rectangular channel. This little pullback is just shaking out the nervous traders before the next leg up.
- Pennant: This is almost identical to a flag, but the consolidation phase forms a small, symmetrical triangle instead of a rectangle.
The psychology is straightforward: the first move was so explosive that the market just needs a moment to consolidate gains. When the price breaks out of the top of the flag or pennant, it’s the signal that the original trend is back on.
These consolidation patterns are critical because they represent a healthy market. A stock that goes straight up without a break is often unsustainable. But one that runs up, pauses, and then runs again shows real strength and conviction from buyers.
The Cup and Handle Pattern
The cup and handle is a longer-term bullish pattern that looks exactly like its name—a teacup on a chart. The "cup" is a wide, U-shaped price move that shows a gradual bottoming-out process followed by a recovery back to the old high.
After the cup forms, the price pulls back slightly on lower volume, creating the "handle." This handle is the final, brief shakeout before the major breakout. When the stock price finally pushes above the resistance of the handle, it confirms the pattern and often kicks off a significant new uptrend. Each of these patterns tells a unique story, and learning to spot them is a core skill for trading stocks breaking out.
Using Volume to Confirm Your Breakout Signal
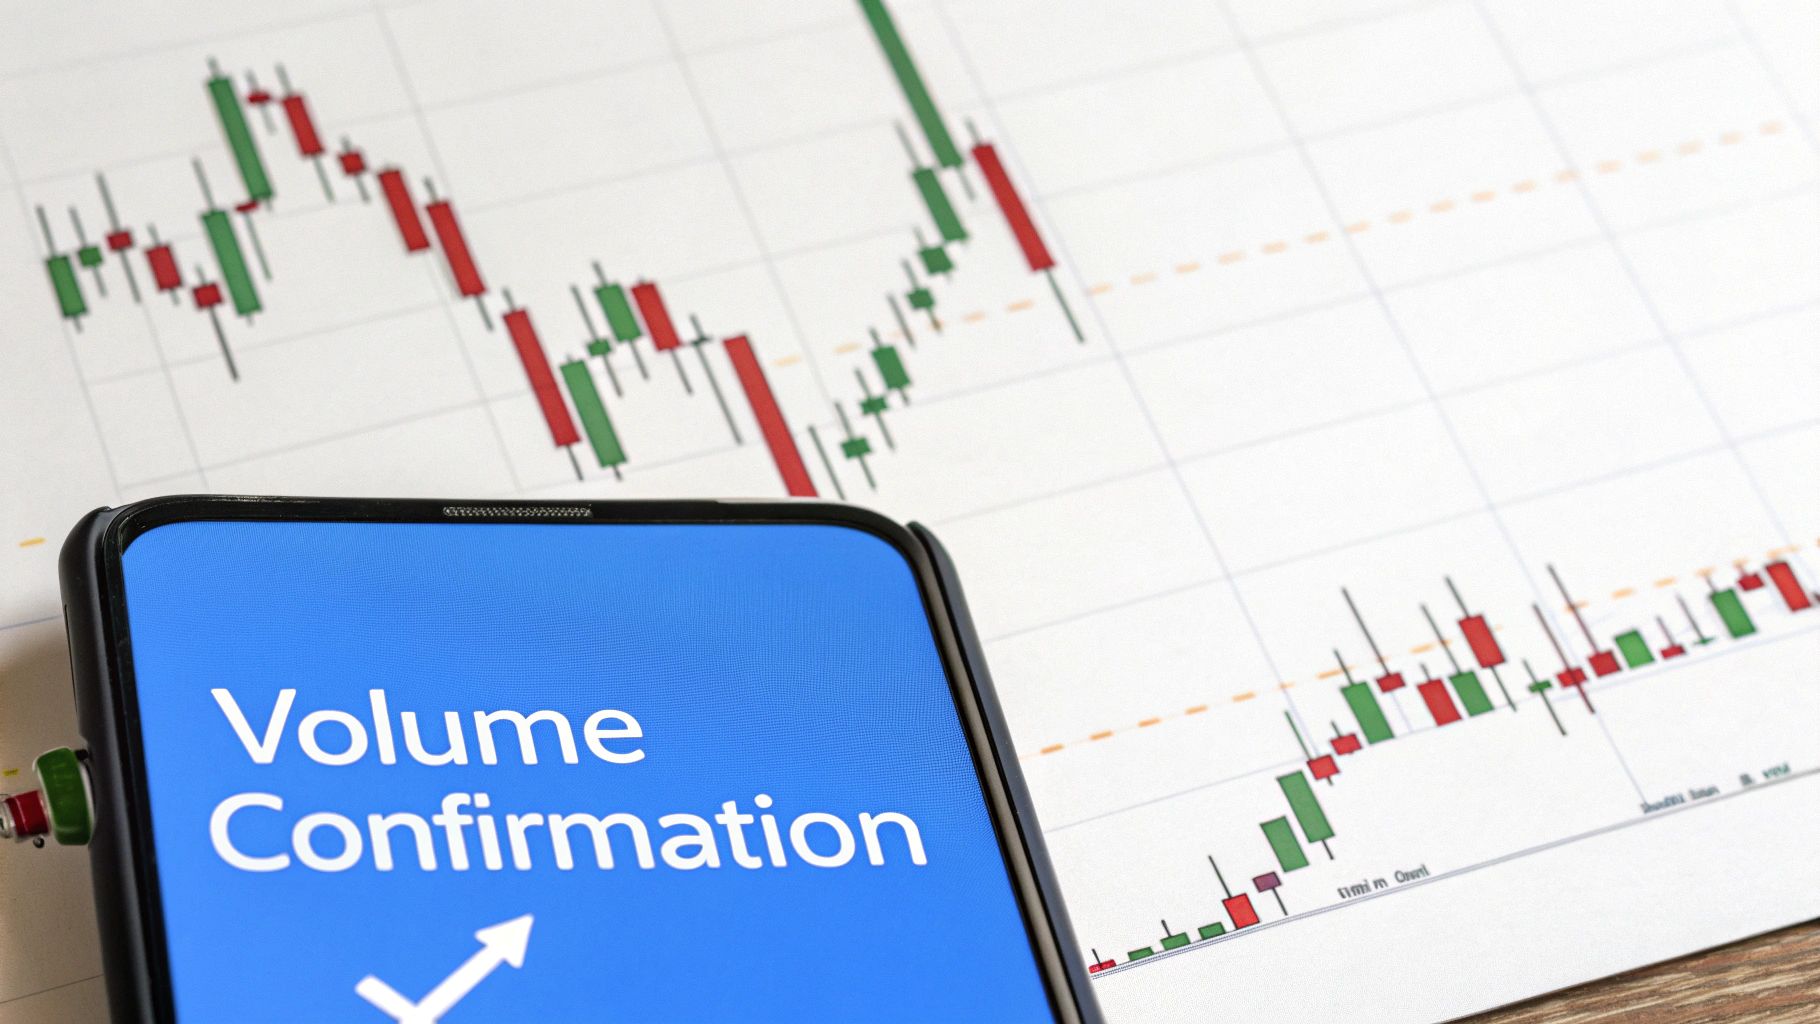
If a breakout pattern tells you what is happening, trading volume tells you why it matters. Think of it this way: a price move without a spike in volume is like hearing a faint rumor. It's interesting, but you can't really trust it.
Volume is the market's conviction. A massive surge in trading during a breakout is the market shouting its agreement on a new price direction. It’s the clearest signal that the move has broad participation from other traders, which is exactly what you need for the price to keep running. Without it, you might be walking straight into a trap.
Big volume often means the big players—mutual funds, hedge funds, and other institutions—are getting involved. These are the folks who move markets. Their buying power is the fuel that powers major trends, so when you see their footprint in the volume bars, you can have much more confidence in the breakout’s strength.
The Litmus Test for a Genuine Breakout
So, how much volume is enough? While there's no single magic number, a widely accepted rule of thumb gives us a powerful guideline.
A breakout is considered truly strong when it happens on a volume surge of at least 50% above its average daily volume. Anything less, and the breakout has a much higher probability of failing and reversing, simply because there isn't enough institutional muscle behind it to maintain momentum.
A breakout on low volume is one of the oldest tricks in the book. It looks tempting, but the price often snaps right back below the resistance level. We call this a "false breakout" or a "fakeout," and it's a primary reason why volume analysis isn't just optional—it's essential.
Distinguishing Real Moves from Fakeouts
Learning to read the interplay between price and volume is your best defense against these traps. When you're eyeing a potential breakout, your first move should always be to glance down at the volume bars.
Here's what you're looking for:
- A High-Conviction Breakout: The price smashes decisively through resistance, and the volume bar below it is a skyscraper compared to its neighbors. This shows widespread agreement and tells you the big money is buying.
- A Low-Conviction Breakout (Warning Sign): The price barely squeaks over the resistance line, and the volume is just average—or even worse, below average. This screams a lack of interest and a high risk of failure.
Learning to spot the difference is a core trading skill. To really master this, check out our guide on how to profit from unusual volume in stocks for more advanced strategies. By always demanding that volume confirms the move, you can dramatically improve your odds when trading stocks breaking out.
Actionable Strategies for Trading Breakouts
Spotting a potential breakout is one thing, but actually making money from it requires a clear, repeatable game plan. Just buying every stock that nudges above a resistance line is a fast track to frustration. Let’s build a practical playbook to turn your analysis into a disciplined trading strategy.
A solid framework for trading stocks breaking out boils down to three critical questions: When do you get in? Where do you get out if you're wrong? And where do you take profits? Get these three right, and you’re miles ahead of the pack. Skipping any one of them can turn a promising setup into a painful loss.
The image below breaks down what a successful breakout often looks like in terms of price, volume, and typical success rates.
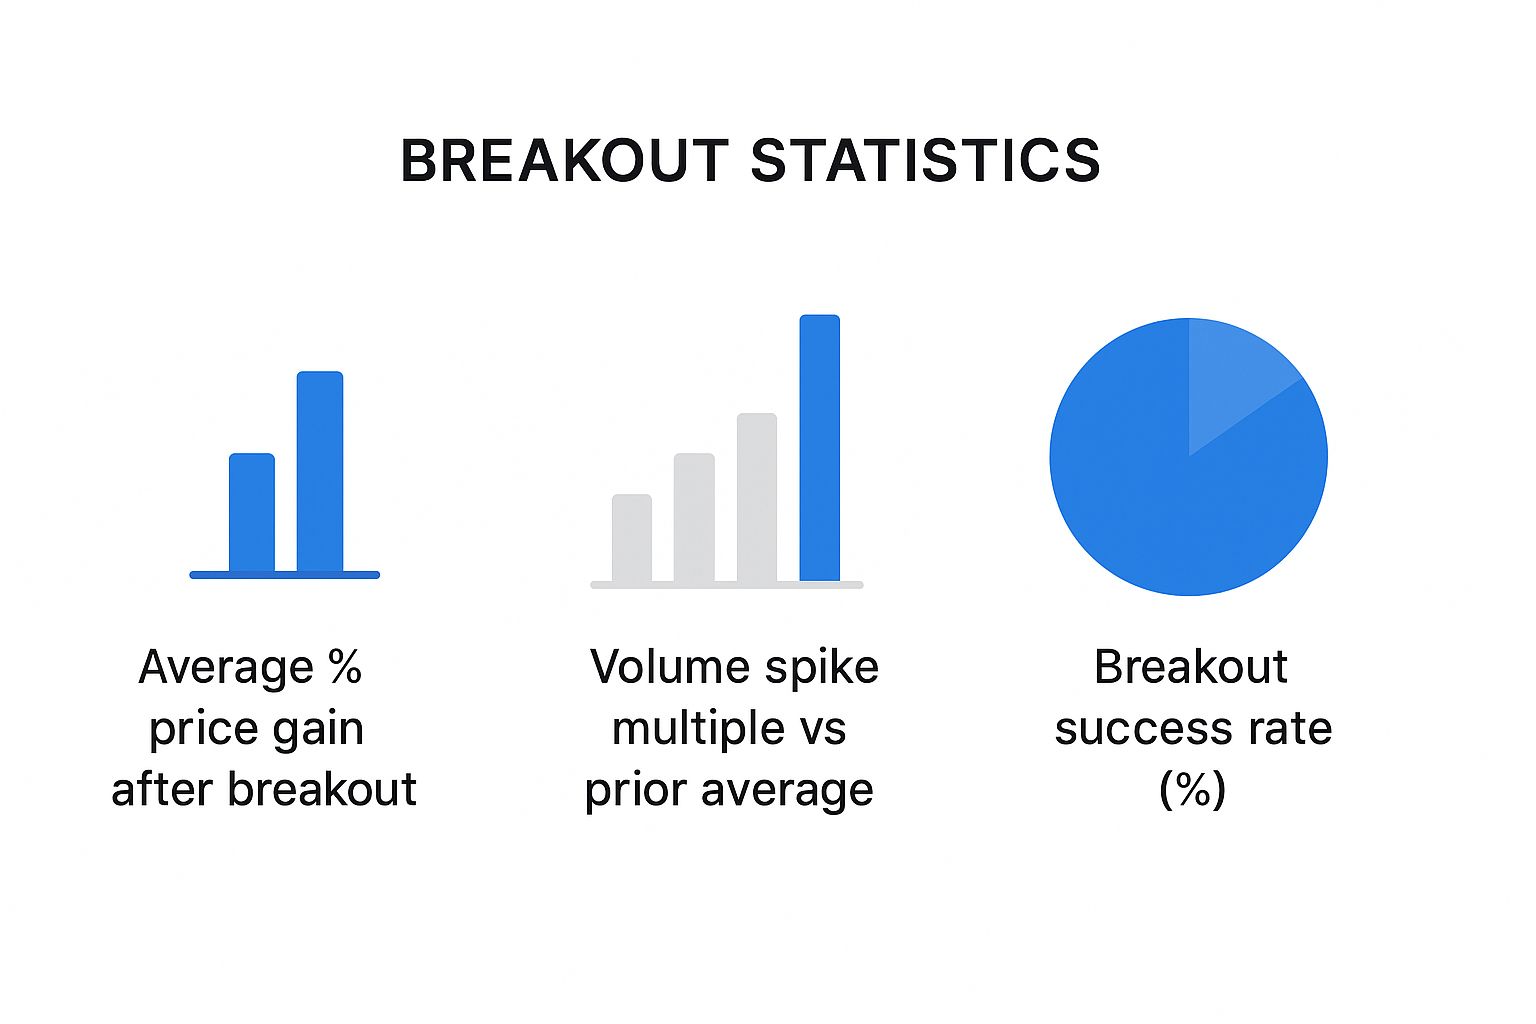
As you can see, there’s a direct link between the strength of the confirmation signals—especially volume—and the odds of the breakout actually following through.
Step 1: Define Your Entry Point
Okay, you've found a stock that looks ready to run. Now for the million-dollar question: when, exactly, do you hit the "buy" button? There are two main schools of thought here, and the best one for you really depends on your stomach for risk and your personal trading style.
Here’s a look at how these two popular entry methods stack up against each other.
Comparing Breakout Trading Strategies
| Strategy | Pros | Cons | Best For |
|---|---|---|---|
| Buy the Initial Surge | - Potential for maximum gains from the very start. - You won't miss the initial powerful move. | - Higher risk of getting caught in a "false breakout" or "head fake." - Can feel like you're chasing the price. | Aggressive traders who prioritize capturing the full move and are comfortable with higher risk. |
| Wait for the Retest | - Provides stronger confirmation that the breakout is real. - Often offers a better risk/reward entry point. | - You might miss the first leg of the move if the stock takes off and doesn't look back. | Conservative traders who value confirmation over catching the absolute bottom of a move. |
So, what does this look like in practice?
-
Buying the Initial Surge: This is the aggressive approach. You place your buy order the second the price clears resistance with a convincing spike in volume. The idea is to get on board right as the rocket is launching so you don’t miss that initial blast-off.
-
Waiting for the Retest: This is the more patient, conservative strategy. After a stock breaks out, it's pretty common for the initial excitement to fade and for the price to pull back to "retest" its old resistance level. If that level now holds as new support, that's your signal to enter the trade.
The aggressive entry offers the biggest potential reward but comes with the very real risk of getting faked out. The conservative retest entry might leave some money on the table initially, but it gives you much stronger confirmation and often a clearer, lower-risk entry point.
Step 2: Set a Protective Stop-Loss
No trading strategy is worth its salt without an exit plan for when you're wrong. A stop-loss is your safety net—a pre-set order that automatically sells your position if the stock drops to a specific price. It's your non-negotiable line in the sand.
For breakout trades, a logical place for a stop-loss is just below the breakout level (the old resistance). If the price falls back through that key level, it’s a clear sign the breakout has failed. It's time to cut the trade, protect your capital, and live to fight another day.
Seriously, never enter a trade without knowing exactly where you'll get out if it goes against you.
How to Build a Scan to Find Breakout Stocks

Trying to find a breakout candidate by manually flipping through thousands of stock charts is a fool's errand. It's like panning for gold in a river with your bare hands—inefficient, exhausting, and you're almost guaranteed to miss the real nuggets. This is where stock scanners become your most powerful ally.
A good scanner flips the script entirely. Instead of reacting to big moves after they’ve already happened, a well-built scan helps you spot stocks breaking out before they hit the mainstream news. It’s about building a custom-tailored watchlist of high-potential candidates, day in and day out.
Core Criteria for a Powerful Breakout Scan
The secret to a great breakout scan is translating what you see on a chart into concrete rules a screener can follow. Your goal is to build a filter that only lets through stocks showing the tell-tale signs of coiled-up pressure and big-money interest.
A solid scan always starts with a few non-negotiable filters:
-
Price Proximity to a Key High: Filter for stocks trading within 5% of their 52-week high. This immediately focuses your attention on companies that have proven strength and are knocking on the door of new, open territory.
-
Minimum Average Daily Volume: Set a floor for liquidity. A 30-day average volume of at least 250,000 shares is a good starting point. This ensures you can get in and out of a position smoothly without getting hammered by slippage.
-
Minimum Stock Price: It's a smart move to weed out the wild west of penny stocks. By setting a minimum price—say, over $10—you instantly narrow your focus to more established companies.
These first few rules act as a bouncer, clearing out all the low-quality noise and leaving you with a clean, manageable list of strong stocks worth a closer look.
Remember, a scanner's job is to build a high-quality watchlist. It's not a "buy" list. Your eyes and your brain still have to vet each candidate to confirm the setup on the chart looks right.
Adding Volume and Volatility Filters
With our base list of strong stocks, it's time to zero in on the ones that look ready to move now. We’re looking for that "coiled spring" effect—a stock that has been quiet but is showing signs of waking up.
-
Unusual Volume Spike: This is the ultimate confirmation signal. Scan for stocks where today’s volume is at least 1.5x to 2x its 30-day average. A sudden surge in volume is often the footprint of institutional players stepping in.
-
Consolidation Range: You want to find stocks that have been trading sideways in a tight range, building energy for the next leg up. A good filter for this is to find stocks where the 20-day price range is less than 10% of the current price. This is a classic sign of accumulation.
The logic behind these filters isn't just theory; it’s backed by years of market data. In fact, one analysis of over 10,000 stocks defined a breakout using similar principles—a price moving above the highest high of a preceding period (like 20 trading days). These methods proved reliable over two decades of different market conditions.
Putting these criteria together in a single scan is a genuine game-changer. For an even deeper dive into refining your approach, check out our guide on using a breakout stock screener with proven strategies from pro traders.
Common Breakout Trading Mistakes and How to Avoid Them
Catching a true breakout can feel like magic, but the path to consistent profits is paved with potential mistakes. New traders, and even some seasoned ones, get tripped up by the same psychological traps over and over again.
The biggest one? The fear of missing out (FOMO). You see a stock launch like a rocket and your gut screams, "Get in now before it's too late!" The problem is, by the time you jump in, the move is already extended and the risk has skyrocketed. Chasing a stock that's miles above its breakout point is a surefire way to buy the top.
Another classic blunder is ignoring weak confirmation signals. A stock's price might poke above resistance, but if there's no serious volume behind it, it’s like a car trying to start with a dead battery. That lack of volume is a massive red flag, signaling that the big institutions aren't on board, making a reversal far more likely.
Building a Defensive Trading Mindset
The best way to sidestep these emotional landmines is to treat trading like a business, not a casino. That means creating a simple, non-negotiable checklist that you follow on every single trade. Think of these as your personal guardrails, keeping you on the road to profitability.
Here are three essential rules to burn into your brain:
- Never Chase a Breakout: If a stock has already ripped more than 5% past its breakout price, just let it go. Seriously. There will always be another setup tomorrow, but your capital is finite.
- No Volume, No Trade: This one is non-negotiable. If the breakout volume isn't at least 50% above its recent average, the trade is off. Volume is the fuel that powers real moves.
- Always Set a Stop-Loss: Know your exit point before you even think about hitting the buy button. Where will you cut your losses if the trade goes south? A logical spot is just below that old resistance level.
Adopting these rules isn't about limiting your opportunities; it's about filtering for only the highest-quality setups. A disciplined trader prioritizes capital preservation above all else, knowing that strong defense is the foundation of long-term trading success.
Frequently Asked Questions About Breakout Trading
Even with a solid game plan, you're going to have questions when trading breakouts. That’s normal. Getting clear on the common sticking points is what builds the confidence to pull the trigger when a real opportunity pops up.
Let's walk through some of the most frequent questions traders have about spotting and playing stocks breaking out.
How Long Should a Consolidation Period Last?
This one comes up a lot: does the length of the consolidation phase actually matter? The answer is a huge yes.
Think of it like coiling a spring. A stock that grinds sideways for a few days is building up a little bit of tension. But a stock that consolidates for several months? That’s winding the spring tight, building up an enormous amount of potential energy. When it finally releases, the move is often way more explosive and sustainable.
Longer bases lead to stronger moves. It’s a foundational concept of breakout trading.
What Is the Difference Between a Breakout and a Fakeout?
Learning to tell a real breakout from a deceptive "fakeout" is one of the most critical skills you'll develop. A fakeout is when a stock's price pokes its head just above a resistance level, luring in all the eager buyers, only to slam back down into its old range. It’s a classic bull trap.
So how do you tell them apart? It really comes down to confirmation.
- Conviction: A true breakout doesn’t tiptoe; it kicks the door down. The price action is decisive and strong. A fakeout often looks weak and hesitant, barely managing to peek above the line before retreating.
- Volume: This is the ultimate tell. A real breakout almost always happens on a massive surge in trading volume. It shows institutional muscle is behind the move. Fakeouts, on the other hand, usually happen on light, unconvincing volume.
A fakeout is designed to prey on your impatience and FOMO. If you make a rule to always demand strong volume confirmation, you'll sidestep the vast majority of these traps and stick to the high-probability plays.
Can Breakout Trading Work on Different Timeframes?
Absolutely. The beauty of breakout principles is that they are fractal—they work on any timeframe, for any style of trading. A day trader might be hunting for breakouts on a 15-minute chart, looking to capture a quick intraday profit.
A swing trader, meanwhile, could be spotting breakouts on daily or weekly charts, planning to hold the position for several days or even weeks. And long-term investors often use breakouts from multi-year bases as the signal to start building a major position. The core concepts of price, volume, and consolidation are universal.
Ready to stop searching and start finding? ChartsWatcher provides the powerful, real-time scanning and customizable alerts you need to spot high-potential breakout stocks before they move. Build your perfect scan and take control of your trading at https://chartswatcher.com.
